by Senthil Palanisamy | Sep 6, 2017 | BizTalk Community Blogs via Syndication
Introduction
BizTalk server state based artifacts such as receive location, send port, orchestration may go down due to various reasons. This could stop a business critical interfaces from processing messages. Monitoring the artifact states is a tedious task for both operational and administrative users. The operational users must monitor the state of artifacts constantly if any violation happens to the artifact state the operational user will intimate the administrative users immediately. In turn, administrative users should take corrective actions to bring the artifact to the expected state to avoid/minimize the business impact. This process involves the operational and administrative users be available throughout the clock to enable the interfaces again. BizTalk360 overcomes this challenge with its auto healing capability.
I am writing series of articles on “Automating BizTalk Administration Tasks Using BizTalk360”. First Blog was focused on service instance data monitoring. In this article, I will be explaining how you can leverage auto healing capability in BizTalk360.
How it works
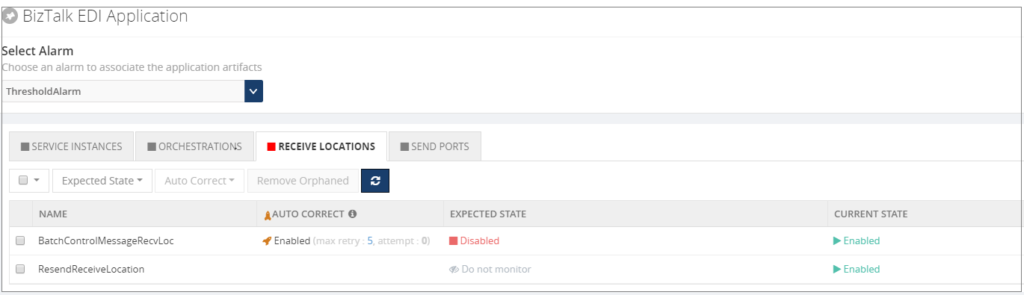
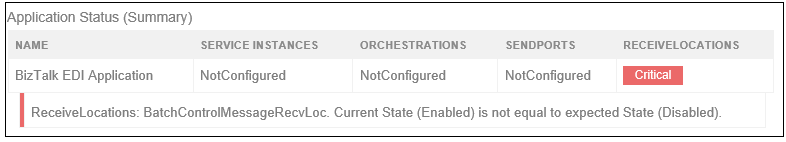
With the auto healing functionality, Administrators can set up monitoring on any “State-based” artifact and let the monitoring service to automatically heal the artifact any time when there is a mismatch between the “Expected State” and “Current State”. For instance, Administrators can set up monitoring on the receive location(s) of an application and additionally set up the auto correct functionality for the Expected State of the artifact (which should be “Started”). Whenever the receive location goes down/gets disabled, there will be a state mismatch and the auto correct will try to bring the artifact back to the expected state. If the operation is successful, the artifact will come back to the Expected State within the next monitoring service cycle (60 seconds).
State Based Monitoring
Artefacts State Based monitoring is one of core feature in BizTalk360. State Based monitoring is included for Application Artefacts
- Send Ports
- Receive Location
- Orchestrations
- Host Instances
- NT Services
- SQL Jobs
- Logic Apps
To avoid this manual intervention, administrators can set up the “Max Retries” count in the auto healing. This would allow the auto healing (BizTalk360 monitoring service) to continuously try and bring back the receive location to “Enabled State”. If the operation was successful within the Max Retry count, the artifact would be automatically healed to ensure business continuity. If the operation was not successful within the Max Retry count, the artifact would move into a Critical state.
Email Notification
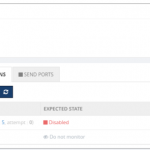
Artefact (Receive Location) is configured for monitoring and auto healing when the receive location violates the threshold condition means monitoring service will first trigger the down alert.
Monitoring service will auto correct the state of receive location to expected state and trigger an auto correct email.

Custom BizTalk Adapters
Custom BizTalk adapters are used in Receive Location/Send Port; In this case, we must install Custom adapter components in BizTalk360 servers.
If you have installed BizTalk360 Monitoring service in multiple servers for BizTalk360 HA then install Custom Adapters pack in multiple servers.
We can few cases where custom adapters pack needs to be installed;
1. BizTalk Scheduler Adapter
When you are using BizTalk Scheduler in BizTalk Artefacts and not installed in BizTalk360 Box. Then you will get the error as like below
“ReceiveLocations: Exception raised while trying to set receive locations to the expected state. Ex: Microsoft.BizTalk.ExplorerOM.BtsException: Could not validate TransportTypeData, Address or Public Address properties for Receive Location ‘Receive_INV_Scheduler’ “
To address this issue we need to GAC Microsoft.BizTalk.Scheduler.dll in BizTalk360 Box(es).
2. nSoftware Adapter
nSoftware Adapters are used in BizTalk Artefacts (e.g.: FTP(s)/SFTP Adapters). Exception raised while trying to set receive locations to the expected state by auto correct feature.
“Ex: Microsoft.BizTalk.ExplorerOM.BtsException: Failed to create ‘nsoftware.SFTP v4’ Transport Component at Microsoft.BizTalk.ExplorerOM.BtsCatalogExplorer.SaveChangesWithTransaction(Object transactionObj)”
Overcome this challenge we need to install the nSoftware adapters where BizTalk360 Monitoring service is running.
3. Host Integration Adapter Pack
BizTalk Artefacts are using MQSC (HIS) adapters in your BizTalk Environment means you have to install Host Integration Pack Adapters.
The following are adapters in Host Integration Adapter Pack
- Host Applications
- DB2
- WebSphere MQ
- Host Files
User Permission
Taking automatic actions on BizTalk Artefacts, SQL Jobs, Host Instances and NT Services we need adequate permissions to Service Account user with respect to Windows, SQL, and Azure.
| Feature |
Minimum Required Permission |
| BizTalk Artefacts – To change the status of BizTalk Artefacts |
BizTalk Operators Group |
| Host Instances – Operations (WMI) |
BizTalk Administrator Group |
| SQL Jobs – Change state of Jobs |
SQLAgentOperatorRole |
| Logic Apps – Enable/Disable |
Owner (Subscription User) |
You can see more information about BizTalk Server Security.
Conclusion
BizTalk users can leverage this most powerful feature “Auto Healing” in BizTalk360 to maintain/monitoring the states of various Artefacts. It will minimize the downtime of BizTalk Artefacts.
Author: Senthil Palanisamy
Senthil Palanisamy is the Technical Lead at BizTalk360 having 12 years of experience in Microsoft Technologies. Worked various products across domains like Health Care, Energy and Retail. View all posts by Senthil Palanisamy
by Sandro Pereira | Sep 6, 2017 | BizTalk Community Blogs via Syndication
Sometimes the best option to create a REST API and provide something for to the partners to try it out (documentation or starting to developer their side), especially if the requirements are not completely defined, is not to start coding your backend API, which takes more time to develop and which sometimes will be subjected to constant changes, becoming in many cases an inglorious work and a complete waste of time (… sometimes) but instead to prototype your API in your frontend system. So in this post, I will address the question: How to mock responses in API Management?
API Management provides different, powerful and easy ways to mock your API’s to return static or dynamic sample responses even when there is no functional backends service capable of providing them. Mocking can be very useful in several scenarios like:
- Create proof of concepts or demos
- Test Driven Development approach: when the API façade is designed first and the backend implementation comes later or is worked upon in parallel.
- When the backend is temporarily not operational.
- When a specific operation is not yet implemented.
- And so on…
Despite being pretty simple to set up a mock, at the moment there are several ways to archive this in API Management, some of them more simple and static and others more complex and dynamic. So, let’s see all the options.
Options 1) Using the return-response policy in the “old” Publisher portal
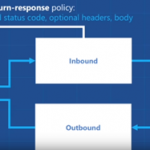
Using the return-response policy, it would halt the execution of the API pipeline (… if it exists) and return a response code as specified. You can also send an optional set of headers and a body to the caller.

(Picture from https://www.youtube.com/watch?v=SDyUw93hx1w)
Note: One of the beautiful things on using this policy, comparing with the mock-response policy that we will describe in option 3, is that the mock can be implemented in a very dynamic way if you combine this policy with expressions.
To accomplish that we need to:
- Access to the “old” Publisher portal, by accessing you API Management resource in Azure Portal and then click “Publisher portal” button

- On the Publisher portal, select the option “Policies” from the left menu

-
- Note: Policies can be configured globally or at the scope of a Product, API or Operation.
- The next step is to define the scope of the policy, in our sample, we will be selecting a particular operation. To do that you need to select you API from the “API” drop box and then the specific operation from the “Operation” drop box.
- And then on the “Policy definition” click “ADD POLICY”

- Add a return-response policy in the inbound section by:
- Focus the cursor in the inbound section and then from the Policy statements toolbox click in the option

-
- TIP: When mocking, the policy should always be used in the inbound section to prevent an unnecessary call to the backend.
- This will add the default template format of the policy to the policy definition, that you will need to set up according to your needs:

- To simplify our case, we just need to return a 200-status code with a static JSON response and for that, we need to apply the following policy:
<return-response response-variable-name="existing response variable">
     <set-status code="200" reason="OK" />
     <set-header name="Content-Type" exists-action="override">
         <value>application/json</value>
     </set-header>
     <set-body>{
                 "success": true,
                 "data": {
                    "cards": [
                       {
                          "id": 28,
                          "Name": "Sandro Pereira"
                       },
                       {
                          "id": 56,
                          "Name": "Carolina Pereira"
                       },
                       {
                          "id": 89,
                          "Name": "José Pereira"
                       }
                    ]
                 }
     }</set-body>
</return-response>
- Save the policy to take effect next time a call is made to the operation.
Of course, this policy can be used in many different ways, for example, if you only want to return a 200 OK without body response, you can use an abbreviated version of the policy that will be represented like this:
<return-response/>
But as I told you earlier that this also can be very dynamic as you can see in the “Mocking response in Azure API Management” tutorial provided by Microsoft where they are mocking an “Add two integers” operation in which the policy will look like this:
<return-response response-variable-name="existing response variable">
     <set-status code="200" reason="OK" />
     <set-header name="Content-Type" exists-action="override">
         <value>application/json</value>
     </set-header>
     <set-body>{
          "success": true,
          "data": "@((Convert.ToInt32(context.Request.Url.Query.GetValueOrDefault("a", "0")) + Convert.ToInt32(context.Request.Url.Query.GetValueOrDefault("b", "0"))).ToString())"
     }</set-body>
</return-response>
Here, I am taking the actual query parameters provided in the request and implementing the all the operation logic of my backend API dynamically inside my policy… pretty cool!
Options 2) Using the return-response policy in the Azure Portal.
This second option is exactly the same as the previous one, but instead of doing in the “old” Publisher portal, we will accomplish the same goal using the “new” API Management capabilities/functionalities embedded in the Azure portal.
To accomplish that you need to:
- Access your API Management resource in Azure Portal and then click “APIs” option under “API Management” section from the left menu

- Select the API from the API list, then from the operation list select the correct operation and then click the edit button on the “Inbound processing” policies

- Click in “</> Code View” to view or edit your policies as explained earlier in the first option

- You will find the same experience as the “old” Publisher portal while editing the rules

Both option 1 and 2 are the same, the only difference between them is that in the first option we are using the Publisher portal (this portal still exists because not all functionalities have yet been migrated for the Azure Portal) and in the second we are using the Azure Portal UI.
Options 3) Using the Mock-Response policy
The first two options, that in fact use the same rule are very useful in several distinct scenarios, especially if you want to implement some intelligence (dynamic responses) in you mock.
But what if you want to combine your mocking cases against our API specifications that we used while creating our operations? Fortunately for us, Microsoft released a few months ago a new policy to perform this task in an easier way and you can now use the Mock-Response policy to achieve this effect and it is fully supported through the UI in the Azure Portal.
Note: this policy can also be used in the “old” Publisher portal but I will not address that.
TIP: Once again, you can apply this policy to every section, but its typical usage scenario is on the inbound path to provide a response instead of the backend service and also to prevent unnecessary calls to the backend.
To configure this policy from the Azure Portal you need to:
- Access your API Management instance, under “API Management” section click “APIs”, select the API from the API list, then from the operation list select the correct operation and then click the edit button on the “Inbound processing” policies to open the Inbound processing editor

- You will now notice that a tab titled “Mocking” is available, in which you can configure the desired static response back to your caller by:
- Selecting the “Static responses” option
- And what response status should be returned by configuring the “API Management will return the following response” drop box

Are you wondering where you can define the response?
If you look at the description of this policy in the documentation it says: “… as the name implies, is used to mock APIs and operations. It aborts normal pipeline execution and returns a mocked response to the caller. The policy always tries to return responses of highest fidelity. It prefers response content examples, whenever available. It generates sample responses from schemas, when schemas are provided and examples are not. If neither examples or schemas are found, responses with no content are returned.”
So, in other words, when designing the operation specification:
- if you provide expected response types and samples:

-
- The mock-response policy will take this sample response that you defined as the response to be delivered to the caller
Note: If there are already response status codes, with or without content types, examples and schemas defined, configured on that particular operation (as shown in the figure above), these HTTP status codes will be listed at the top of the “API Management will return the following response” drop box on the mocking section.

- if you instead provide a response schema instead of samples, the mock-response policy will generate a sample response from the schema provided
- If you don’t define samples or schemas, the policy will return a 200 OK response with no content return.
Normally, the policy template (or signature) is:
<mock-response status-code="code" content-type="media type"/>
However, as similar with the return-response policy, you can use an abbreviated version of the policy that looks like this:
<mock-response/>
And again, it will return a 200 OK status code and the response body will be based on an example or schema, if provided for this status code. The first content type found will be used and if no example or schema is found, a response with no content will be returned.
Conclusion
Both mock-response and return-response policies can be used on API Management for prototyping your API frontend. Although at first glance they may have similar behaviors, both policies have advantages and disadvantages and can be used in different scenarios/context.
But I will probably say for mocking propose I will use or advice to use the mock-response policy just because it is simpler and will take advantage from the API specification to generate the mock response which also “force” the developers (or admins in charge of your frontend) to properly document the APIs.
Author: Sandro Pereira
Sandro Pereira lives in Portugal and works as a consultant at DevScope. In the past years, he has been working on implementing Integration scenarios both on-premises and cloud for various clients, each with different scenarios from a technical point of view, size, and criticality, using Microsoft Azure, Microsoft BizTalk Server and different technologies like AS2, EDI, RosettaNet, SAP, TIBCO etc. He is a regular blogger, international speaker, and technical reviewer of several BizTalk books all focused on Integration. He is also the author of the book “BizTalk Mapping Patterns & Best Practices”. He has been awarded MVP since 2011 for his contributions to the integration community. View all posts by Sandro Pereira
by Venitta Priya | Sep 6, 2017 | BizTalk Community Blogs via Syndication
What is Web Endpoint?
In simple terms, a web service endpoint is a web address (URL) at which customers of a specific service can gain access to it. By referencing that URL, customers can get to operations provided by that service. The endpoint is a connection point where HTML files or active server pages are exposed. Endpoints provide information needed to address a Web service endpoint.
Why Web Endpoint:
Typically, in a BizTalk environment, an application needs to associate with external web endpoints to monitor and validate the health of the web endpoint. BizTalk360 allows the administrators to set up web endpoints monitoring for the web services in the solution and validate the actual response code against the expected return code.
Before version 8.1, web endpoint monitoring had the capability to manage the external endpoints using options like to provide authorization credentials and with a proxy. While monitoring the endpoint, if there is any mismatch between the expected return code and actual return code, the system will alert to the administrator with the information. In 8.1 version, we have improved with some more interesting options like Payload and Custom HTTP headers.
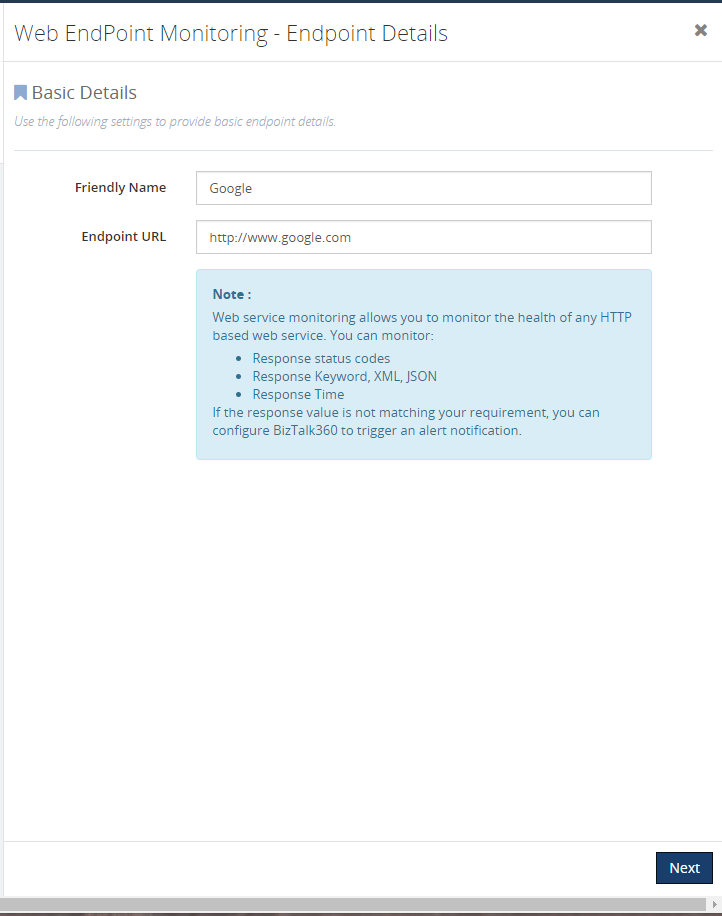
Basic Detail
In basic detail, we can give the Endpoint name which is going to be monitored. In Endpoint URL, we can give the URL of the web endpoint for ex. www.google.com
Optional details configuration
In this section, we can have a deep look at the new optional settings available for monitoring the endpoint. This is an optional section, you can skip this configuration.
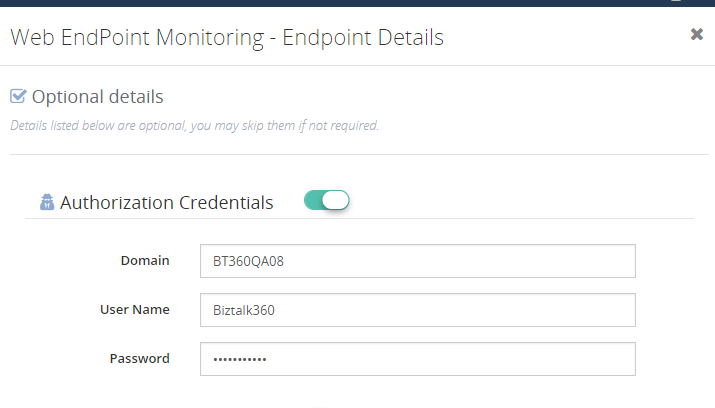
Authorization credentials:
Web endpoint will require Username and Password for monitoring. In that scenario, we can utilize this option. For ex, if we need to access remote machine URL, in this case, we need to specify the domain name, user name, and password. If you can monitor the endpoint without any issue, then it will be healthy else it will return an error message.
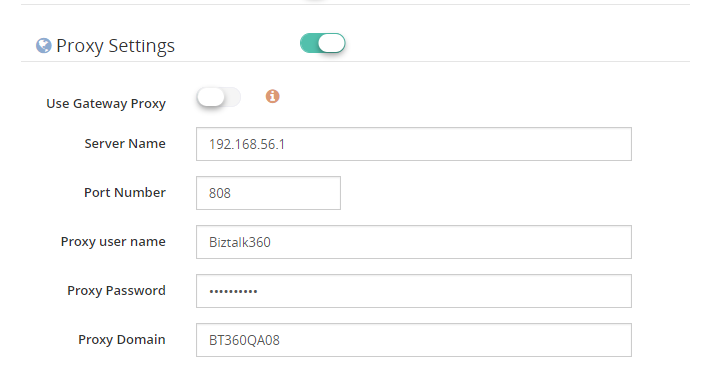
Proxy:
Some organization will be using a proxy, in that case, you can give the proxy details to monitor the endpoint. In you enable the toggle button near the Use Gateway Proxy it will fetch the proxy details which we have given in the settings -> gateway settings. Global gateway settings can be overridden by giving the below details
- Server Name– the name of your proxy server
- Port Number– the port number used to associate through your proxy
- Proxy username– the username to associate with the proxy server
- Proxy password– the password to authenticate the credentials to associate with the proxy server
Payload:
When data is sent over the Internet, each of the transmitted unit includes both header information and the actual data being sent. The header identifies the source and destination of the packet, while the actual data is referred to as the payload. The part of the message or code that carries the data. In a key-length-value structure, the key and length are descriptive data about the value (the payload). Here we can configure the parameters of GET or POST methods. Some Endpoints cannot be monitored without giving additional parameters. We can retrieve those information’s using payload and monitor those API in web endpoints.

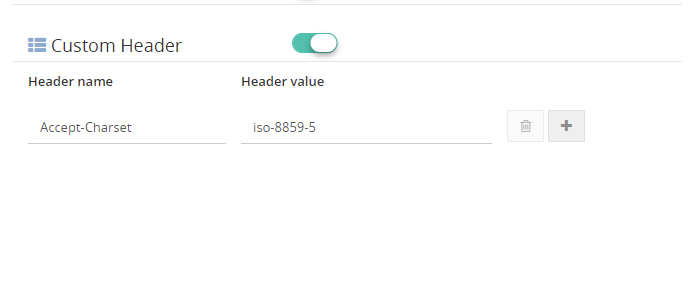
Custom header:
HTTP headers allow the client and the server to pass additional information with the request or the response. You can give custom headers along with the endpoint which you are going to monitor. (Ex: Accept-Charset, Accept-Language, Allow, Authorization, Content-Language)
Response alert configuration
Here comes the response alert configuration section, you can see three type of response format. We will see one by one.
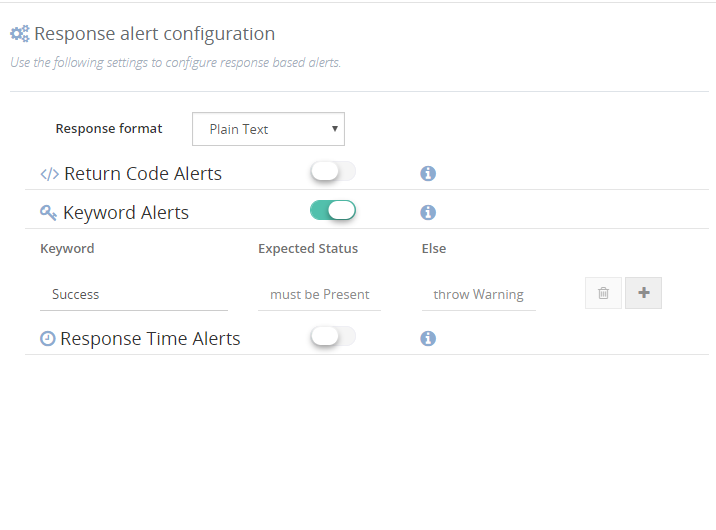
Response Format:
Plain text: In this type, you can see Keyword alert where you can specify the keyword which will be available in the endpoint which you are monitoring
Ex. Let’s go with www.google.com
If you mention the keyword as Success and if it is present in the endpoint the status will be healthy based on the conditions.
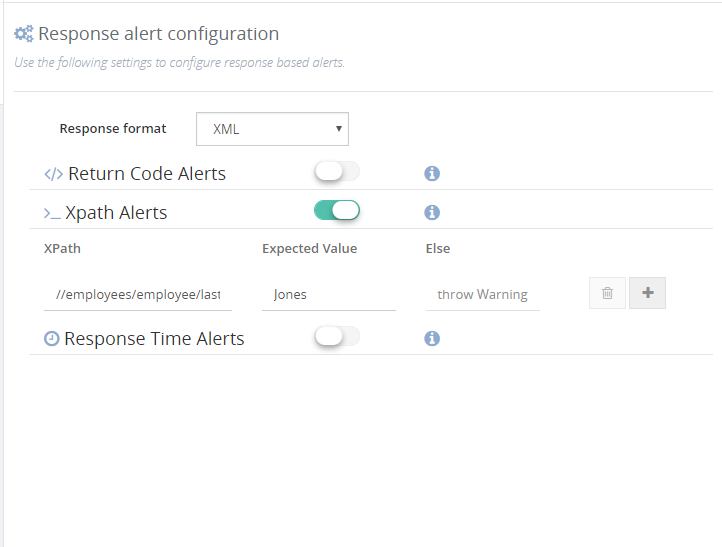
XML: Here you can see _XPath Alerts, you can even monitor your endpoints using XPath.
Ex. You have an endpoint with XML data and you need some specific information in that case you can give XPath and monitor the endpoint. Say, your endpoint is having information about employees and you want to fetch the name of the 3rd employee, at that time you can give as
//employees/employee/lastName Jones
Example:
<employees>
     <employee>
         <firstName>John</firstName> <lastName>Doe</lastName>
     </employee>
     <employee>
         <firstName>Anna</firstName> <lastName>Smith</lastName>
     </employee>
     <employee>
         <firstName>Peter</firstName> <lastName>Jones</lastName>
     </employee>
 </employees>
If the given XPath values are true, then endpoint will be healthy else it will show error/ warning based on the configurations.
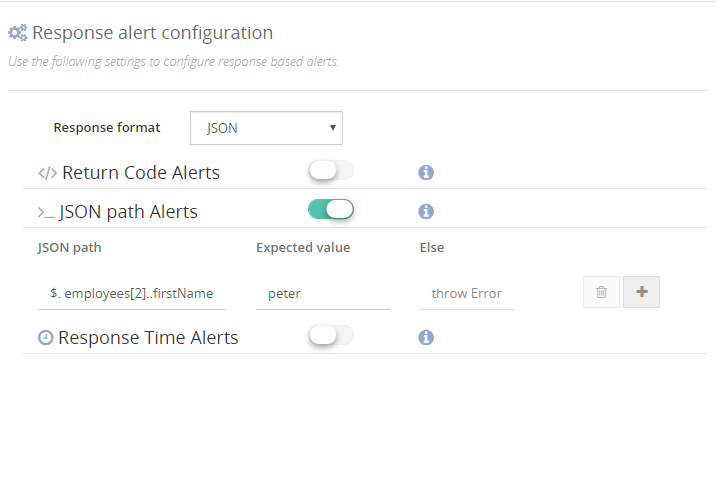
JSON: Same as XPath you can see JSON path alerts, and monitor the endpoint using JSON path. Say, for an example, an endpoint with Json data and looking for some specific data – 3rd employee:
{“employees”: [
{ “firstName”:”John”, “lastName”:”Doe” },
{ “firstName”:”Anna”, “lastName”:”Smith” },
{ “firstName”:”Peter”, “lastName”:”Jones” }
]}
$. employees [2]..firstName peter
If the given Json path values is true, then endpoint will be healthy else it will show error/ warning based on the configurations.
Return Code Alert:
Endpoints can be monitored based on the return codes. If you set return code as 200 and while monitoring if the endpoint does not have the expected return code. then it will indicate error/warning based on the configuration else it will be healthy.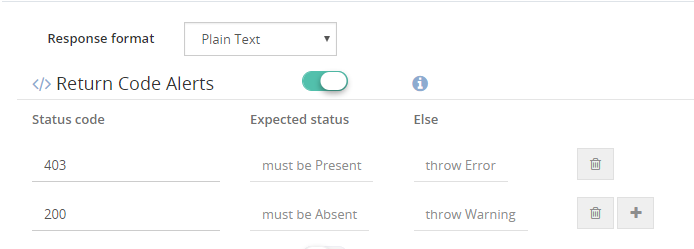
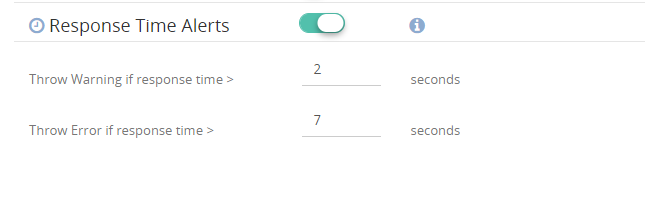
Response time Alerts:
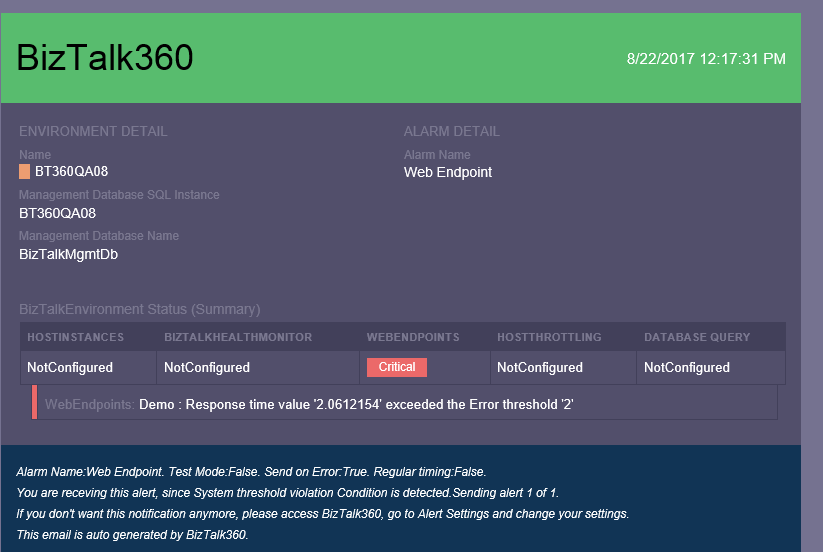
The same way we can monitor the endpoints using response time. We can monitor the delay of the endpoint using this setting. We can change the response time based on the necessity.
Based on the configuration we have provided we will get the notification in email.
Conclusion:
So I hope this blog gave you some idea about how you can monitor Web Endpoint in BizTalk360. If you have any questions, contact us at [email protected]. Also, feel free to leave your feedback in our forum.
by BizTalk Team | Sep 4, 2017 | BizTalk Community Blogs via Syndication
Microsoft BizTalk Server product team has released Cumulative Update 3 for BizTalk Server 2016. For more information, see Microsoft Knowledgebase Article 2555976, posted to
https://support.microsoft.com/help/4039664.
BizTalk Server Team
by Eldert Grootenboer | Sep 4, 2017 | BizTalk Community Blogs via Syndication
When implementing software, it’s always a good idea to follow existing patterns, as these allow us to use proven and reliable techniques. The same applies in integration, where we have been working with integration patterns in technologies like BizTalk, MSMQ etc. These days we are working more and more with new technologies in Azure, giving us new tools like Service Bus, Logic Apps, and since recently Event Grid. But even though we are working with new tools, these integration patterns are still very useful, and should be followed whenever possible. This post is the first in a series where I will be showing how we can implement integration patterns using various services in Azure.
Message Router Pattern
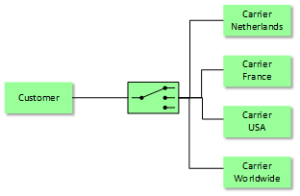
The first pattern which will be shown is the Message Router, which is used to route a message to different endpoints depending on a set of conditions, which can be evaluated against the contents or metadata of the message. We will implement this pattern with different technologies, where we will focus on Logic Apps in this post. For this sample we will implement a scenario where we receive orders, and depending on the city where the order should be delivered we will route it to a specific carrier.
Scenario
When using Logic Apps, we can easily route a message based on its contents to various endpoints. Using a Logic in combination with the Message Router pattern is especially useful when we have the following requirements:
- Different types of endpoints; the power of Logic Apps lies in the many connectors we get out of the box, allowing us to easily integrate with various systems like SQL, Dynamics CRM, Salesforce, etc.
- Small amount of endpoints; as we will be using a switch in our Logic App, managing these becomes cumbersome when we have many endpoints.
In this sample we write the messages to Github Gists, but you could easily replace this with other destinations. We use a HTTP Trigger, meaning we receive the message on a http endpoint, where the message format is as the following.
{
    "Address":"Kings Cross 20",
    "City":"New York",
    "Name":"Eldert Grootenboer"
}
|
We use a switch to determine the endpoint to which we will send our message based on the city inside the message body, and send out the message to our endpoint, in this case using a HTTP action. Of course we could send the message to any other type of endpoint from our cases inside the switch as well. Finally we will respond the location of the Gist where the message was placed.
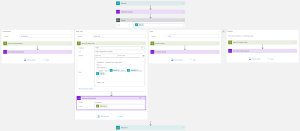
Logic App Implementation
You can easily deploy this solution from the Azure Quickstart Templates site, or use the below button to directly deploy this to your own Azure environment.

by Gautam | Sep 4, 2017 | BizTalk Community Blogs via Syndication
Do you feel difficult to keep up to date on all the frequent updates and announcements in the Microsoft Integration platform?
Integration weekly update can be your solution. It’s a weekly update on the topics related to Integration – enterprise integration, robust & scalable messaging capabilities and Citizen Integration capabilities empowered by Microsoft platform to deliver value to the business.
If you want to receive these updates weekly, then don’t forget to Subscribe!
On-Premise Integration:
Cloud and Hybrid Integration:
Feedback
Hope this would be helpful. Please feel free to let me know your feedback on the Integration weekly series.

by Sandro Pereira | Sep 3, 2017 | BizTalk Community Blogs via Syndication
Welcome back to a new post about BizTalk Server Tips and Tricks! And this time I would like to talk about a very important topic for BizTalk Administrators: BizTalk MarkLog tables.
All the BizTalk databases that are backed up by the ‘Backup BizTalk Server’ job, which means all the default BizTalk databases (SSODB, BizTalkRuleEngineDb, BizTalkMsgBoxDb, BizTalkMgmtDb, BizTalkDTADb, BAMPrimaryImport, BAMArchive and BAMAlertsApplication) with the exception of the BAM Star Schema database (BAMStarSchema), have a table called “MarkLog”.
The only thing that these tables store, is a timestamp in a string format (Log_<yyyy>_<MM>_<dd>_<HH>_<mm>_<ss>_<fff>) that tells you each time the ‘Backup BizTalk Server’ job performs a backup of the transaction log of that specific database.
Note: This task is performed by the 3rd step (MarkAndBackUpLog) of the ‘Backup BizTalk Server’ job
So, each time this step runs, by default each 15 minutes, a string is stored in that table. Unfortunately, BizTalk has no out-of-the-box possibilities to clean up these tables. The normal procedure is to run the old Terminator tool to clean it up, which nowadays is integrated with the BizTalk Health Monitor.
Both of them (they are actually the same tool) has two major problems:
- Using these tools, it means that we need to stop our BizTalk Server environment, i.e., downtime for a few minutes of our entire integration platform.
- If we look at the description of the task, these tools execute: “PURGE Marklog table”, it says that this operation calls a SQL script that cleans up everything in Marklog table – and maybe this is not the best practices in terms of maintaining your environment.
This information is important and useful for the BizTalk Administration team, for example, to keep an eye on the backup/log shipping history records to see whether the backup is working correctly and data/logs are restored correctly in the standby environment.
As a best practice: you should respect the parameter “@DaysToKeep” present in the 4th step (Clear Backup History) of the ‘Backup BizTalk Server’ job, i.e., clean everything on that table older than the days specified in the “@DaysToKeep” parameter.
How to properly maintain BizTalk MarkLog tables?
To address and solve this problem, I end up creating a custom stored procedure in the BizTalk Management database (BizTalkMgmtDb) that I called “sp_DeleteBackupHistoryAndMarkLogsHistory”. This stored procedure is basically a copy of the existing “sp_DeleteBackupHistory” stored procedure with extended functionalities:
- It iterates all the databases that are backed up by BizTalk and delete all data older than the days define in @DaysToKeep parameter
Script sample:
/* Create a cursor */
    DECLARE BackupDB_Cursor insensitive cursor for
        SELECT    ServerName, DatabaseName
        FROM    admv_BackupDatabases
        ORDER BY ServerName
    open BackupDB_Cursor
    fetch next from BackupDB_Cursor into @BackupServer, @BackupDB
    WHILE (@@FETCH_STATUS = 0)
        BEGIN
            -- Get the proper server name
            EXEC @ret = sp_GetRemoteServerName @ServerName = @BackupServer, @DatabaseName = @BackupDB, @RemoteServerName = @RealServerName OUTPUT
            IF @@ERROR <> 0 OR @ret IS NULL OR @ret <> 0 OR @RealServerName IS NULL OR len(@RealServerName) <= 0
            BEGIN
                SET @errorDesc = replace( @localized_string_sp_DeleteBackupHistoryAndMarkLogsHistory_Failed_sp_GetRemoteServerNameFailed, N'%s', @BackupServer )
                RAISERROR( @errorDesc, 16, -1 )
                GOTO FAILED
            END

            /* Create the delete statement */
            select @tsql =
            'DELETE FROM [' + @RealServerName + '].[' + @BackupDB + '].[dbo].[MarkLog]
            WHERE DATEDIFF(day, REPLACE(SUBSTRING([MarkName],5,10),''_'',''''), GETDATE()) > ' + cast(@DaysToKeep as nvarchar(5) )

            /* Execute the delete statement */
            EXEC (@tsql)
            SELECT @error = @@ERROR
            IF @error <> 0 or @ret IS NULL or @ret <> 0
            BEGIN
                 SELECT @errorDesc = replace( @localized_string_sp_DeleteBackupHistoryAndMarkLogsHistory_Failed_Deleting_Mark, '%s', @BackupServer + N'.' + @BackupDB )
                GOTO FAILED
            END

            /* Get the next DB. */
            fetch next from BackupDB_Cursor into @BackupServer, @BackupDB
        END

    close BackupDB_Cursor
    deallocate BackupDB_Cursor
Steps required to install/configure:
- Download the SQL script from BizTalk Server: Cleaning MarkLog Tables According to Some of the Best Practices and create the sp_DeleteBackupHistoryAndMarkLogsHistory stored procedure against to BizTalk Management database (BizTalkMgmtDb)
- Change and configure the 4th step of the ‘Backup BizTalk Server’ job – “Clear Backup History” to call this new stored procedure: sp_DeleteBackupHistoryAndMarkLogsHistory
Note: Do not change or delete the “sp_DeleteBackupHistory”!
Credits: Tord Glad Nordahl, Rui Romano, Pedro Sousa, Mikael Sand and me
Stay tuned for new BizTalk Server Tips and Tricks!
Author: Sandro Pereira
Sandro Pereira is an Azure MVP and works as an Integration consultant at DevScope. In the past years, he has been working on implementing Integration scenarios both on-premises and cloud for various clients, each with different scenarios from a technical point of view, size, and criticality, using Microsoft Azure, Microsoft BizTalk Server and different technologies like AS2, EDI, RosettaNet, SAP, TIBCO etc. View all posts by Sandro Pereira
by Dan Toomey | Sep 3, 2017 | BizTalk Community Blogs via Syndication
(This post was originally published on Mexia’s blog on 1st September 2017)
Microsoft recently released the public preview of Azure Event Grid – a hyper-scalable serverless platform for routing events with intelligent filtering. No more polling for events – Event Grid is a reactive programming platform for pushing events out to interested subscribers. This is an extremely significant innovation, for as veteran MVP Steef-Jan Wiggers points out in his blog post, it completes the existing serverless messaging capability in Azure:
- Azure Functions – Serverless compute
- Logic Apps – Serverless connectivity and workflows
- Service Bus – Serverless messaging
- Event Grid – Serverless Events
And as Tord Glad Nordahl says in his post From chaos to control in Azure, “With dynamic scale and consistent performance Azure Event grid lets you focus on your app logic rather than the infrastructure around it.”
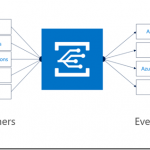
The preview version not only comes with several supported publishers and subscribers out of the box, but also supports customer publishers and (via WebHooks) custom subscribers:

In this blog post, I’ll describe the experience in building a sample logging mechanism for a service hosted in Azure Service Fabric. The solution not only logs all events to table storage, but also sends alert emails for any error events:

Creating the Event Grid Topic
This was an extremely simple process executed in the Azure Portal. Create a new item by searching for “Event Grid Topic”, and then supply the requested basic information:

Once created, the key items you will need once the topic is created is the Topic Endpoint and the associated key:

Creating the Event Publisher
As mentioned previously, there are a number of existing Azure services that can publish events to Event Grid including Event Hubs, resource groups, subscriptions, etc. – and there will be more coming as the service moves toward general availability. However, in this case we create a custom publisher which is a service hosted in Azure Service Fabric. For this sample, I used an existing Voting App demo which I’ve written about in a previous blog post, modifying it slightly by adding code to publish logging events to Event Grid.
The first requirement was storing the topic endpoint and key in the parameter files, and of course creating the associated configuration items in the ServiceManifest.xml and ApplicationManifest.xml files (this article provides information about application configuration in Service Fabric):

Note that in a production situation the TopicKey should be encrypted within this file – but for the purposes of this example we will keep it simple.
Next step was creating a small class library in the solution to house the following items:
- The Event class which represents the Event Grid events schema
- A LogEvent class which represents the “Data” element in the Event schema
- A utility class which includes the static SendLogEvent method
- A LogEventType enum to define logging severity levels (ERROR|WARNING|INFO|VERBOSE)
To see an example of how to create the Event class, refer to fellow Azure MVP Eldert Grootenboer’s excellent post. The only changes I made were to assign the properties for my custom LogEvent, and to add a static method for sending a collection of Event objects to Event Grid (notice how the Event.Subject field is a concatenation of the Application Name and the LogEventType – this will be important later on):

The utility method that creates the collection and invokes this static method is pretty straight forward:

This all makes it simple to embed logging calls into the application code:

Creating the Event Subscribers
Capturing All Events
The first topic subscription will be an Azure Function that will write all events to Azure table storage. Provided you’ve created your Function App in a region that supports the Event Grid preview (I’ve just created everything aside from the Service Fabric solution within the same resource group and location), you will see that there is already an Event Grid Trigger available to choose. Here is my configured trigger:

As you can see, I’ve also configured a Table Storage output. The code within this function creates a record in the table using the Event.Subject as a partition and the Event.Id as the row key:

Using the free Azure Storage Explorer tool, we can see the output of our testing:

Alerting on ERROR Events
Now that we’ve completed one of the two subscriptions for our solution, we can create the other subscription which will use a filter on ERROR events and raise an alert via sending an email notification.
The first step is to create the Logic App (in the same region as the Event Grid) and add the Event Grid Trigger. There are a few things to watch out for here:
- When you are prompted to sign in, the account that your subscription belongs to may or may not work. If it doesn’t, try creating a Service Principal with contributor rights for the Event Grid topic (here is an excellent article on how to create a service principal)
- The Resource Type should be Microsoft.EventGrid.topics
- The Suffix field contains “ERROR” which will serve as the filter for our events
- If the Resource Name drop-down list does not display your Event Grid topic at first, type something in, save it and then click the “x”; the list should hopefully appear. It is important to select from the list as just typing the display name will not create the necessary resource ID in the topic field and the subscription will not be created.
You can then follow this with an Office365 Email action (or any other type of notification action you prefer). There are four dynamic properties that are available from the Event Grid Trigger action (Subject, ID, Event Type and Event Time):

After saving the Logic App, check for any errors in the Overview blade, and then check the Overview blade for the Event Grid Topic – you should see the new subscription created there:

Finally, we can test the application. My Voting demo service generates an exception (and a ERROR logging event) when a vote is cast for a null/empty candidate (see the ERROR entry in the table screenshot above). This event now triggers an email notification:

Summary
So this example may not be the niftiest logging application on the market (especially considering all of the excellent logging tools that are available today), but it does demonstrate how easy it is to get up and running with Event Grid. You’ve seen an example of using a custom publisher and two built-in subscribers, including one with intelligent filtering. To see how to write a custom subscriber, have a look at Eldert’s post “Custom Subscribers in Event Grid” where he uses an API App subscriber to write shipping orders to table storage.
Event Grid is enormously scalable and its consumption pricing model is extremely competitive. I doubt there is anything else quite like this on offer today. Moreover, there will be additional connectors coming in the near future, including Azure AD, Service Bus, Azure Data Factory, API Management, Cosmos DB, and more.
For a broader overview of Event Grid’s features and the capabilities it brings to Azure, have a read of Tom Kerkhove’s post “Exploring Event Grid”. And to understand the differences between Event Hub, Service Bus and Event Grid, Saravana Kumar’s recent post sums it up quite nicely. Finally, if you want to get your hands dirty and have a play, Microsoft has provided a quickstart page to get you up and running.
Happy Eventing!
by Steef-Jan Wiggers | Sep 2, 2017 | BizTalk Community Blogs via Syndication
A few weeks ago Azure Event Grid service became available in preview. This service enables centralized management of events in a uniform way. It’s scales with you when the number of events increases. And this is made possible by the foundation the event grid relies on service fabric. Not only does is auto scale you also do not have to provision anything beside a Event Topic to support custom events (see my blog Routing an Event with a custom Event Topic). Event Grid is Serverless, you only pay for each action (Ingress events, Advanced matches, Delivery attempts, Management calls). Moreover, the price will be 30 cents per million action in preview, and will be 60 cents once the service will be GA.
Azure Event Grid can be described as an event broker that has one of more event publishers and subscribers. Event publishers are currently Azure blob storage, resource groups, subscriptions, event hubs and custom events. More will be added in the coming months like IoT Hub, Service Bus, and Azure Active Directory. Subsequently, there are consumers of events (subscribers) like Azure Functions, Logic Apps, and WebHooks. And more will be added on the subscriber side too with Azure Data Factory, Service Bus and Storage Queues for instance.
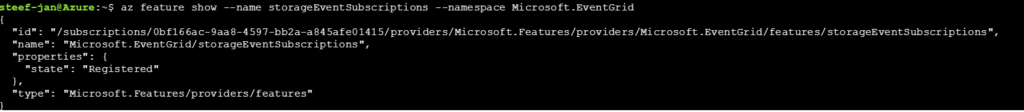
Azure Event Grid Storage registeration
Currently to capture Azure Blob Storage events you will need to register your subscription through a preview program. Once you have registered your subscription, which could take a day or two you can leverage Event Grid in Azure Blob Storage only in Central West US!
The Microsoft documentation on Event Grid has a section “Reacting to Blob storage events”, which contains a walkthrough to try out the Azure Blob Storage as an event publisher.
Azure Event Grid Storage Account Events Scenario
Having registered my subscription to the preview program I started exploring its capability as in the landing page of Event Grid sample scenario’s were explained. And I wanted to try out the serverless architecture sample, where one can use Event Grid to instantly trigger a serverless function to run image analysis each time a new photo is added to a blob storage container. Hence, I build a demo according to the diagram below.
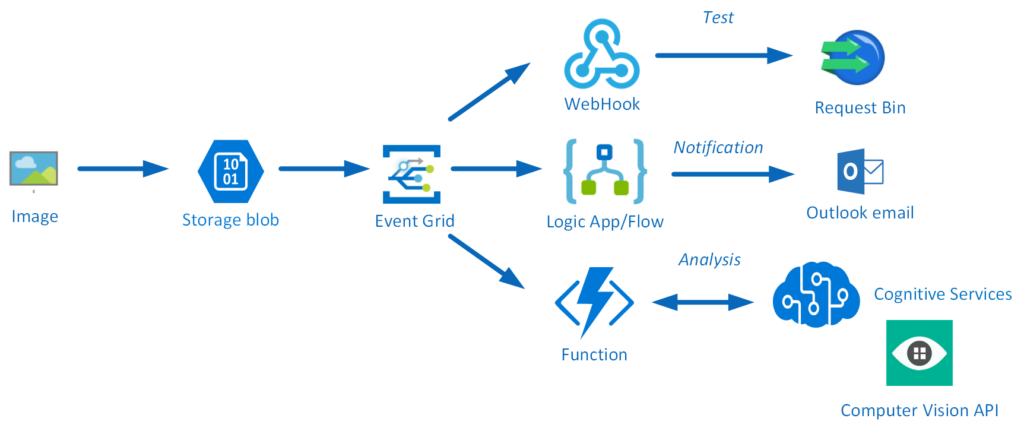
An image will be uploaded to a Storage blob container, which will be the event source (publisher). Subsequently, the Storage blob container belongs to a Storage Account containing the Event Grid capability. And the Event Grid has three subscribers, a WebHook (Request Bin) to capture the output of the event, a Logic App to notify me a blob has been created and an Azure Function that will analyze the image created in the blob storage, by extracting the URL from the event and use it to analyze the actual image.
Intelligent routing
The screenshot below depicts the subscriptions on the events on the Blob Storage account. The WebHook will subscribe to each event, while the Logic App and Azure Function are only interested in the BlobCreated event, in a particular container(prefix filter) and type (suffix filter).

Besides being centrally managed Event Grid offers intelligent routing, which is the core feature of Event Grid. And you can use filters for event type, or subject pattern (pre- and suffix). Moreover, the filters are intended for the subscribers to indicate what type of event and/or subject they are interested in. When we look at our scenario the event subscription for Azure Functions is as follows.
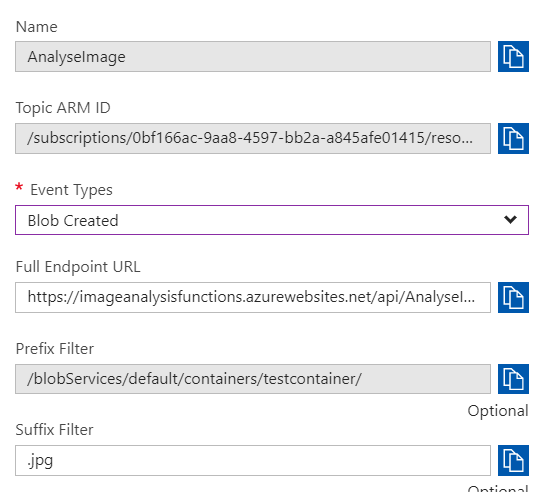
- Event Type : Blob Created
- Prefix : /blobServices/default/containers/testcontainer/
- Suffix : .jpg
The prefix, a filter object, looks for the beginsWith in the subject field in the event. And the suffix looks for the subjectEndsWith in again the subject. In the event above you see that the subject has the specified Prefix and Suffix. See also Event Grid subscription schema in the documentation as it will explain the properties of the subscription schema. The subscription schema of the function is as follows:
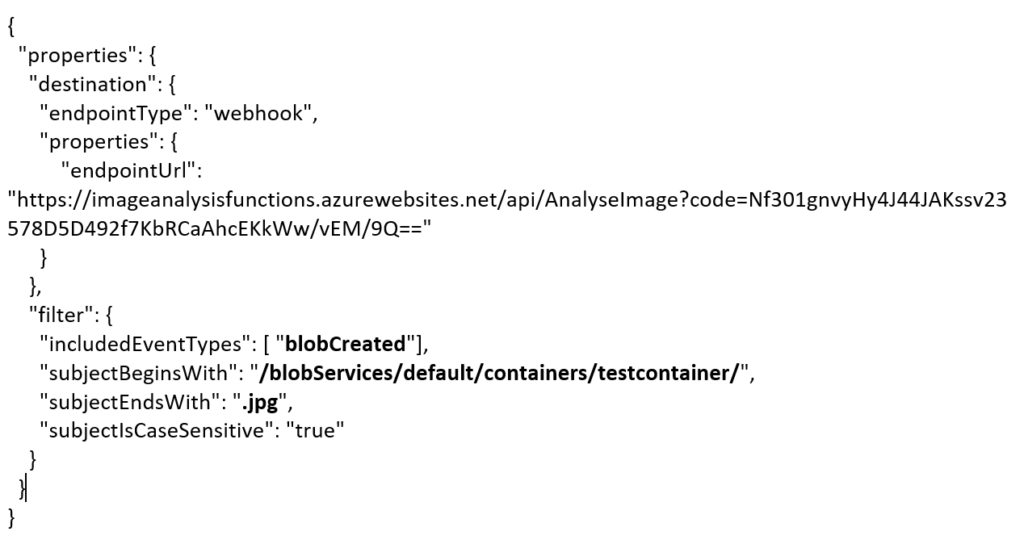
The Azure Function is only interested in a Blob Created event with a particular subject and content type (image .jpg). And this will be apparent once you inspect the incoming event to the function.
The same intelligence applies for the Logic App that is interested in the same event. The WebHook subscribes to all the events and lacks any filters.
The scenario solution
The solution contains of a storage account (blob), registered subscription for Event Grid Azure Storage, Request Bin (WebHook), a Logic App and a Function App containing a function. The Logic App and Azure Function subscribe to BlobCreated event with the filter settings.
The Logic App subscribes to the event once the trigger action is defined. The definition is shown in the picture below.
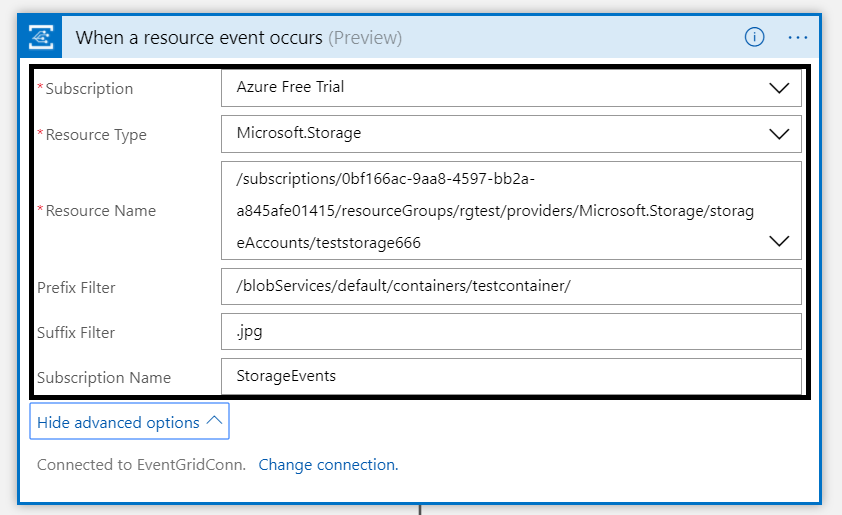
Note that the resource name has to be specified explicitly (custom value) as the resource type Microsoft.Storage has be set explicitly too. The resource types that are listed are Resource Groups, Subscriptions, Event Grid Topics and Event Hub Namespace as Storage is still in a preview program. With this configuration the desired events can be evaluated and processed. In case of the Logic App it is parsing the event and sending an email notification.
Azure Function Storage Event processing
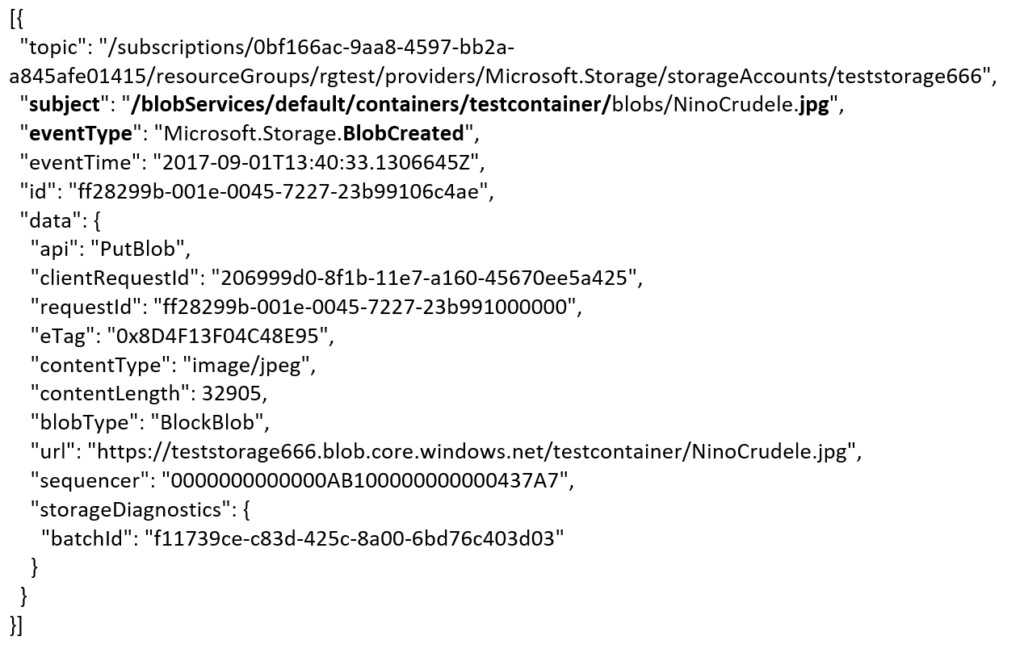
The Azure Function is interested in the same event. And as soon as the event is pushed to Event Grid once a blob has been created it will process the event. The url in the event https://teststorage666.blob.core.windows.net/testcontainer/NinoCrudele.jpg will be used to analyze the image. The image is a picture of my good friend Nino Crudele.

This image will be streamed from the function to the Cognitive Services Computer Vision API. The result of the analysis can be viewed in the monitor tab of the Azure Function.
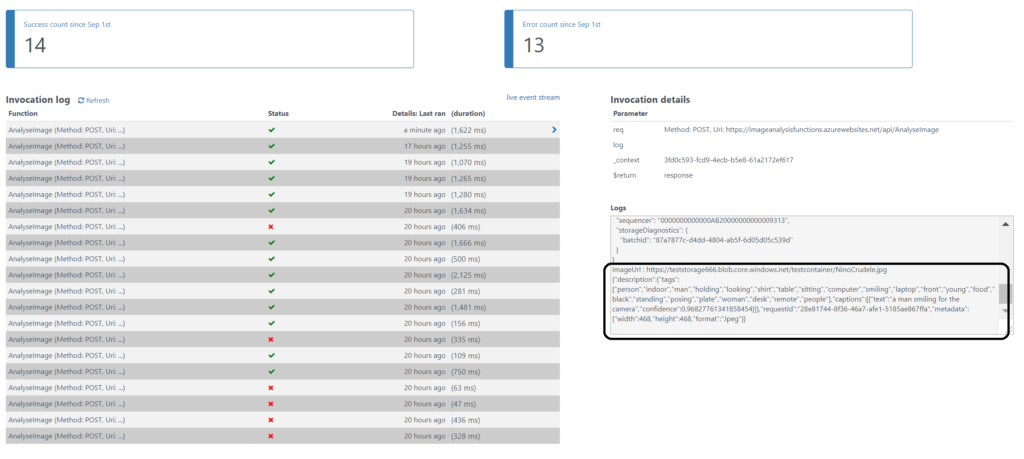
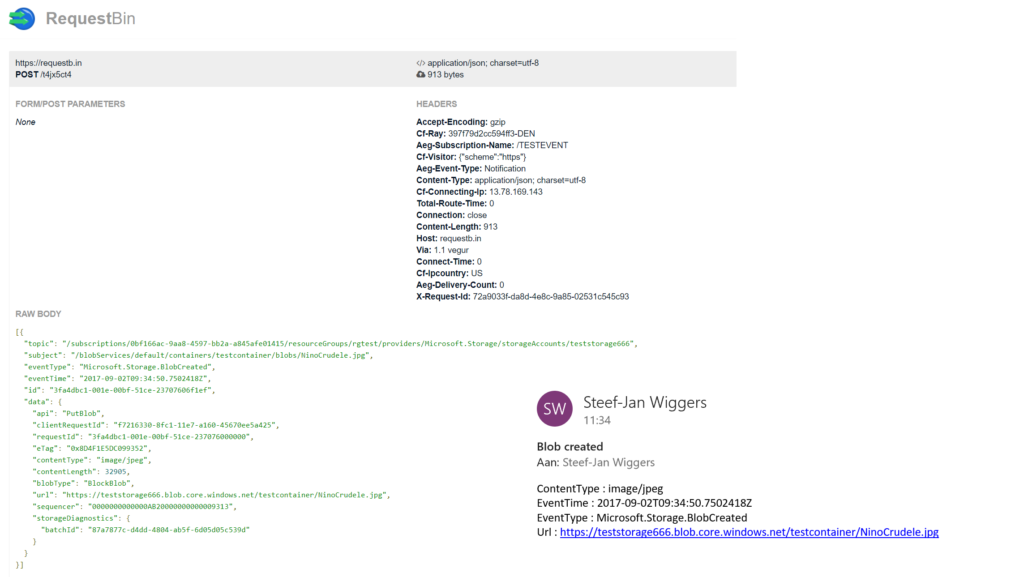
The result of the analysis that Nino is smiling for the camera with confidence. The Logic App will parse the event and sent an email. The Request Bin will show the raw event. And in case I deleted the blob than this will only be captured by the WebHook (Request Bin) as it is interested in any event on the Storage account.
Summary
Azure Event Grid is unique in its kind as now other Cloud vendor has this type of service that can handle events in a uniform and serverless way. Although it is still early days as this service is in preview a few week. However, with expansion of event publishers and subscribers, management capabilities and other features it will mature in the next couple of months. The service is currently only available in the West Central US and West US, yet over course of time it will become available in every region. And once it will become GA the price will increase.
Working with Storage Account as source (publisher) of events unlocked new insights in the Event Grid mechanisms. Moreover, it shows the benefits of having a managed service by Azure for events. And the pub-sub and push of events are the key differentiators towards the other two services Service Bus and Event Hubs. No longer do you have to poll for events and/or develop a solution for it. To conclude the Service Bus Team has completed the picture for messaging and event handling.
Author: Steef-Jan Wiggers
Steef-Jan Wiggers is all in on Microsoft Azure, Integration, and Data Science. He has over 15 years’ experience in a wide variety of scenarios such as custom .NET solution development, overseeing large enterprise integrations, building web services, managing projects, designing web services, experimenting with data, SQL Server database administration, and consulting. Steef-Jan loves challenges in the Microsoft playing field combining it with his domain knowledge in energy, utility, banking, insurance, health care, agriculture, (local) government, bio-sciences, retail, travel and logistics. He is very active in the community as a blogger, TechNet Wiki author, book author, and global public speaker. For these efforts, Microsoft has recognized him a Microsoft MVP for the past 7 years. View all posts by Steef-Jan Wiggers
by Bill Chesnut | Sep 1, 2017 | BizTalk Community Blogs via Syndication
The process for creating a BizTalk 2016 Developer machine with 2016 is back to the way is was in the previous 2013R2 Azure Gallery Images, almost everything is install and all you need to do is some configuration. As an update from my
previous blog post, I will walk through the steps here:
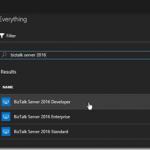
Start with the BizTalk Server 2016 Developer Azure Gallery Image

Create a new Virtual Machine from the Azure Gallery Image, Logon to your newly created machine

I then joined my machine to my Azure AD Domain Services Domain and updated some of the machine settings

SQL 2016 is installed and configured, the only thing I found was around some of the enabled protocols, so open SQL Configuration manager and enable Named Pipes and TCP/IP, this requires a restart of SQL to become effective

Visual Studio 2015 Professional is installed, you will just need to Sign In with your MSDN linked email account to activate

The remainder of building a BizTalk Server 2016 Developer machines is the same as my previous blog post, Starting from Configuring BizTalk Server 2016 Developer Edition – https://www.biztalkbill.com/2017/03/21/creating-biztalk-server-2016-developer-from-azure-gallery-image/


