From the upcoming BizTalk360 version 9.0 phase 3 on, we extend our support to monitor SQL Server clusters. By configuring the SQL Server Network Name for monitoring, BizTalk360 will start monitoring the current active node and in case of failover scenario, BizTalk360 will automatically take the active server for monitoring.
It’s important to make sure the physical infrastructure of your SQL servers like disks, CPU, memory, etc., are healthy for proper functioning. BizTalk360 made this simpler by having the SQL Server Monitoring capability.
BizTalk360 will alert to the user when the configured disk space, CPU, memory usage exceeds the set percentage.
Challenge
In existing BizTalk SQL Monitoring, we came across a few challenges on monitoring the clustered SQL Server
The user could not find the active node while monitoring the clustered SQL Server.
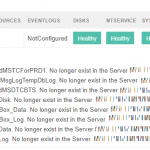
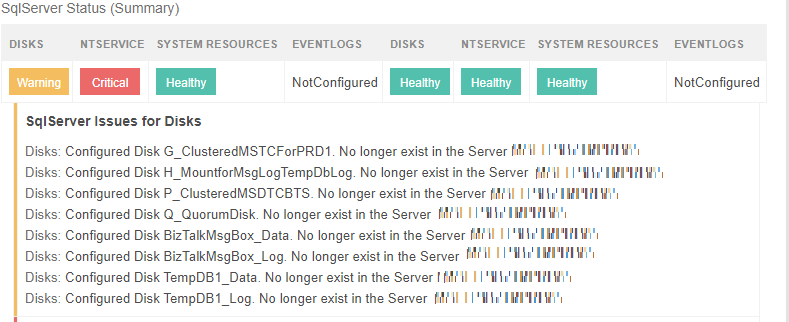
When the Failover happens, the disk monitoring could not identify the disks of the failover node and an error message was displayed as below.
Scenario 1 (Active/Active): As the same as the previous version of BizTalk360, you can monitor the Clustered SQL Server (Active/Active) or a non-clustered SQL Server, by simply adding the SQL Server physical node in the “Add SQL Server For Monitoring”.
Scenario 2 (Active/Passive): In BizTalk360, you can monitor the Clustered SQL Server (Active/Passive), by adding the common “SQL Server Network Name” for the physical node into the “Add SQL Server For Monitoring”. It will automatically pick up the active server node for monitoring and then it will start monitoring the active node. If a Failover happens, then it will automatically switch to the failover node (Active Node).
Let’s take a quick look at how you can monitor Non-Clustered/Clustered SQL Server (Active/Passive) using BizTalk360.
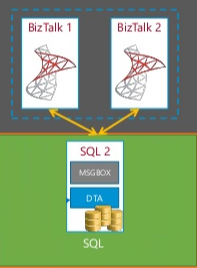
Non-Clustered SQL Server
The BizTalk server database will be pointed to one SQL server Instance as below.
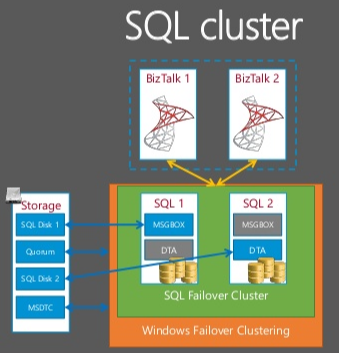
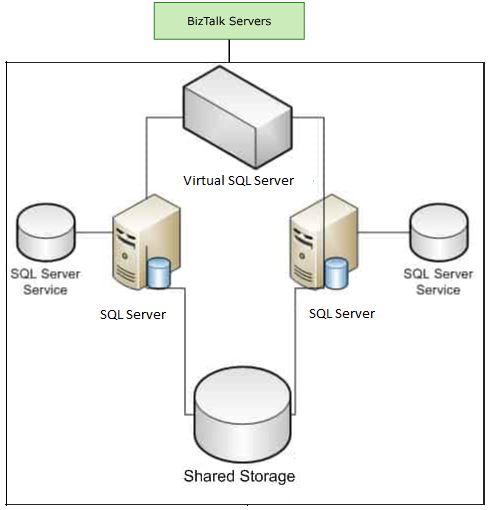
Failover Clustered SQL Server
Windows Failover Clustering is a high-availability option which is designed to increase the uptime of SQL Server instances. A SQL Server cluster includes two or more physical servers, called nodes. One is identified as the active node, on which a SQL Server instance is running the production workload, and the other is a passive node, on which SQL Server is installed but not processing the workload. If the SQL Server instance on the active node fails, the passive node becomes the active node and begins to run the SQL Server production workload with some minimal failover downtime.
The SQL Server Network Name is used to identify a failover cluster (active node) on the network. This was known as the virtualSQL Server name.
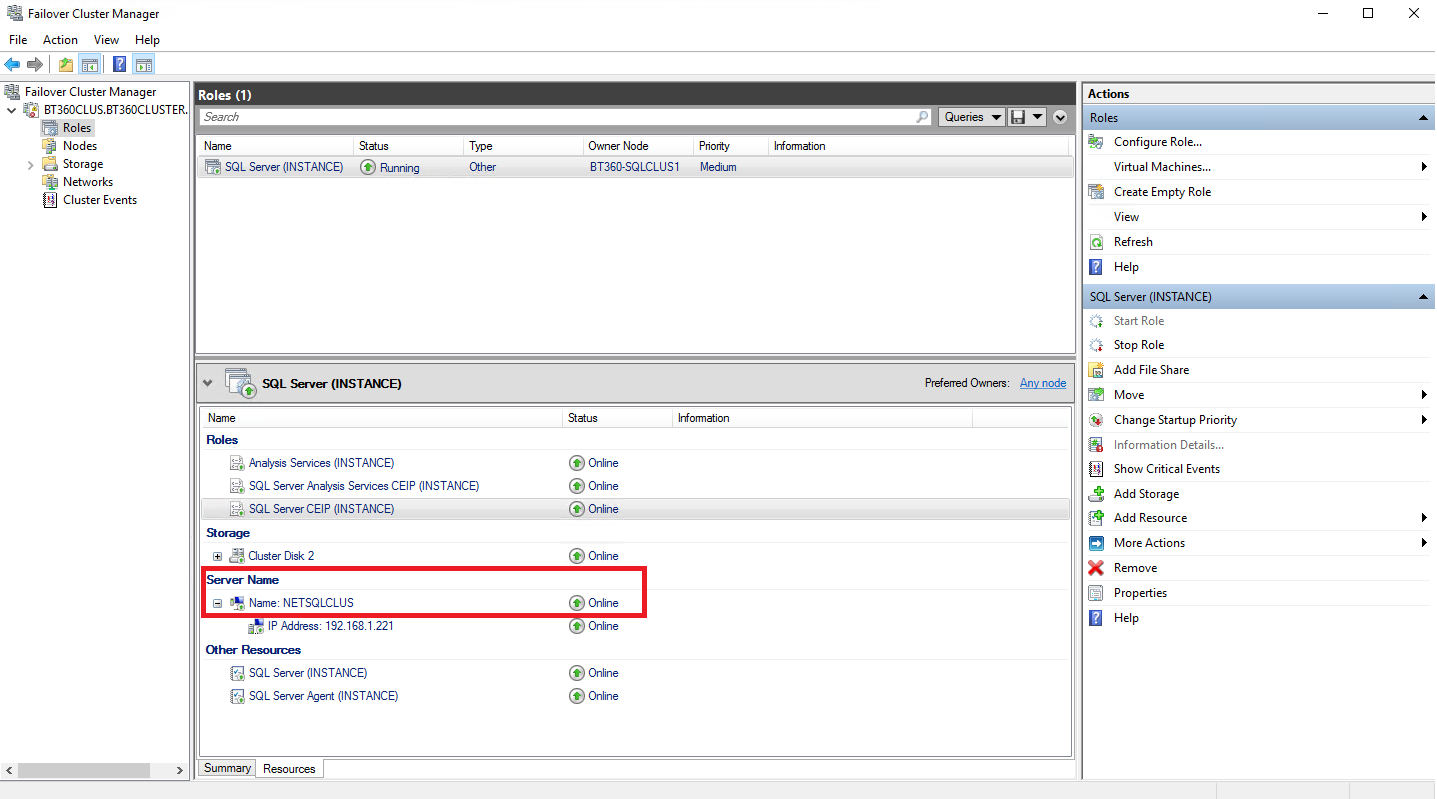
The virtual SQL Server will automatically connect to the currently active node. You can find the SQL Server Network Name as below in the Failover Manager.
Prerequisites or Permissions required to monitor the Non-Clustered/Clustered SQL Server in BizTalk360
MSDTC should be enabled in the BizTalk360 server and SQL Server. In the case of Clustered SQL Server, MSDTC should be enabled in all the SQL Servers which belong to the cluster. Follow the link to enable the MDTC.
If BizTalk360 is installed using the service account, then the service account should get added to the Administrator group in the SQL Server node. In the case of a Clustered SQL Server, the service account should get added to both physical SQL Server Nodes(active & passive node).
How the (Non-Clustered) SQL Server is monitored in BizTalk360
Let’s have a detailed look at how you can monitor a non-clustered SQL server using BizTalk360.
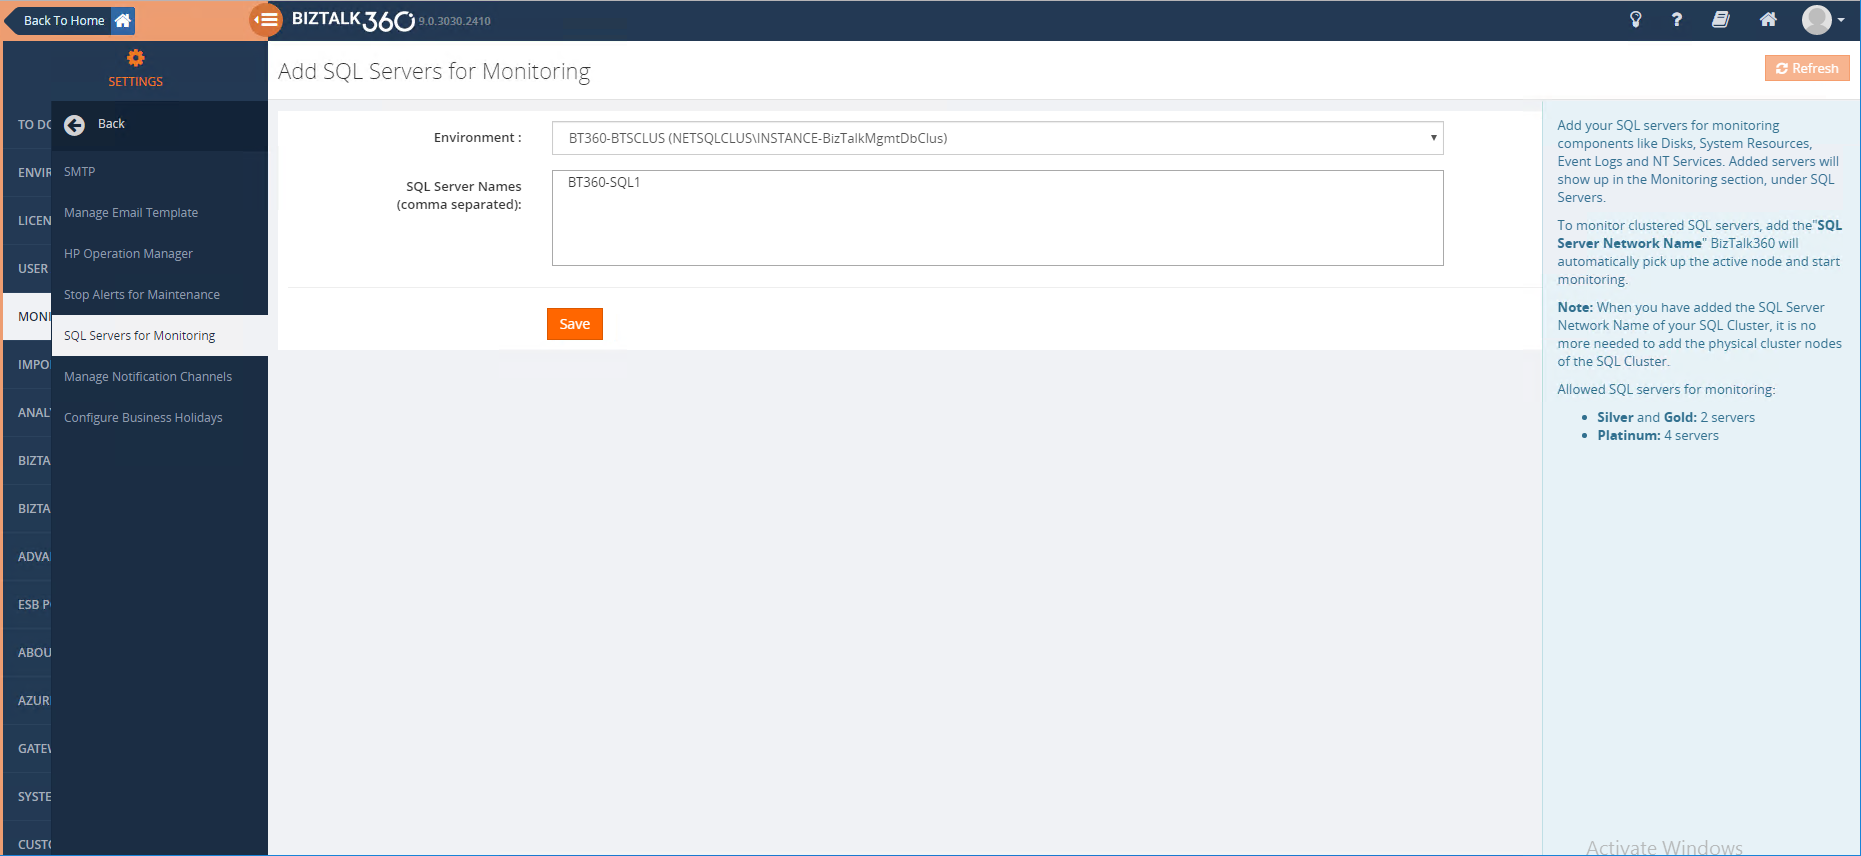
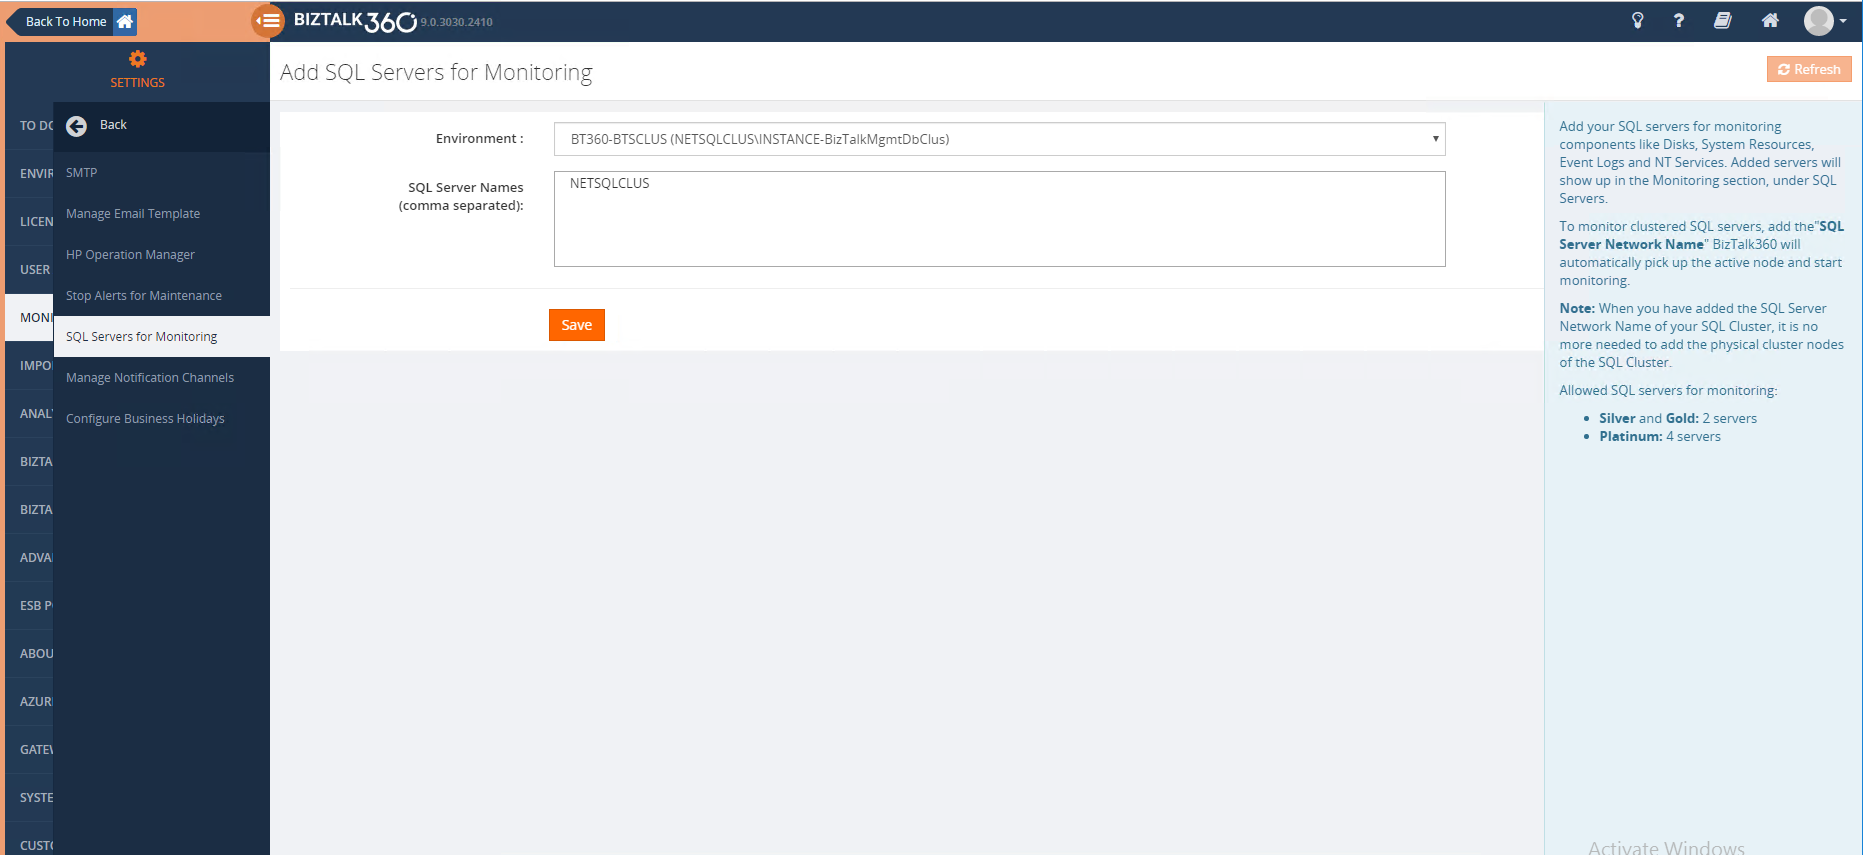
By adding the Physical SQL server name for Monitoring, you can monitor the disks, CPU, memory, etc. You can add the SQL Server name under BizTalk360->Settings ->Monitoring and Notification ->Add SQL Server for monitoring.
Note: For non-clustered SQL servers you must add the physical SQL Server name for monitoring.
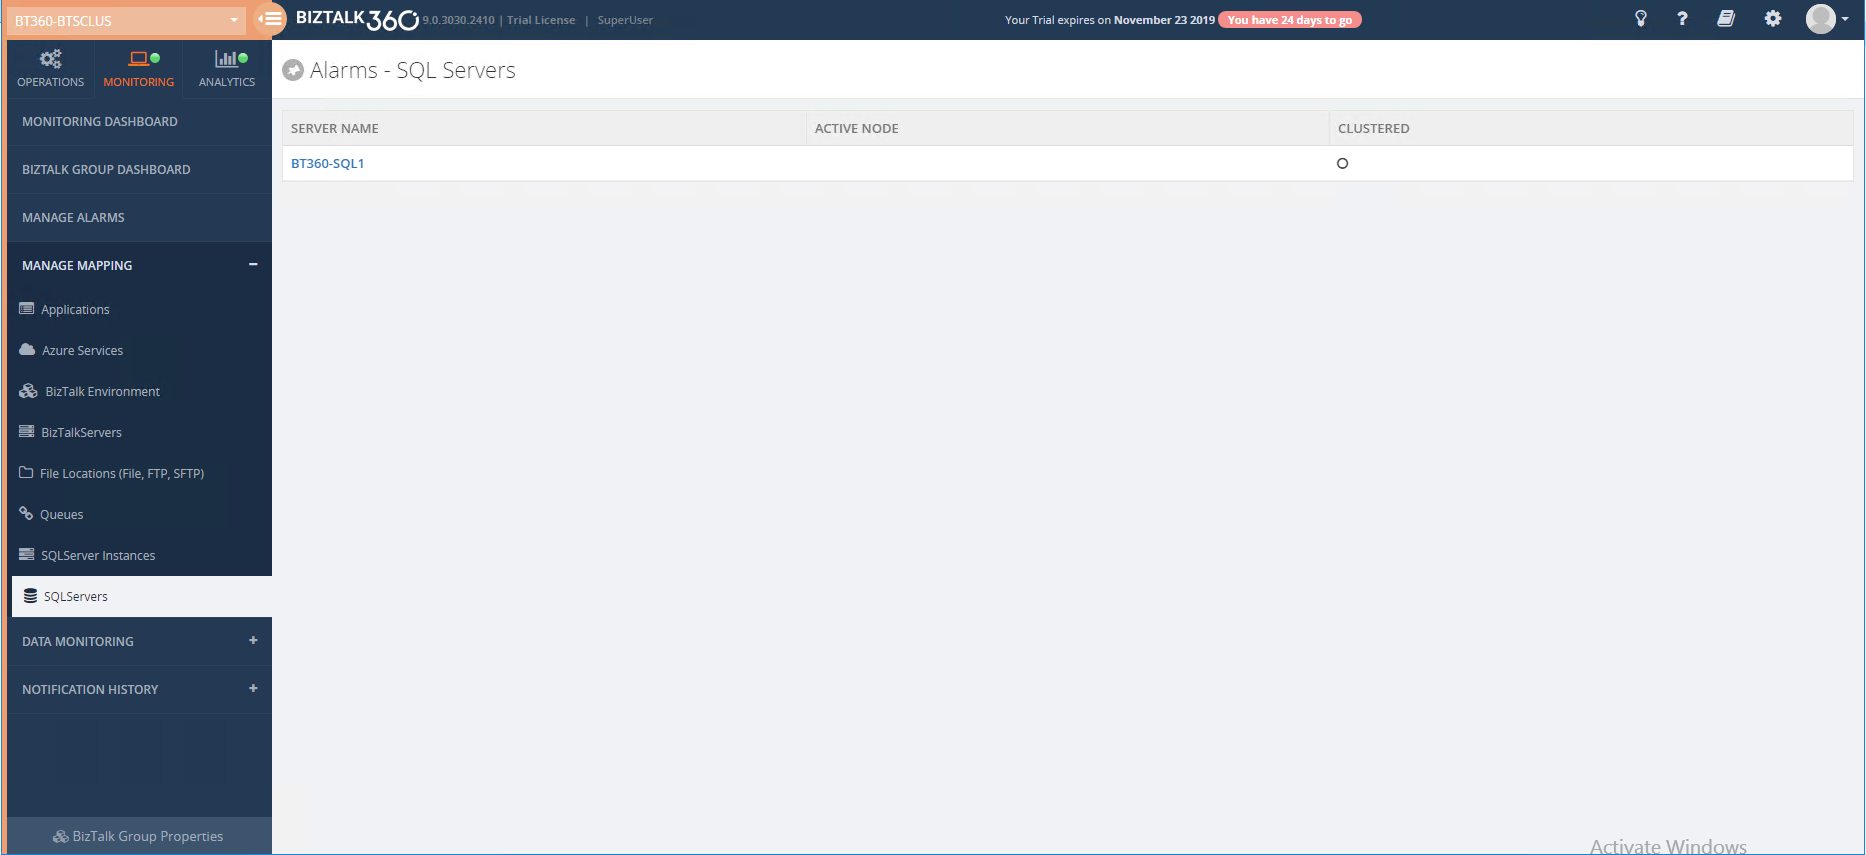
Once the above configuration is done, the added SQL servers will get available for monitoring as below.
The configured server will be listed for monitoring under BizTalk360->Monitoring ->Manage Mapping->SQL Servers. By clicking on the Server name you can configure Disks, System Resources (CPU, memory), Event Logs and NT Services of the specific SQL server for monitoring.
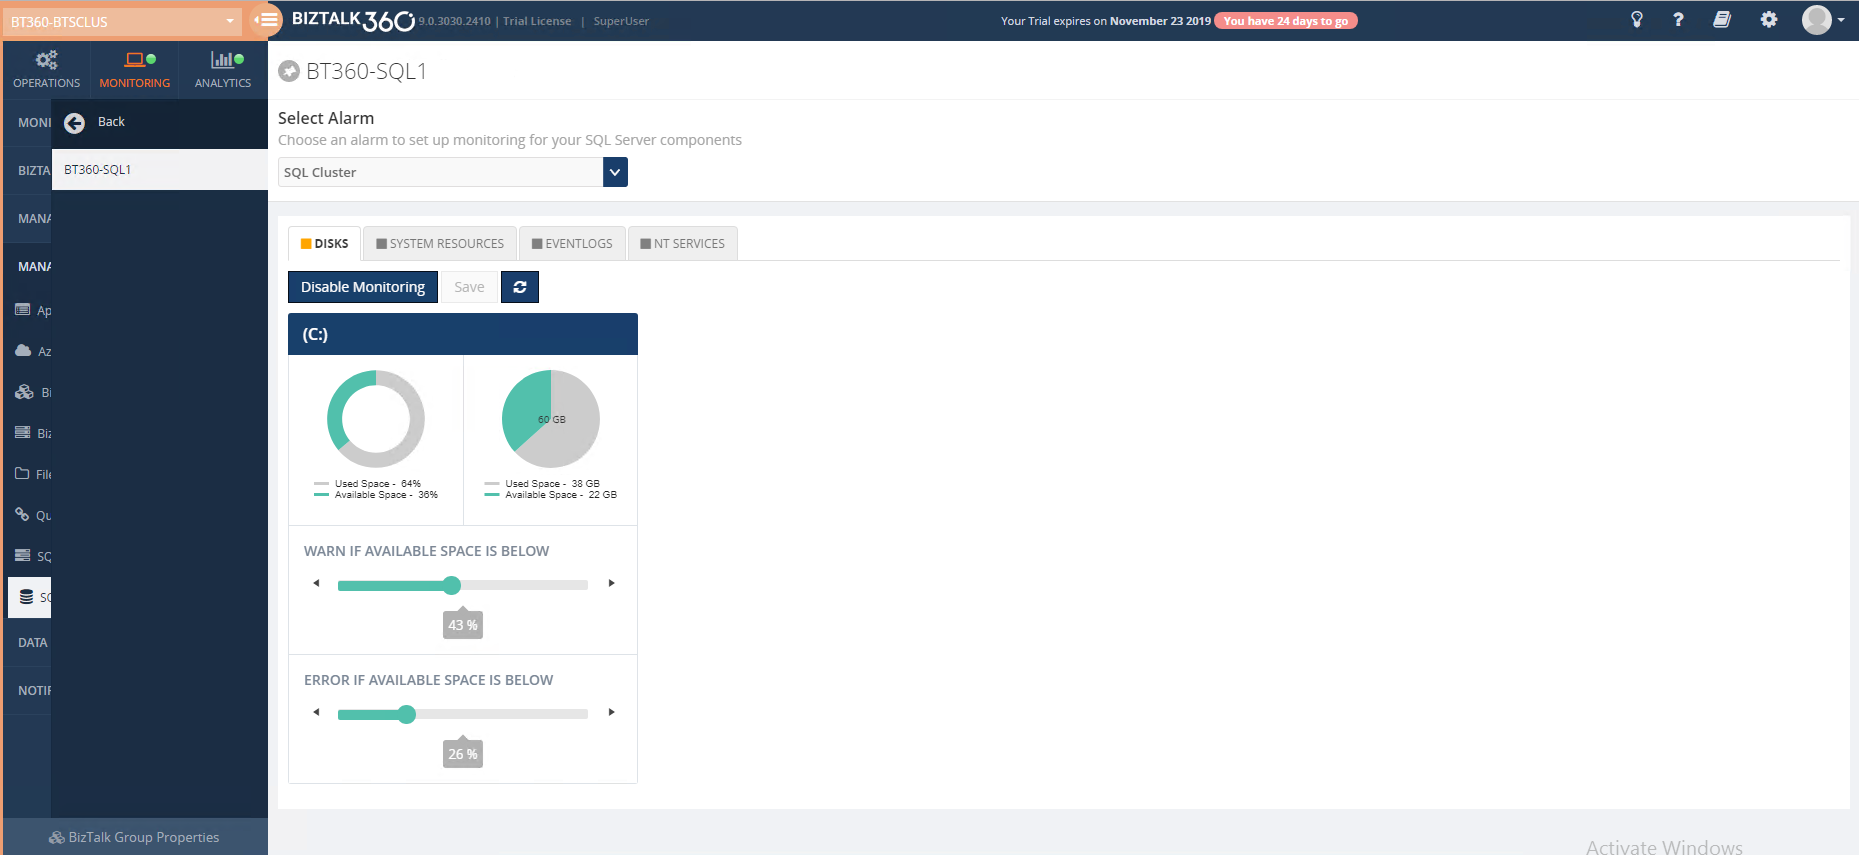
Disk Monitoring
A click on the Disks tab, will automatically pick up all the disks in the configured SQL server and show a graphical view of the disk properties with total and available disk space. To monitor the disk, you can simply set the appropriate warning and error threshold level for each disk in percentage (%), as shown below. For more detailed information, follow the article link.
Note: The system reserved and the unpartitioned disk will not be available for monitoring.
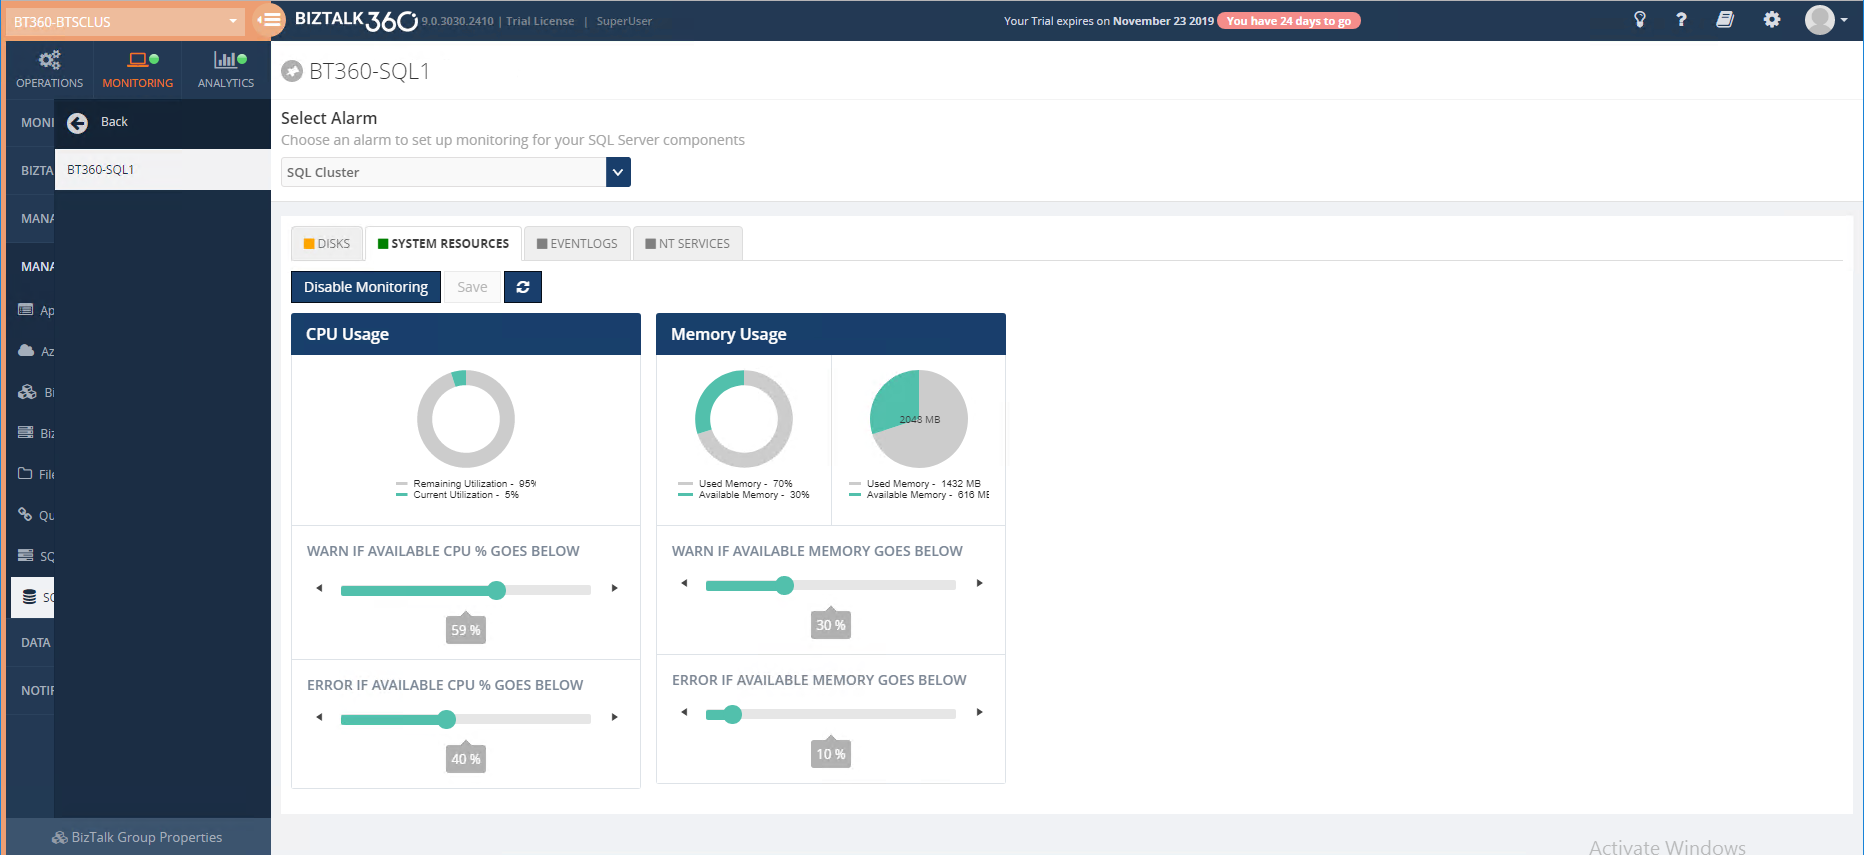
System Resource Monitoring
Click on the System resource tab to monitor the CPU usage and Memory consumption. Next, configure the appropriate warning and error thresholds for CPU and memory. The system will start alerting if the system condition hits the configured warning/error level for the persisted duration, which you can see below. For more detailed information about the CPU and Memory, follow the article link.
By default, warning and error thresholds for CPU and memory will be in 30% and 10%, but you are free to reconfigure these thresholds depending on your own requirements
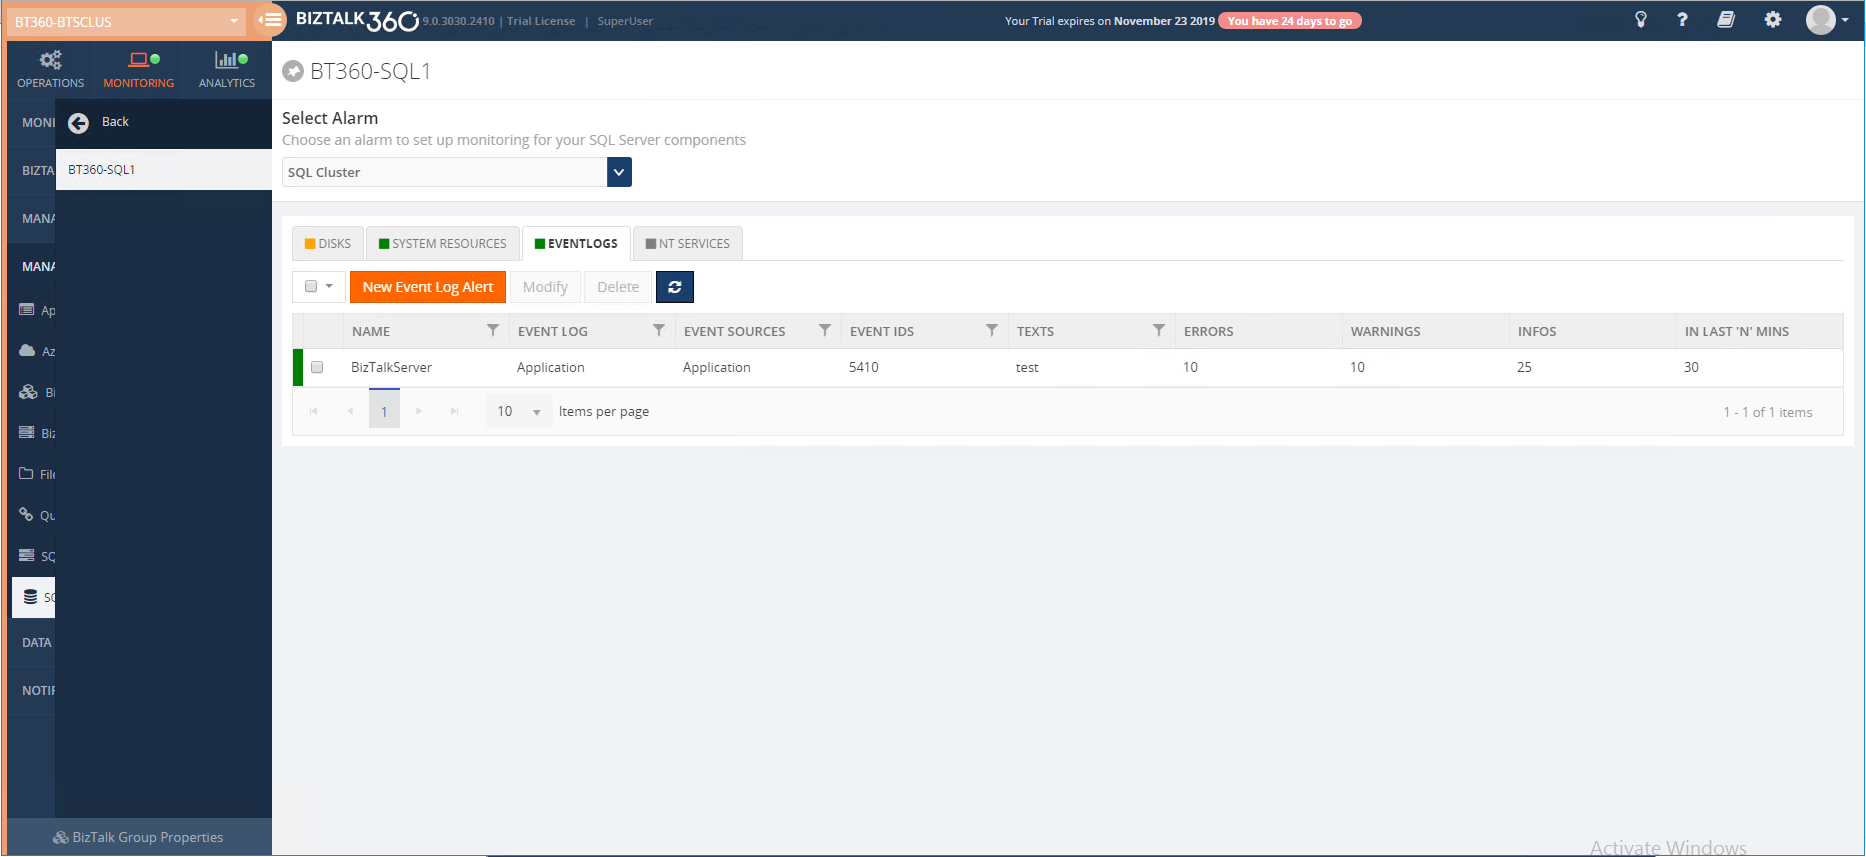
Event Log Monitoring
You can monitor for various event log entry conditions using BizTalk360. You can have multiple combinations of event log monitoring, for example, certain sources, certain event ids, certain text in the message, with configured threshold conditions as below.
Note that you can also set up Event Log monitoring in the Data Monitoring section. Setting it up there helps in correlating event log entries across multiple servers. For more detailed information about the Event Log monitoring, follow the article link.
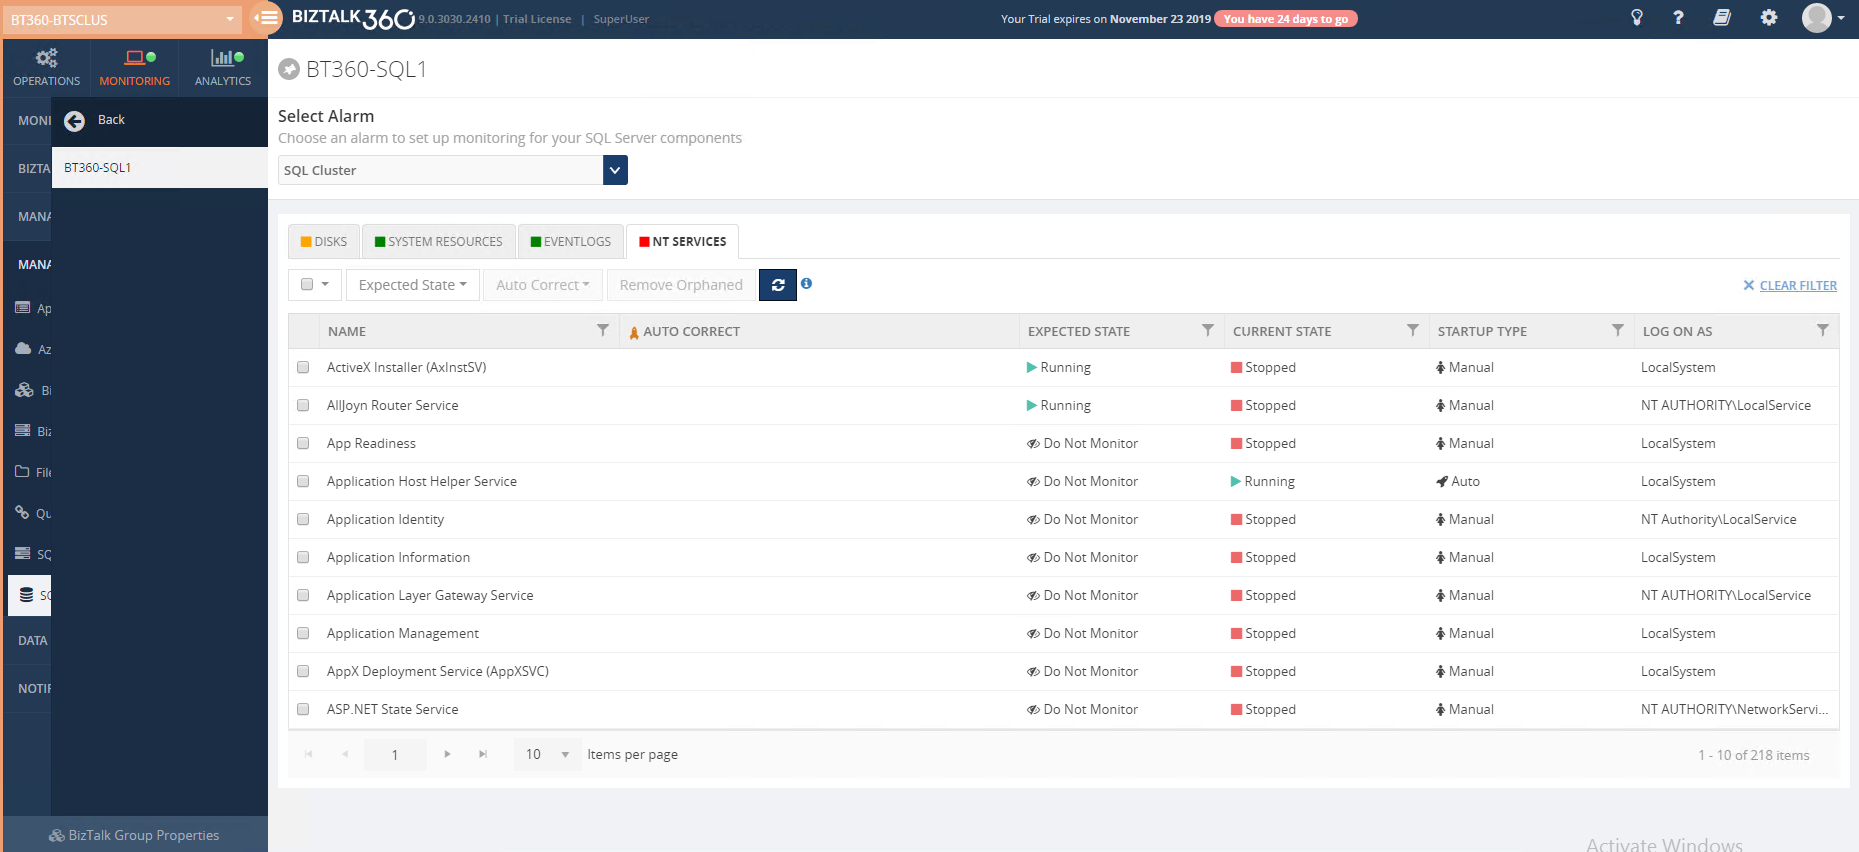
NT Service Monitoring
You may want to keep an eye on certain NT services that are running in SQL Server. BizTalk360 gives you the opportunity to automatically monitor the NT services by just setting the expected state. BizTalk360 will alert you when the configured expected state is not equal to the current state. For more detailed information about the NT Services monitoring, follow the article link.
How a SQL Clustered node is monitored in BizTalk360
Now, let us have a quick look at how we can use BizTalk360 to monitor a clustered SQL server.
Configuring a Cluster SQL Server for monitoring
If you want to monitor a Clustered SQL Server, all you need to do is, specify the name of the Virtual SQL Server (SQL Server Network Name). When you connect to SQL Server using this SQL Server Network Name, BizTalk360 will automatically connect to the currently active node.
Note: It is is enough to add just the SQL Server Network Name for monitoring the SQL Cluster, it is not required to add the actual physical SQL cluster nodes.
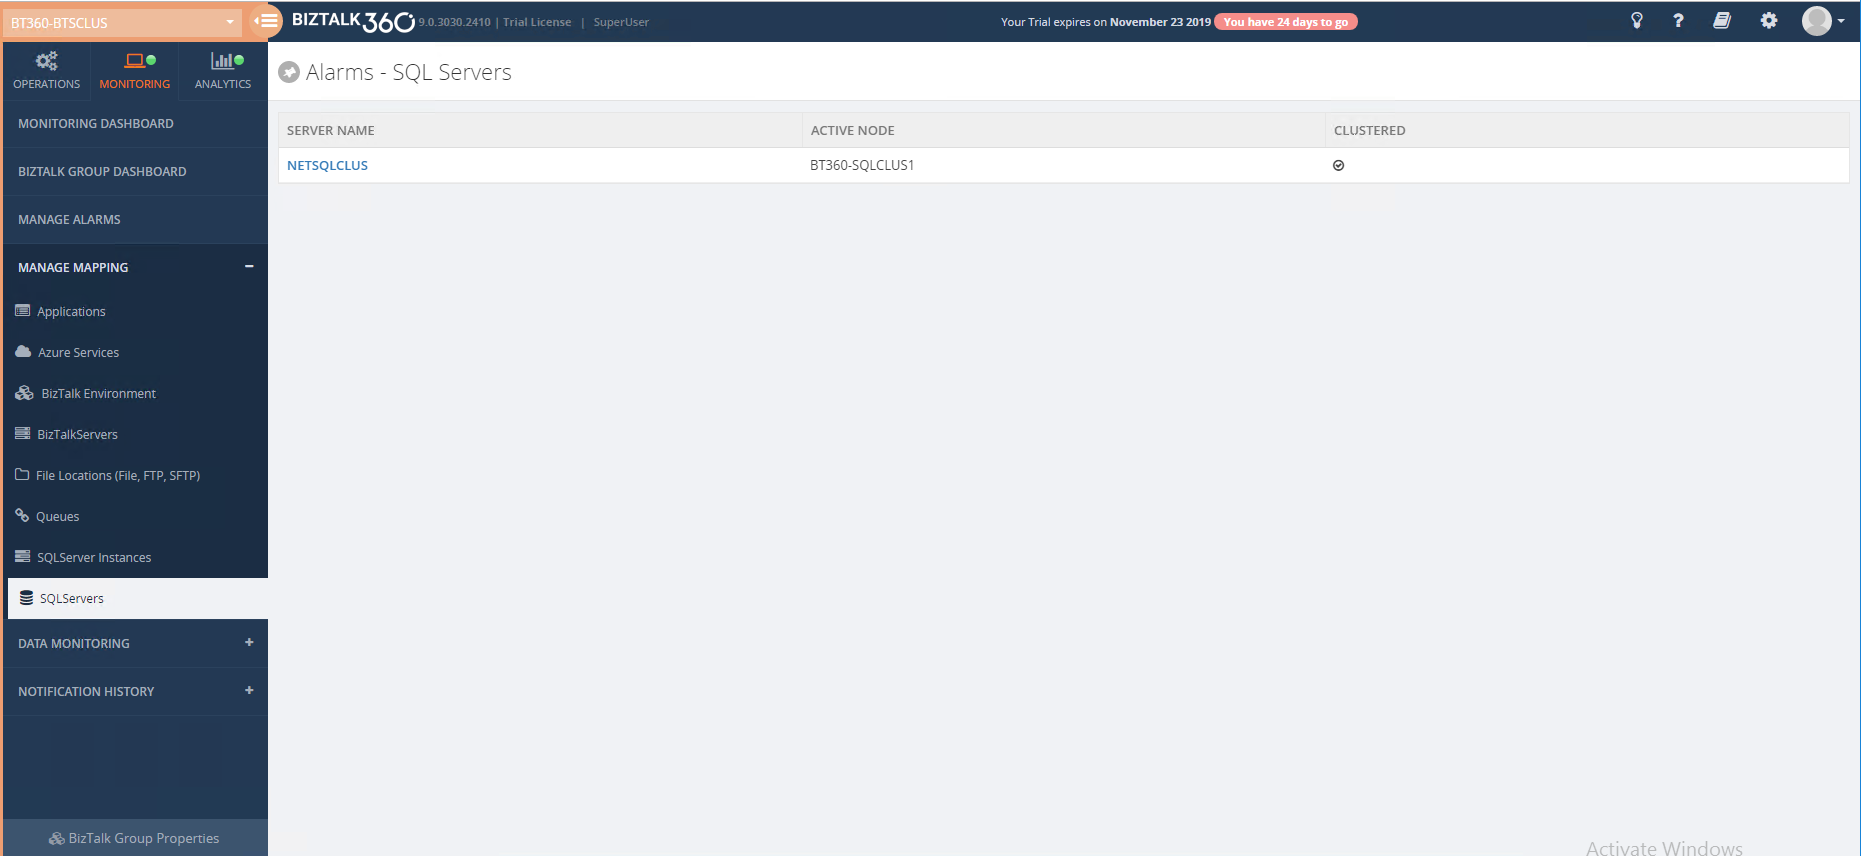
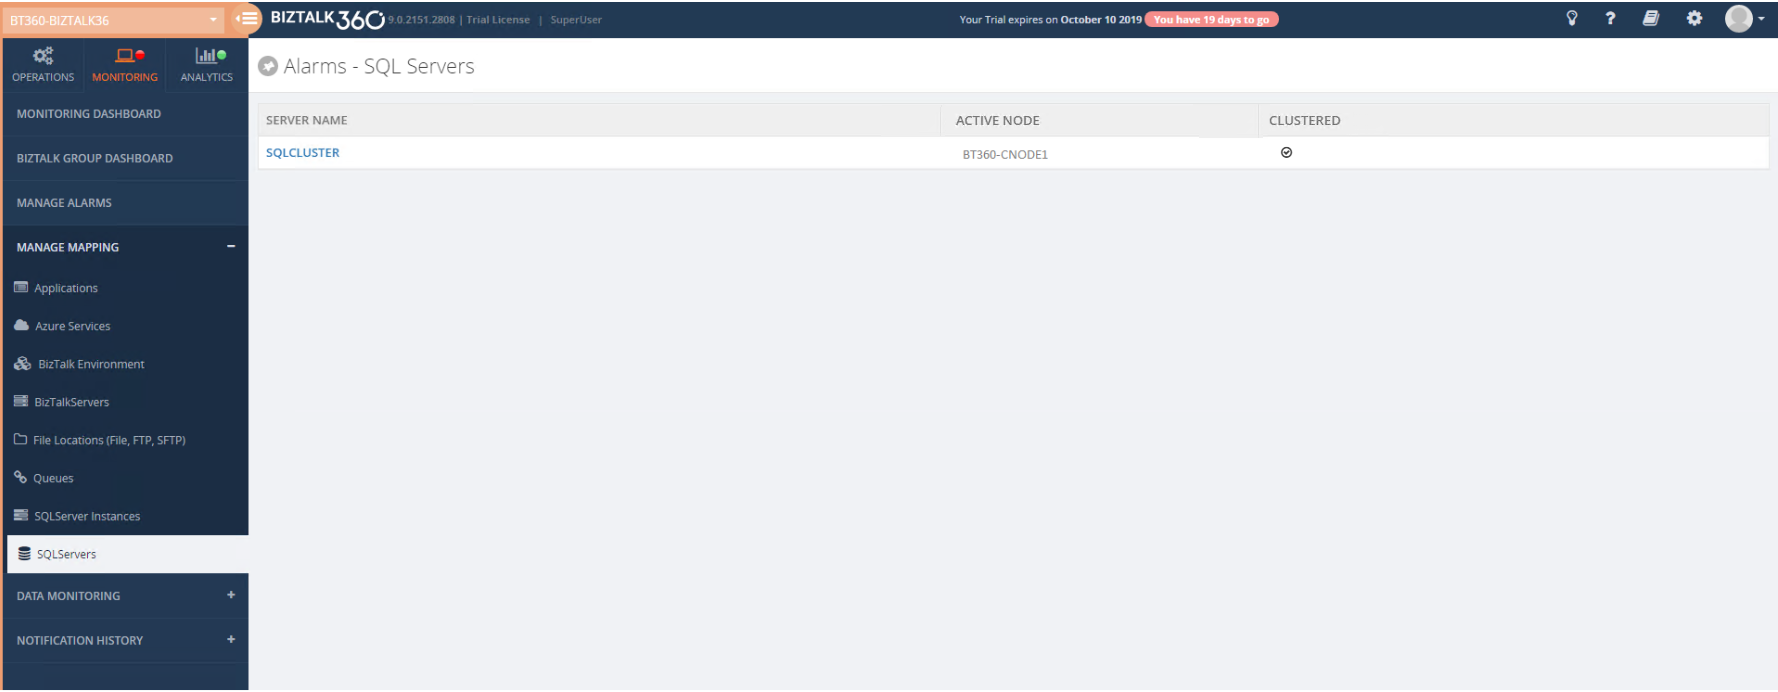
Once the above configuration is done, then the added clustered SQL Server Name will get listed for monitoring as shown below.
It will automatically pick the active node and the state of the (clustered) server.
Disk Monitoring
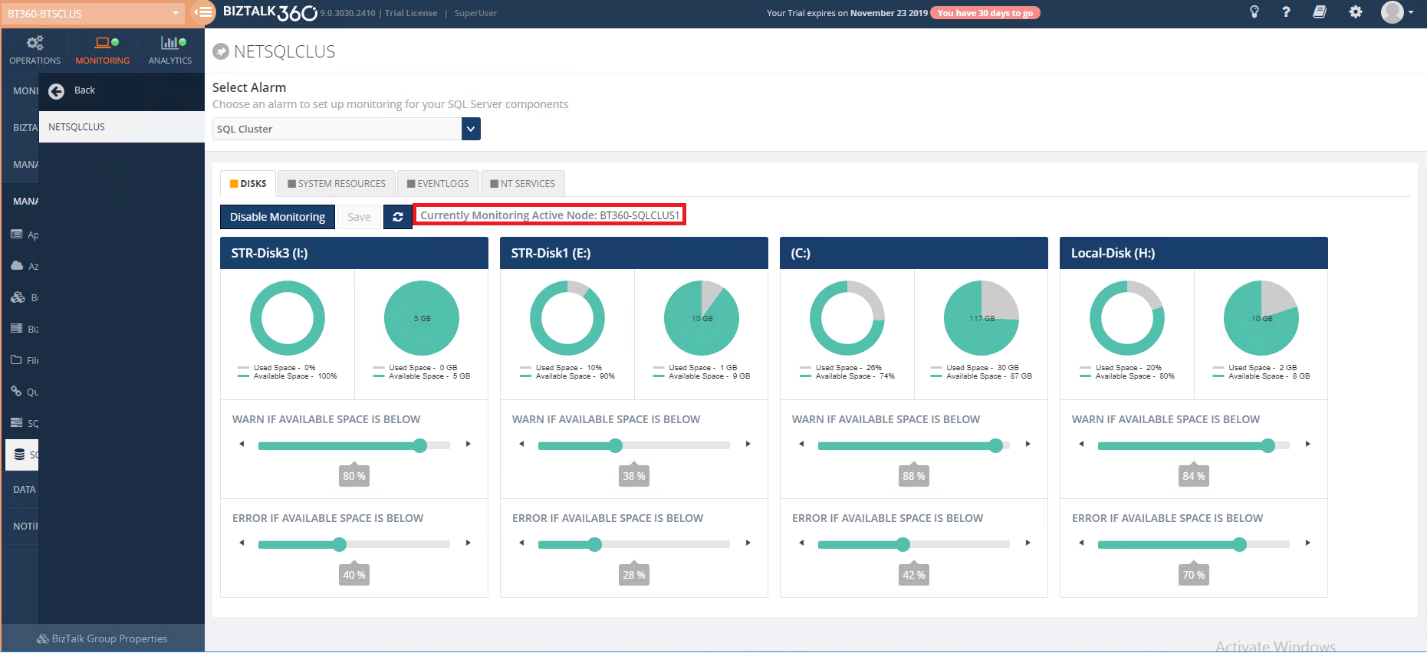
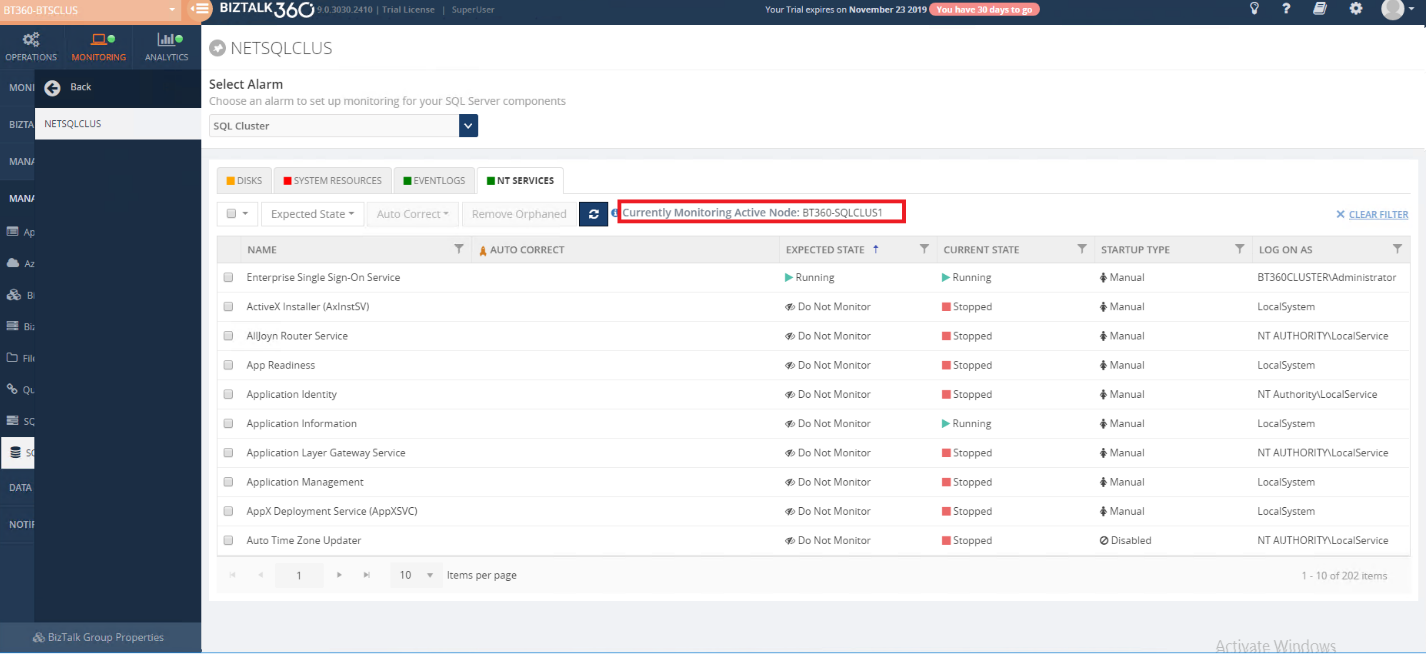
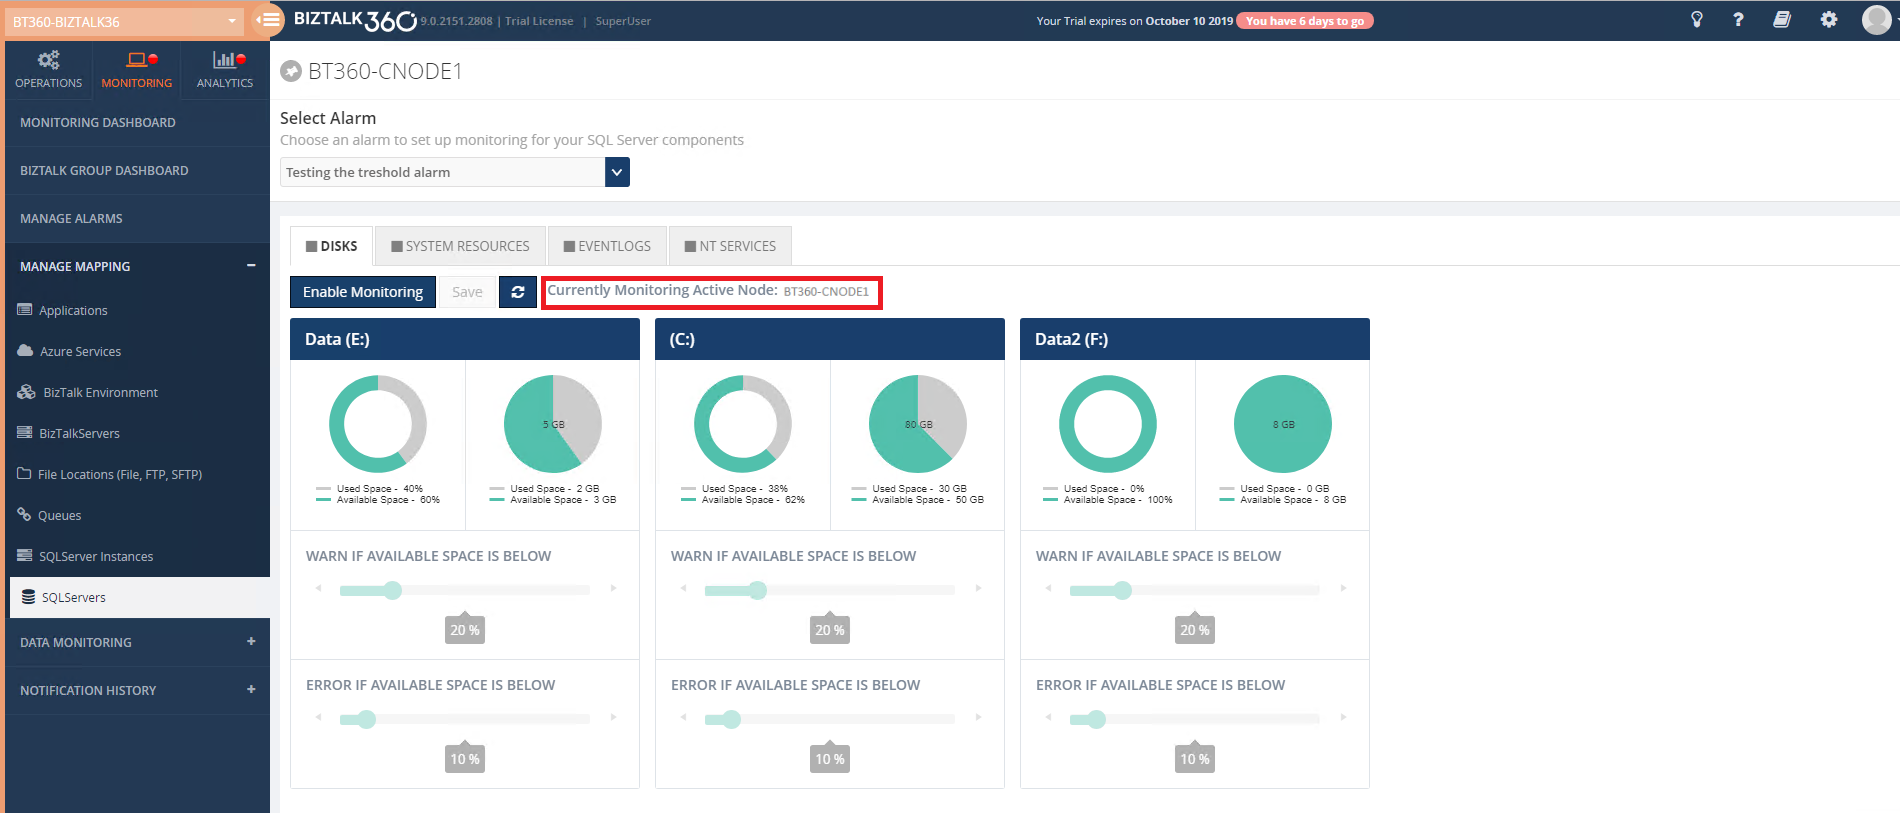
In clustered SQL Server monitoring, it will show the currently active monitoring Node, and also it will automatically pick up all the disks in the currently active node.
By Default, warning and error thresholds for each disk will be in 20% and 10%. You can also change the warning and error percentage as per your need and save it. Then, the currently active node will get monitored by the BizTalk360. If the disk space exceeds the set percentage, BizTalk360 will send the alert to the respective user.
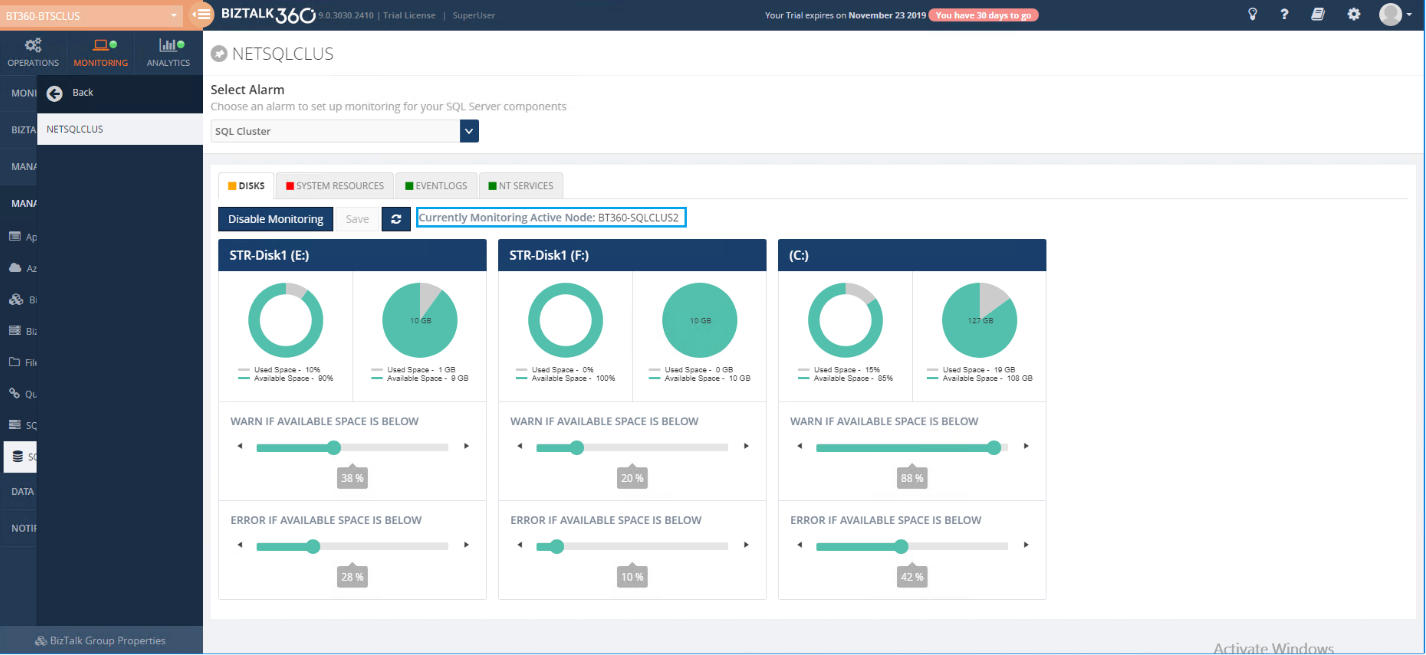
If the “Failover” happens for the monitored disk, then the configured disk will automatically switch to the active server(Failover server).
Consider a scenario if Node 1 has disk A and disk B which are configured for monitoring (error and warning condition as 50 %). Let say, Node 1 went down, then BizTalk360 will automatically pick up the currently active node 2 for monitoring. But what happens if node 2 has Disk B and Disk C?
In the above scenario, the default monitoring configuration i.e error and warning condition 20% is set to the Disk C. Disk A, which is available in node 1 but not in node 2 will be moved to the orphaned state.
As in the above screenshot, the “STR-Disk1 (F:)” disk is newly added after failover with the default warning and error conditions. The other two disks are “STR-Disk2 (E:)”, which is a shared volume, and the (C:) drive is a common volume, which is also configured with the existing warning and error percentages.
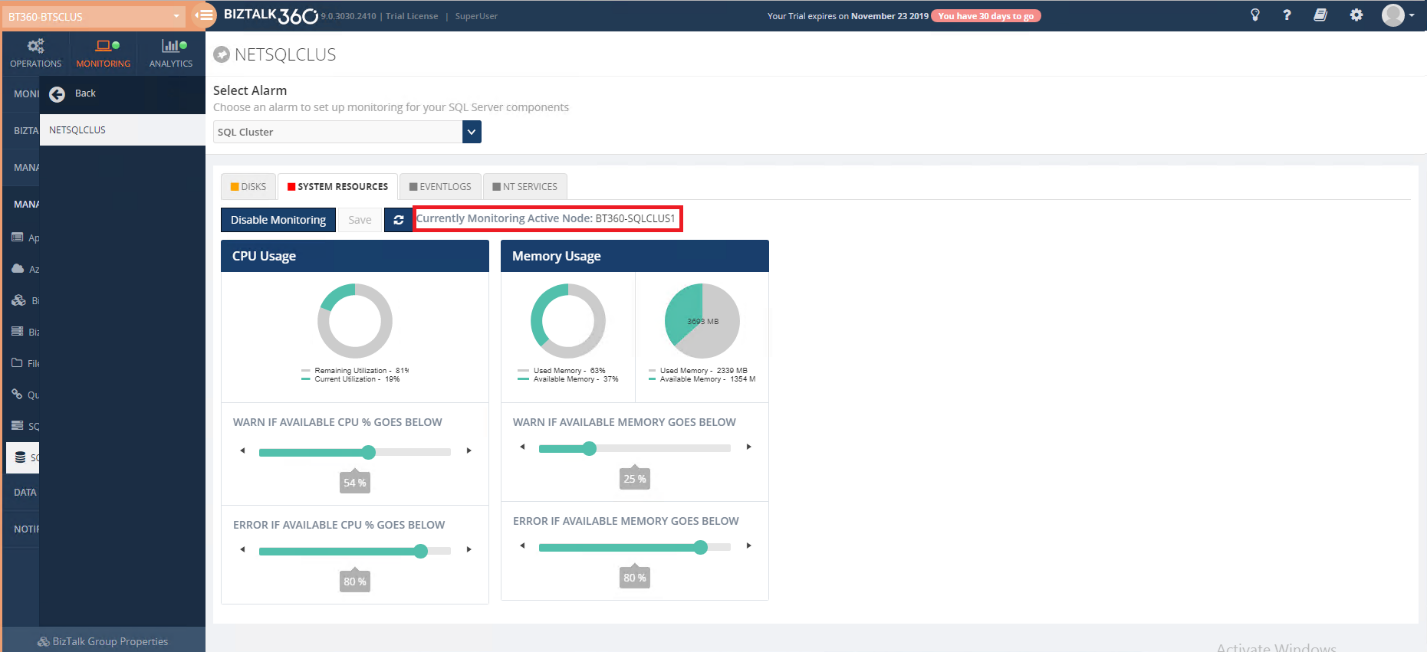
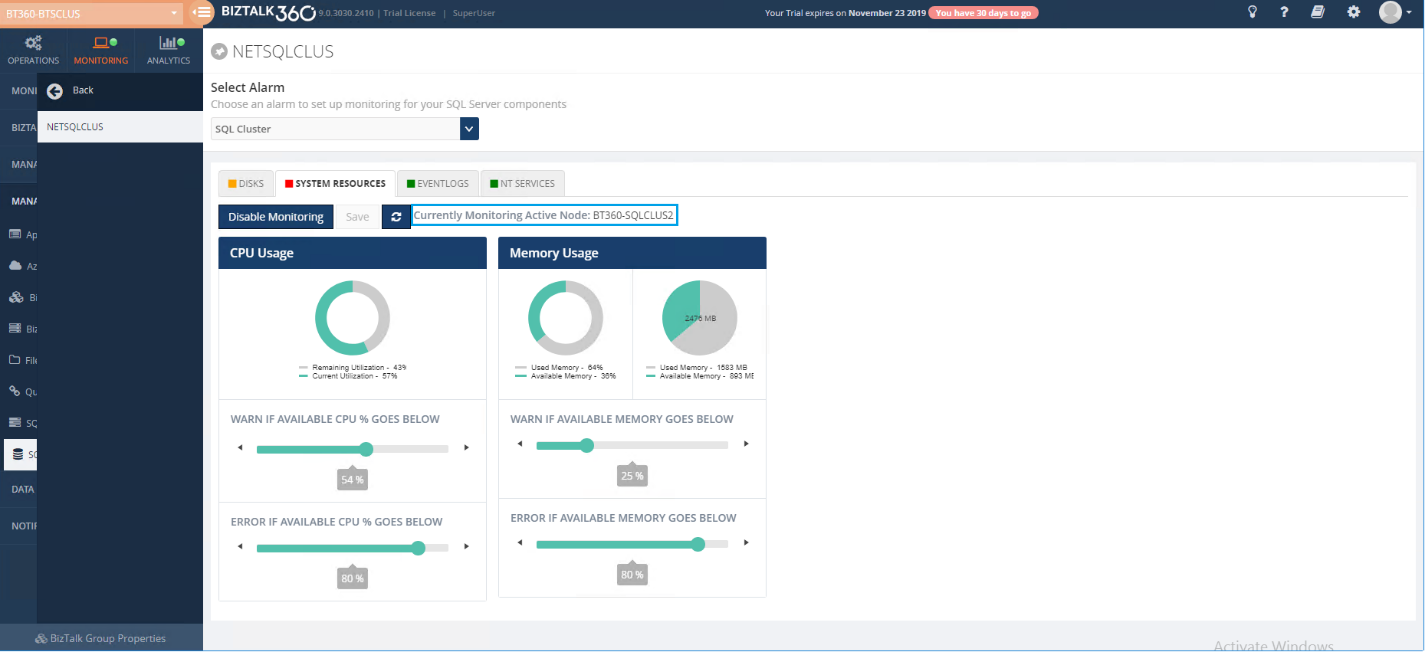
System Resource Monitoring
As the same as disk monitoring, you can set up appropriate warning and error thresholds for CPU and memory as per your business needs. For a Clustered SQL Server, it will show the current active monitoring Node. It will automatically pick up the CPU usage and the memory for the currently active node.
In the case of a Failover, the CPU and the memory will automatically get updated for the active node (failover node) with the existing warning and error conditions.
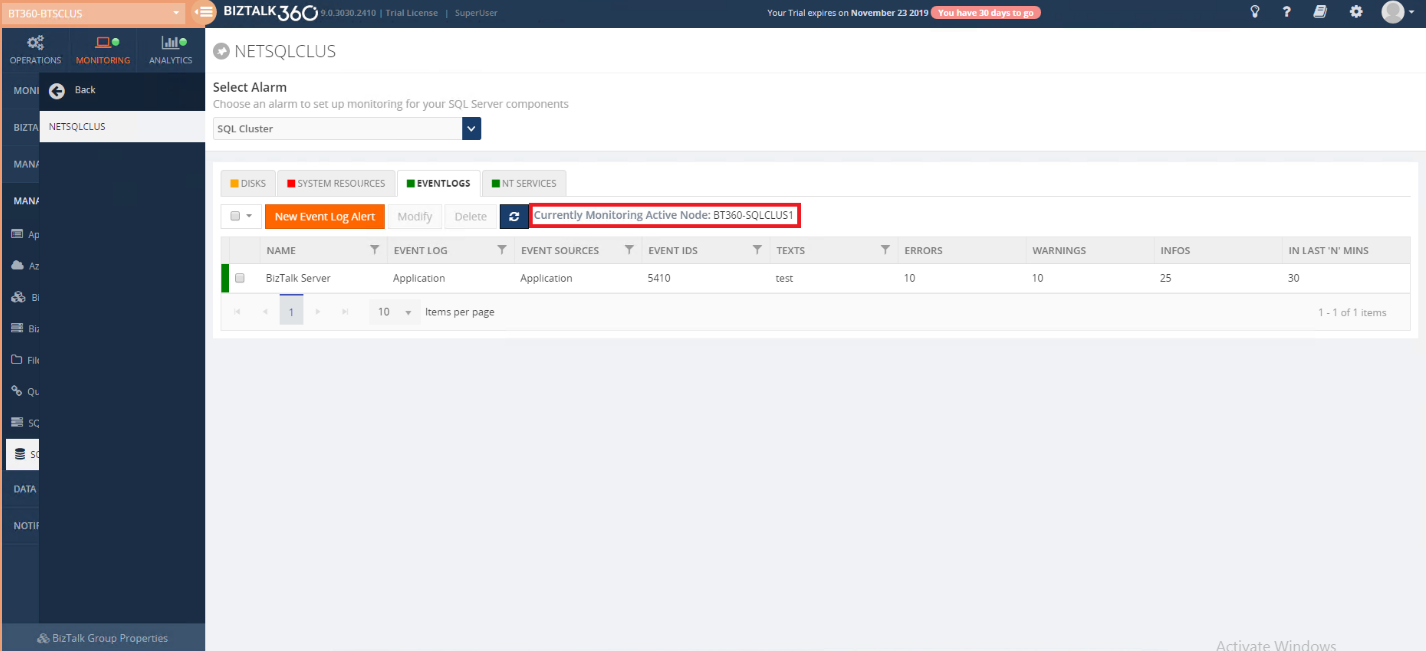
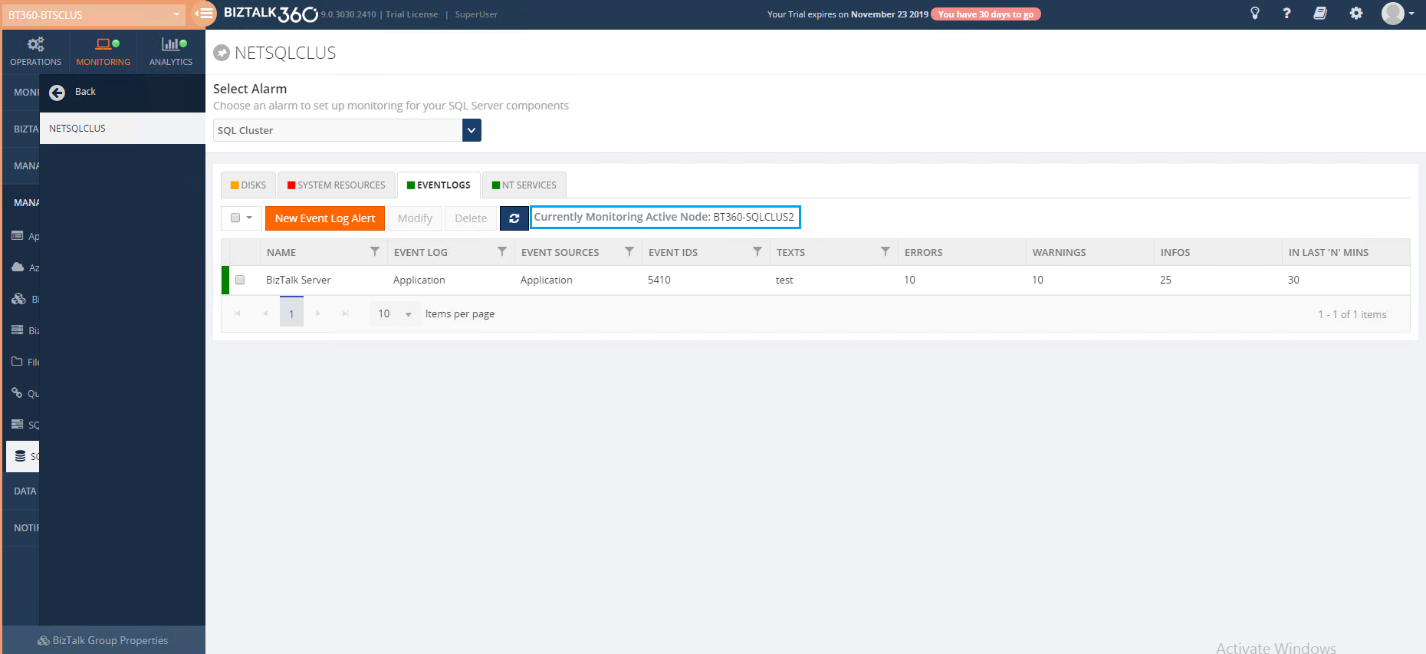
Event Log Monitoring
In a Clustered SQL Server, BizTalk360 monitors the Event Log based on the active node. You can have multiple combinations of event log monitoring, for example, certain sources, certain event ids, certain text in the message, with configured threshold conditions.
Once after Failover, then BizTalk360 automatically starts monitoring the existing event log conditions based on the currently active node (Failover node).
NT Service Monitoring
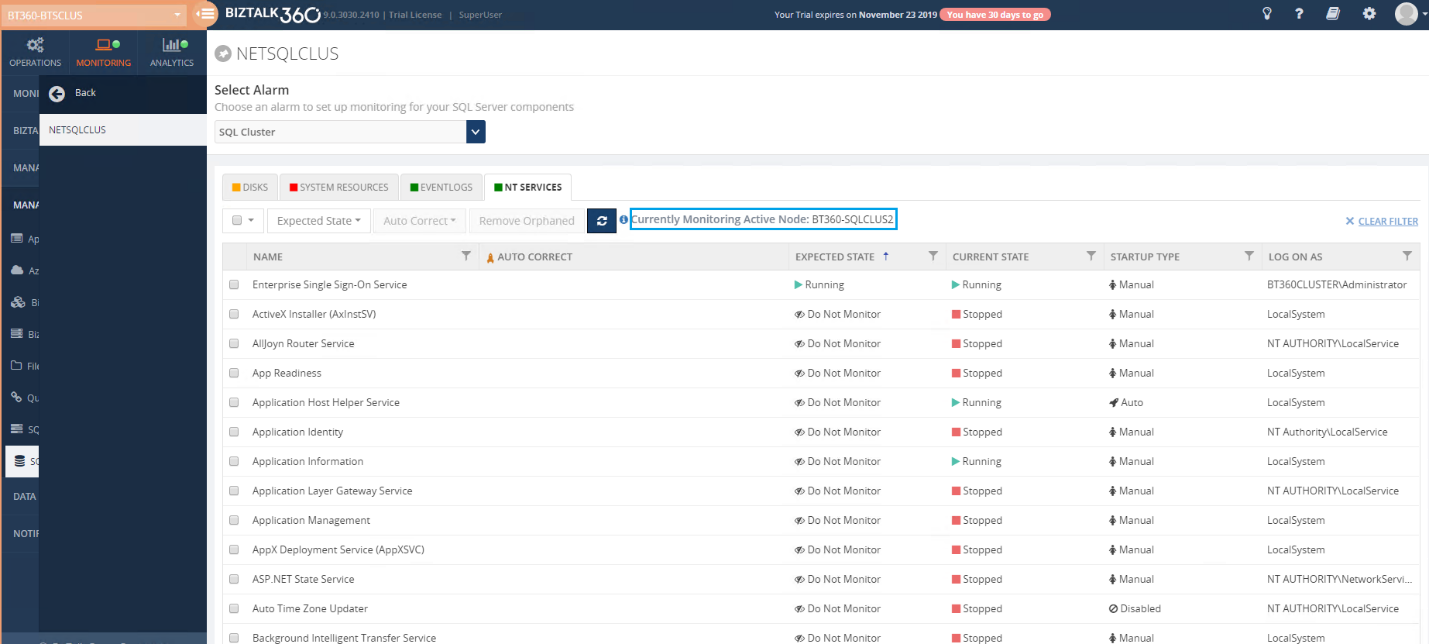
In a Clustered SQL Server, current monitoring will be based on the active server. It will pick up the NT services from the active server for monitoring as you can below.
Once after Failover, the configured NT service will automatically switch to the failover node and start monitoring.
Conclusion
Our objective with the monitoring aspect of BizTalk360 is to make it simple to configure, manage and use it on a day to day basis. The above SQL Server Monitoring will do that, and it will also do the automatic way of monitoring when a failover happens. There is plenty to consider when planning on clustering SQL Server, but we trust that we came up with the best solution. For any suggestion or feedback, post it in the feedback portal.
Do you feel difficult to keep up to date on all the frequent updates and announcements in the Microsoft Integration platform and Azure iPaaS?
Integration weekly update can be your solution. It’s a weekly update on the topics related to Integration – enterprise integration, robust & scalable messaging capabilities and Citizen Integration capabilities empowered by Microsoft platform to deliver value to the business.
If you want to receive these updates weekly, then don’t forget to Subscribe!
It was only 3 days ago that I released the latest version of this package, but someone (aka Wagner Silveira) alerted me to the existence of new shiny icons in the Azure Portal… so I decided it would be a good time to launch a new major release and here it is! I hope you guys enjoy.
Microsoft Integration, Azure, Power Platform, Office 365 and much more Stencils Pack it’s a Visio package that contains fully resizable Visio shapes (symbols/icons) that will help you to visually represent On-premise, Cloud or Hybrid Integration and Enterprise architectures scenarios (BizTalk Server, API Management, Logic Apps, Service Bus, Event Hub…), solutions diagrams and features or systems that use Microsoft Azure and related cloud and on-premises technologies in Visio 2016/2013:
BizTalk Server
Microsoft Azure
Integration
Integration Service Environments (ISE)
Logic Apps and Azure App Service in general (API Apps, Web Apps, and Mobile Apps)
Azure API Management
Messaging: Event Hubs, Event Grid, Service Bus, …
Azure IoT and Docker
AI, Machine Learning, Stream Analytics, Data Factory, Data Pipelines
SQL Server, DocumentDB, CosmosDB, MySQL, …
and so on
Microsoft Power Platform
Microsoft Flow
PowerApps
Power BI
Office365, SharePoint,…
DevOps and PowerShell
Security and Governance
And much more…
… and now non-related Microsoft technologies like:
SAP Stencils
The Microsoft Integration Stencils Pack is composed of 27 files:
Microsoft Integration Stencils
MIS Additional or Support Stencils
MIS AI and Machine Learning Stencils
MIS Apps and Systems Logo Stencils
MIS Azure Additional or Support Stencils
MIS Azure Mono Color
MIS Azure Old Versions
MIS Azure Others Stencils
MIS Azure Stencils
MIS Buildings Stencils
MIS Databases and Analytics Stencils
MIS Deprecated Stencils
MIS Developer Stencils
MIS Devices Stencils
MIS Files Stencils
MIS Generic Stencils
MIS Infrastructure Stencils
MIS Integration Fun
MIS Integration Patterns Stencils
MIS IoT Devices Stencils
MIS Office365
MIS Power BI Stencils
MIS PowerApps and Flows Stencils
MIS SAP Stencils
MIS Security and Governance
MIS Servers (HEX) Stencils
MIS Users and Roles Stencils
That you can use and resize without losing quality, in particular, the new shapes.
What’s new in this version?
I still have many things to do in this project in terms of organization and cleaning some resources but I will leave that for another occasion. The main goal of this release was to provide the new icons present in Azure Portal. In this version the changes and additions are:
New shapes: I think almost all the new shapes layout present in Azure Portal are now added in this package.
New categories: MIS Azure Mono Color, MIS Azure Old Versions, MIS Azure Others, MIS Integration Fun;
Categories Renaming: MIS Databases and Analytics and MIS AI and Machine Learning
SVG Files: The SVG files, from all these new resources, are now available on GitHub
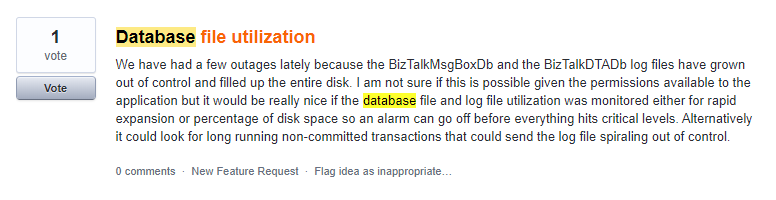
In any BizTalk environment, it is important to keep track of database growth and execute the data purging policies whenever necessary. When the database size grows, the SQL server needs more memory and CPU to read data from the tables, which slows down the database operation. Besides that, there is also the risk that, due to the growing database(s), you are running out of disk space. Database Administrators spend a lot of their time dealing with the problem of database processes consuming too much disk space. So, it’s very important to monitor the database size to ensure the database is not seizing the memory and CPU for smooth BizTalk server operation.
The ability of Database Size Monitoring is a feature request we picked up from our feedback portal. This feature will be available for production use from BizTalk360 version 9.0 phase 3 on.
What can be monitored with Database Size Monitoring?
With Database Size Monitoring, you can monitor the data file and log file sizes of below BizTalk Server and BizTalk360 databases, by simply configuring the error and warning threshold conditions for the data and log file sizes.
For example, if the size of the BizTalkDTADb is greater than a configured threshold value, then you will get notified.
Scenario
OutOfMemoryException in BizTalkDTADb
BizTalkDTADb contains the health monitoring data tracked by the BizTalk Server tracking engine. The size of the database can grow relatively quickly depending on the load of your server, which in turn results in OutOfMemory Exceptions.
This scenario can be overcome by proactively knowing the size of the database and acting against the exponential growth of the database by configuring the threshold limit in database size monitoring.
Monitor BizTalk360 database Growth
There might be a situation where the BizTalk360 database grows due to the amount and size of event log data and performance counter data. The BizTalk360 purging policy will take care of the data growth, but it is also important to monitor the size regularly to ensure BizTalk360 is working seamlessly.
Configuring Database for monitoring size
We wanted to simplify the process of configuring database size monitoring. To achieve this, we list all the BizTalk and BizTalk360 related databases. You can start monitoring by specifying the threshold details from the SQL instance.
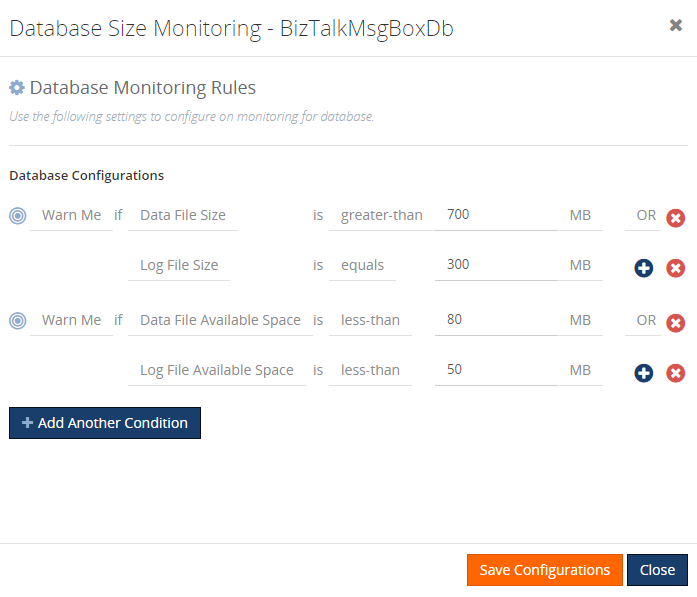
To configure a database for monitoring, navigate to Monitoring->BizTalk environment-> Database Size, which lists all the BizTalk and bizTalk360 databases under the respective SQL Instances. Click on the config gear icon, as shown in the above image, to configure the threshold values to monitor the size of the database. Based on the threshold configuration, the user will get notified if there is any threshold violation occurring.
The available Threshold types, logical condition, and unit prefixes are:
Threshold Type
Logical Condition
Unit Prefixes
Data File Size
Data File Used Space
Data File Available Space
Log File Size
Log File Used Space
Log File Available Space
Equals
Not-Equals
Greater-than
Greater-than-or-Equal
Less-than
Less-than-or-Equals
Bytes
Kilo-Bytes (KB)
Mega-Bytes (MB)
GigaBytes (GB)
Following are the threshold types on which you can monitor a database:
Threshold Type
Explanation
Data File Size
This threshold type represents the reserved space for the data file.
For e.g.:
Warn Me if Data File Size is Greater-than 200 GB
Error if Data File Size is Greater-than 250 GB
Data File Used Space
This threshold type represents the size used by the data file.
For e.g.:
Warn Me if Data file Used Spacenot-equals 250 GB
Error if Data file Used Space not-equals 250 GB
Data File Available Space
This threshold type represents the available space for the data file
For e.g.:
Warn Me if Data file Available space less-than-or-equals 99 GB
Error if Data file Available space less-than-or-equals 99 GB
Log File Size
This threshold type represents the size reserved for the transaction log file.
For e.g.:
Warn Me if Log File Size is Greater-than 200 GB
Error if Log File Size is Greater-than 200GB
Log File Used Space
This threshold type represents the space used by the log file.
For e.g.:
Warn Me if Log File Used Space not-equals 250 GB
Error if Log File Used Space not-equals 250 GB
Log File Available Space
This threshold type represents the available space for the log file.
For e.g.:
Warn Me if Log File Available Space Greater-than 250 GB
Error if Log File Available Space Greater-than 250 GB
Once the threshold values are configured and saved, the monitoring conditions will be evaluated, and the status of the database size will be displayed in the grid.
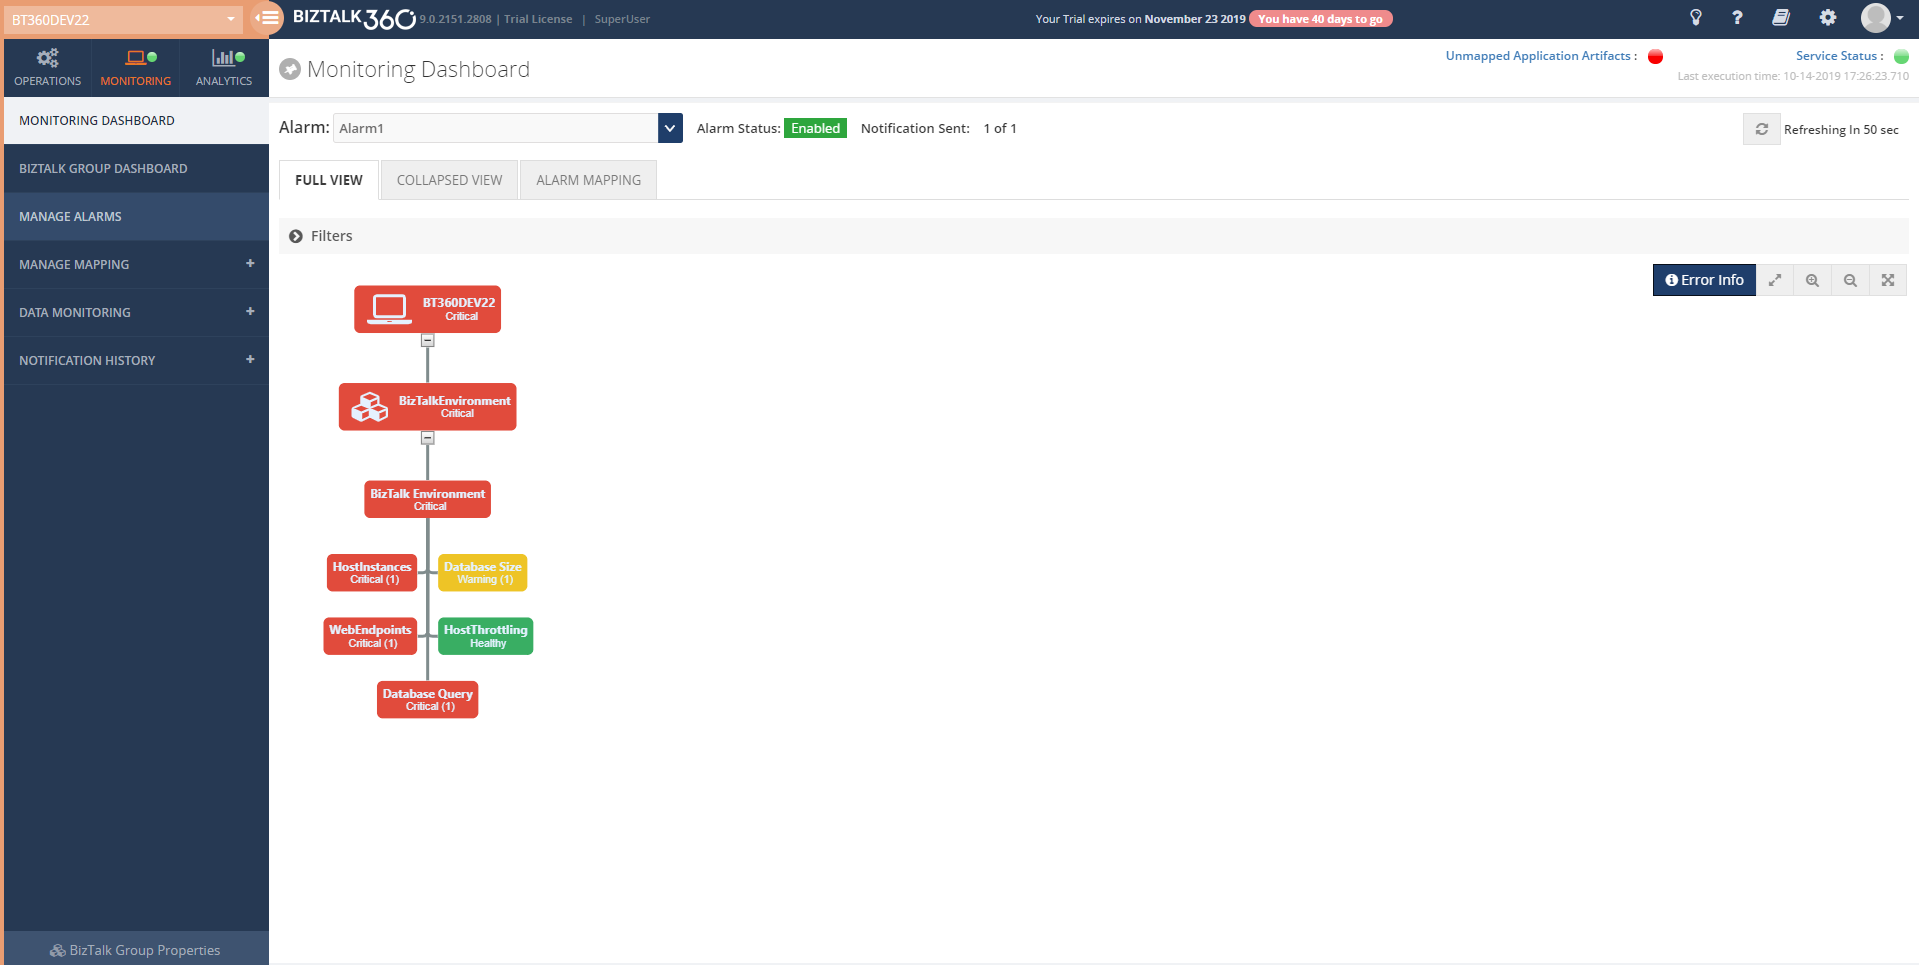
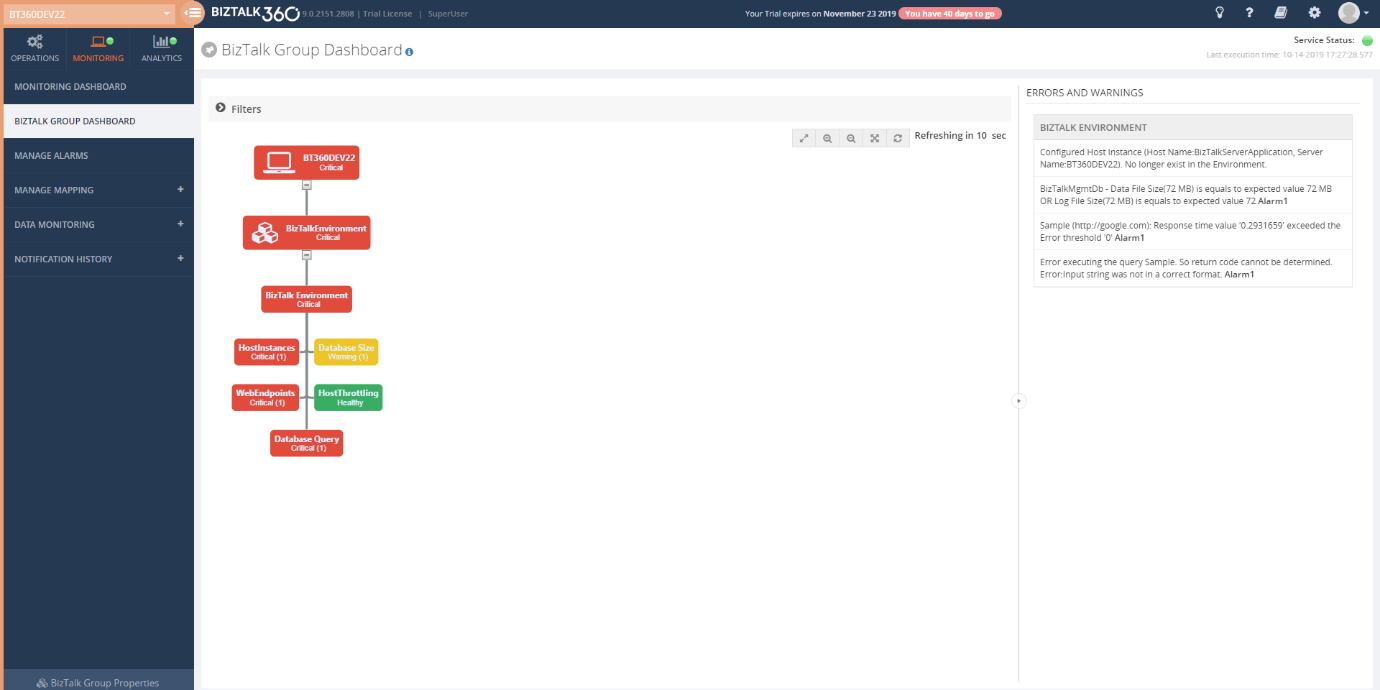
The Monitoring Dashboard and BizTalk Group Dashboard display the overall status of the alarm including the Database size shown in the picture below.
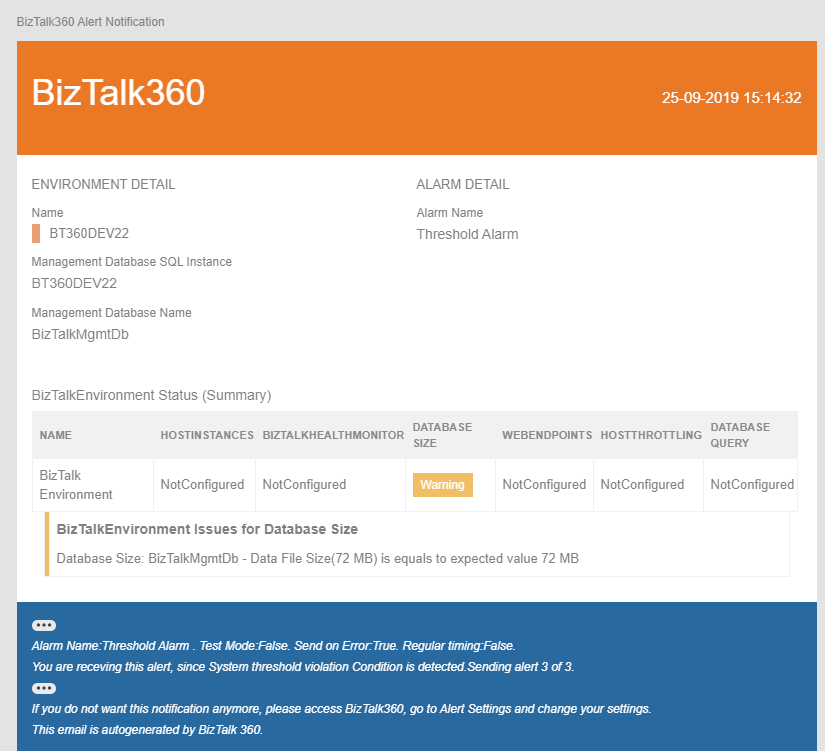
The user will get notified through mail or notification channel when any threshold violation happens.
Quick Alarm
You can also configure database size for monitoring simply by configuring Quick alarm. In this case, an alarm will be created and all the BizTalk and BizTalk360 databases will get configured for database size monitoring with default threshold conditions.
Conclusion
Considering the feedback provided by our customers, via the feedback portal, BizTalk360 will continue to provide more useful features every single release. In the upcoming release v9.0 phase 3, the ability to monitor Database Sizes is only one of the features we bring. If you have any suggestions for a =n upcoming version, please write to us at [email protected].
The Analytics Reporting feature is one of the main features which offers out of the box capabilities. It allows users to create schedules and generate PDF documents based on critical performance metrics at specific time periods. In previous versions, we supported only default pre-configured widgets in the Analytics reporting section. From v9.0.2 we provided an option to configure the Secure SQL Queries widgets in the Reporting section.
In the upcoming version v9.0.3, we extended this to support Analytics custom widgets, with this the user can configure the performance metrics as a widget and get them as a report.
Analytics Custom Widgets
In the Analytics dashboard, we have an option to configure performance widgets to the dashboard. Once you enabled any of the types (BizTalk, SQL, IIS, and Windows) in any selected environment, the BizTalk360 Analytics service will start collecting the performance metrics. These performance metrics can be mapped to the custom widget.
Some of our customers requested us to bring the ability to manage analytics custom widgets in the Reporting section. Considering the business value, for BizTalk360 v9.0.3, we are bringing an option to manage analytics custom widgets to the Analytics Reporting, as well as new user experience of the Reporting section.
Analytics Custom Widgets in Reporting
Let’s take a few scenarios to understand what we can achieve with the custom widgets.
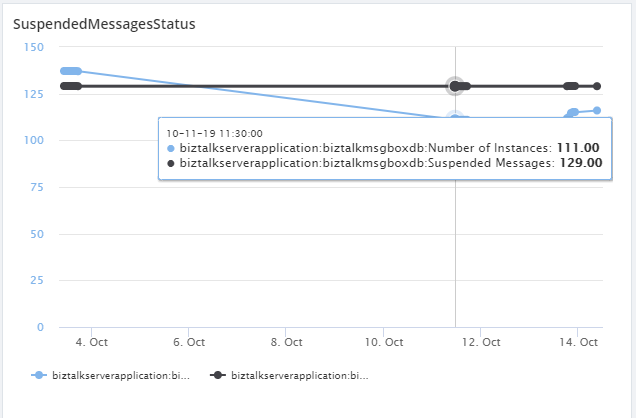
Get the Host Suspended Messages Metrics
Using Analytics custom widget, you can determine the Suspended messages metrics and also the number of instances, per host instances, in a graphical representation. For this, you need to enable the Performance counter Server->BizTalk->BizTalk: Message Box: Host Counters. Once you enabled the metrics and configured to the widget, it will fetch the current metrics values and represent them in a graphical way.
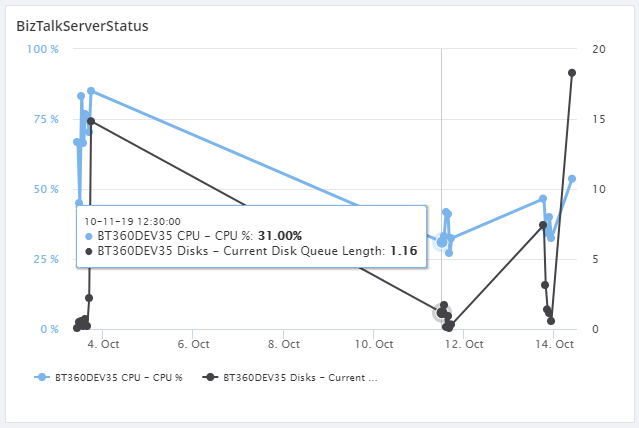
Comparing the performance of two BizTalk servers
Consider another scenario where you would like to compare the performance of two BizTalk servers and find which server consumes more memory and CPU. This can be achieved by configuring servers and select the appropriate metrics for the widgets.
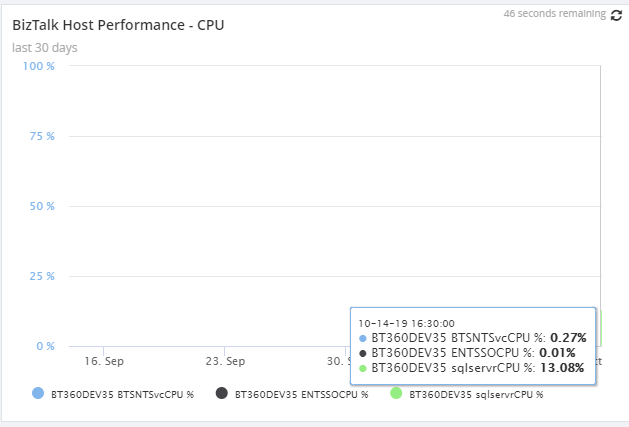
BizTalk Host Performance By CPU
By enabling the Server->BizTalk->Process -> % Process time, in Analytics Configuration under the Settings section, you can see the Host Performance by CPU, by using an Analytics custom widget. Once you enabled the metrics and configured the widget, the Analytics service will collect the counters for the selected metrics and represent it in a graphical way.
Below are some of the BizTalk performance metrics which you can configure as an analytics custom widget and get it as a report.
BizTalk and SQL Server Health
CPU Usage
Memory Usage
Disk Free Space
Average Disk Queue Length
Network Performance
IIS Request Per Sec
IIS Worker Process: CPU Usage
IIS Worker Process: Memory Usage
Host Performance
Host Instance performance by CPU
Host Instance Performance by Memory
CPU Consuming Host Instances
Top 10 Memory Consuming Host Instances
BizTalk Messaging Performance
BizTalk Host Performance
Documents Receive/Second
Documents Processed/Second
Inbound Latency (Sec)
Outbound Latency (Sec)
Outbound Adapter Latency (Sec)
Request -Response Latency
Throttling Performance
Message delivery Throttling State
Message Publishing Throttling State
Message Delivery Outgoing Rate
Message Delivery Incoming Rate
Active Instance Count
Database Size
Database Session
Database Session Threshold
In-Process message Count
In-Process Message Count threshold
Message publishing incoming Rate
Message Publishing Outgoing Rate
Reports
In order to improve the user experience in the Analytics Reporting section, we have modified the User Interface for that section.
Previously, when we create a new report, the report would be added under the Reporting group on the left side navigation bar. We felt that it would be a bit confusing to the customer like where to start with. So, we removed the navigations and introduced a new page for Manage Reports.
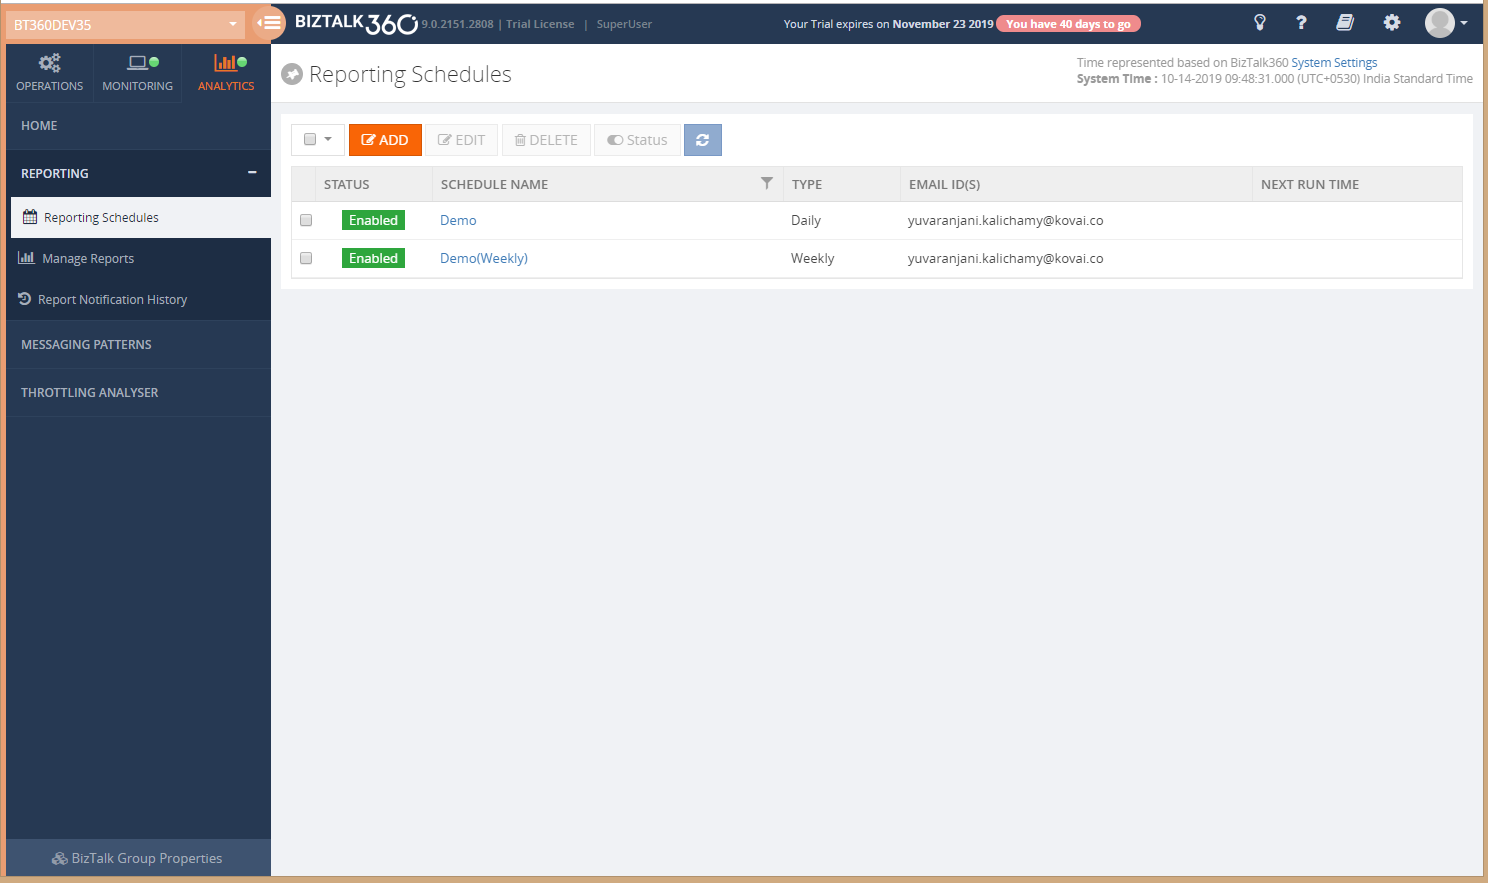
In the Analytics Reporting Section, we now have 3 sub-menus:
Reporting Schedules
Manage Reports
Report Notification History
Reporting Schedules
As a first step, you need to create a schedule to get a periodic report of the configured widgets. To create a schedule, refer to this article.
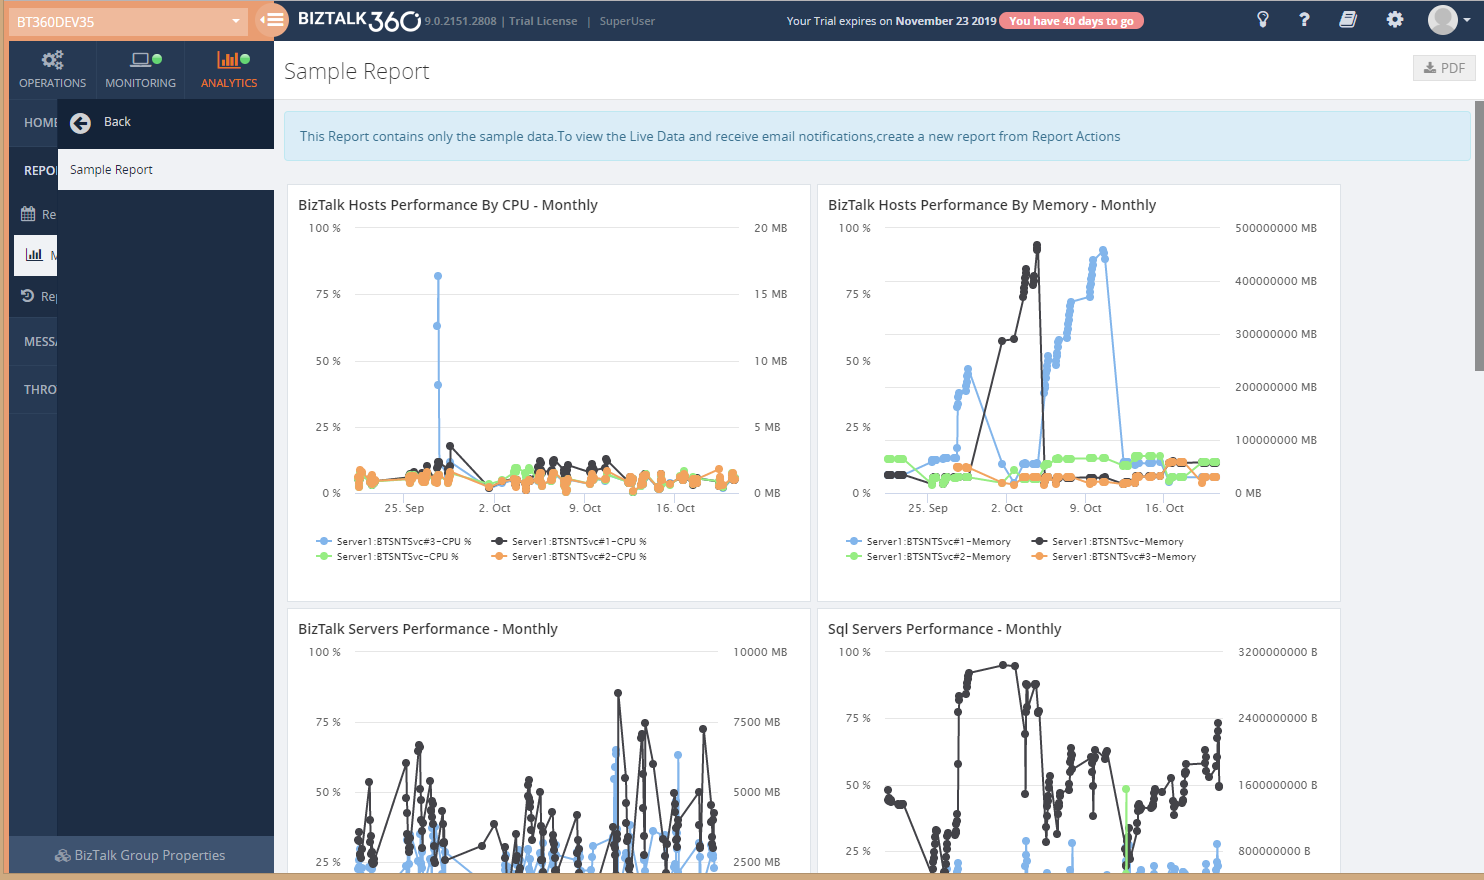
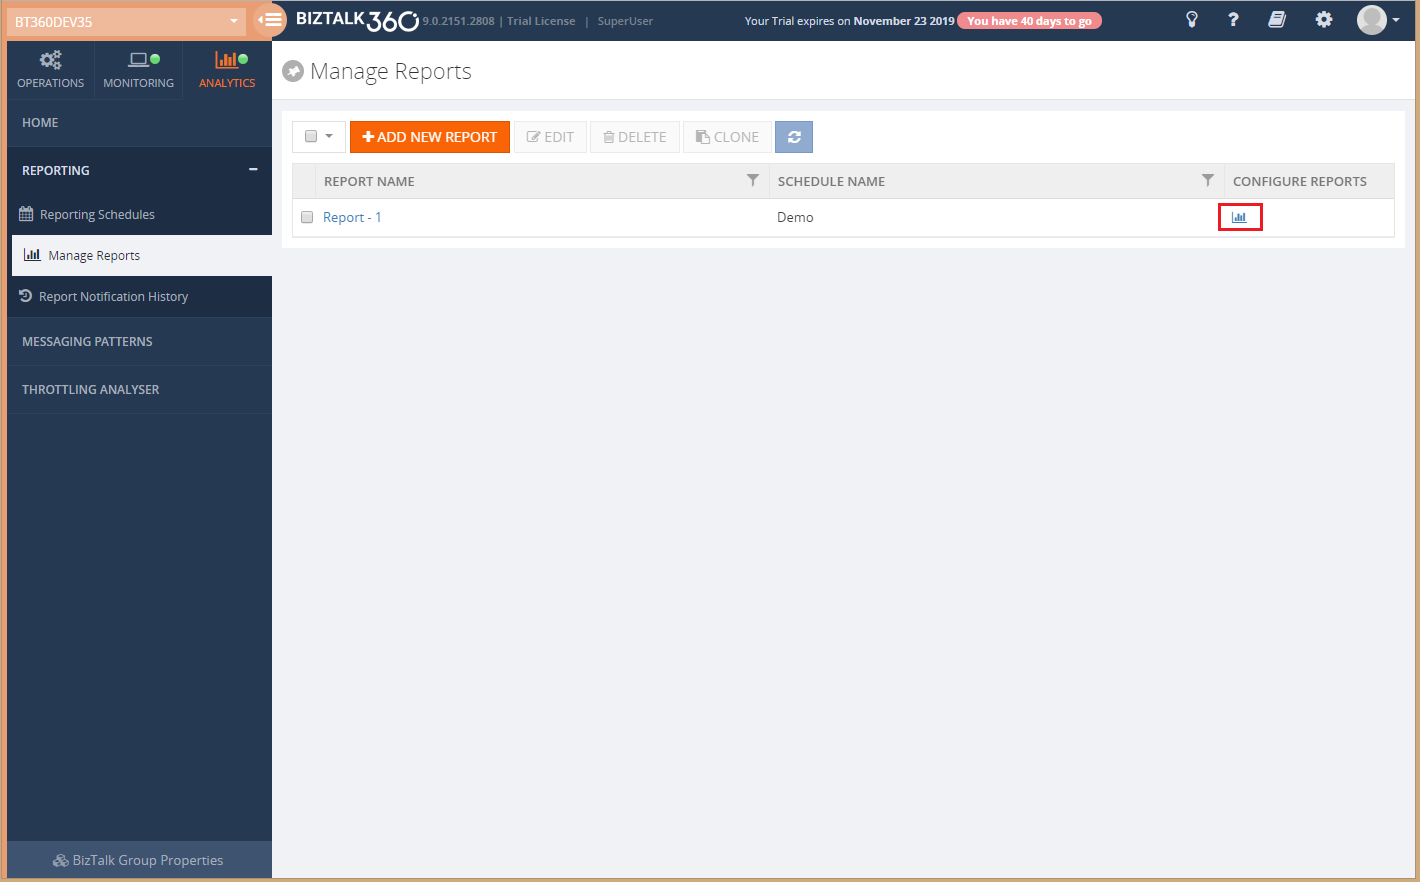
Manage Reports
Once after creating a schedule, the next step is to create a report and add widgets to the report. Once you get into the Manage Reports section, you will be able to see the Sample report in the grid. You can’t do any operations with the ‘Sample Report’ except viewing the sample widgets.
By clicking Configure reports icon, you can see the Sample widgets in the Report.
In the Manage Reports section, you can manage (Add/Edit/Delete/Clone) the reports.
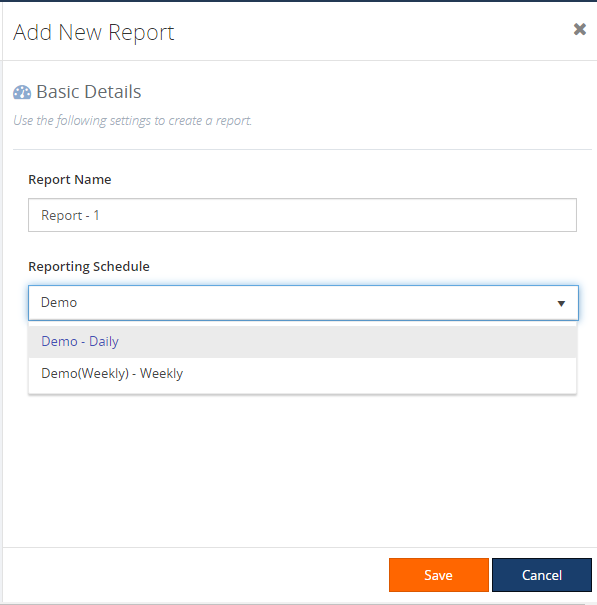
To create a new report, click on the ‘Add New Report’, the blade will open and then you can provide the name of the report and chose the schedule (how often do you want to receive the reported).
Once after you have saved the configuration, the new report will be generated and added to the grid. The Sample Report will be removed from the grid.
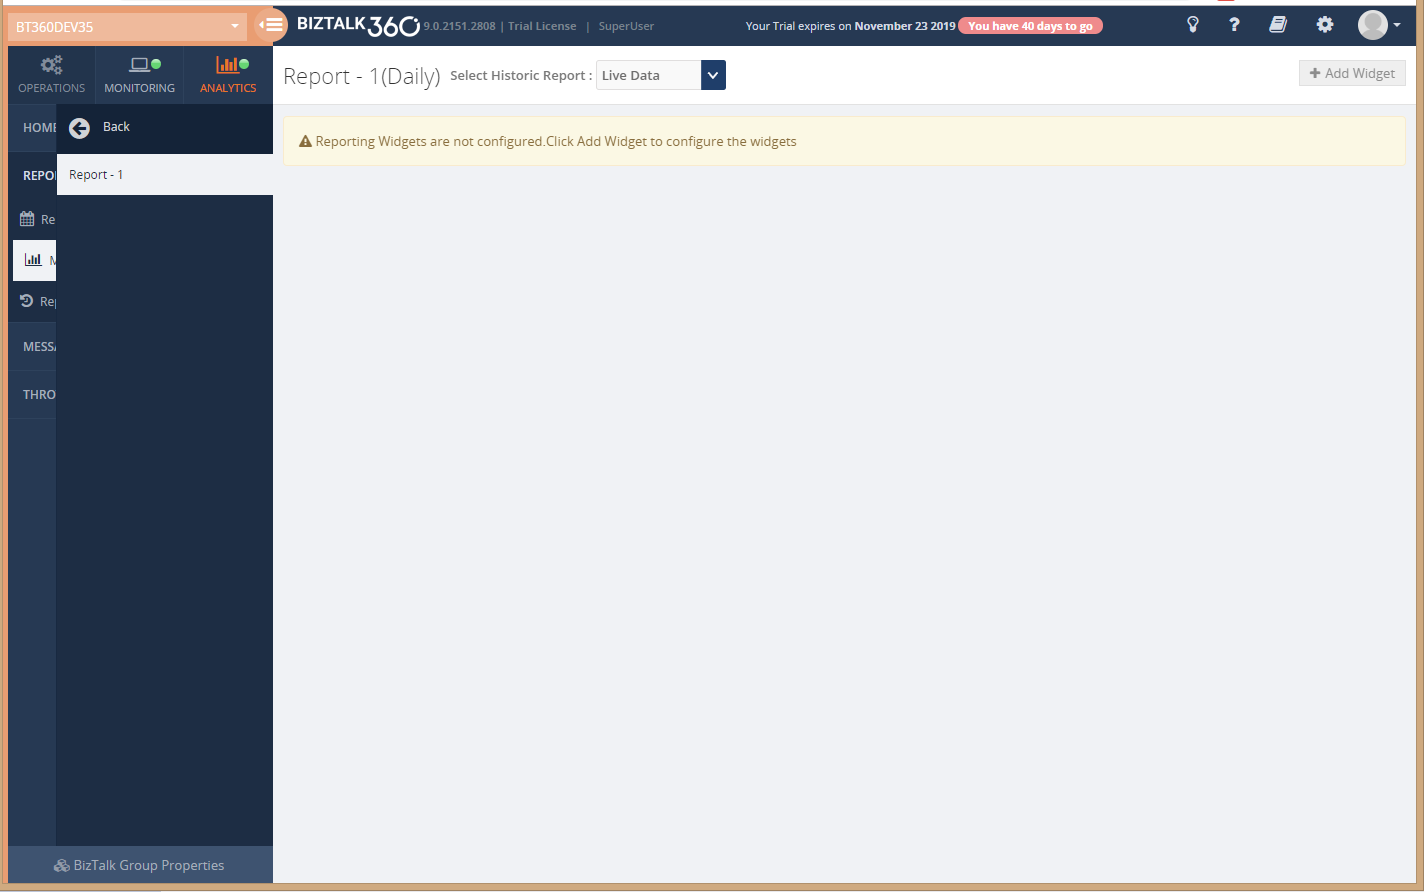
To manage the widgets in the report, click on the Configure Reports icon.
There you can see the options to add widgets(custom/basic). Refer to the Manage Widgets article to know more about how to manage the widgets in the Report.
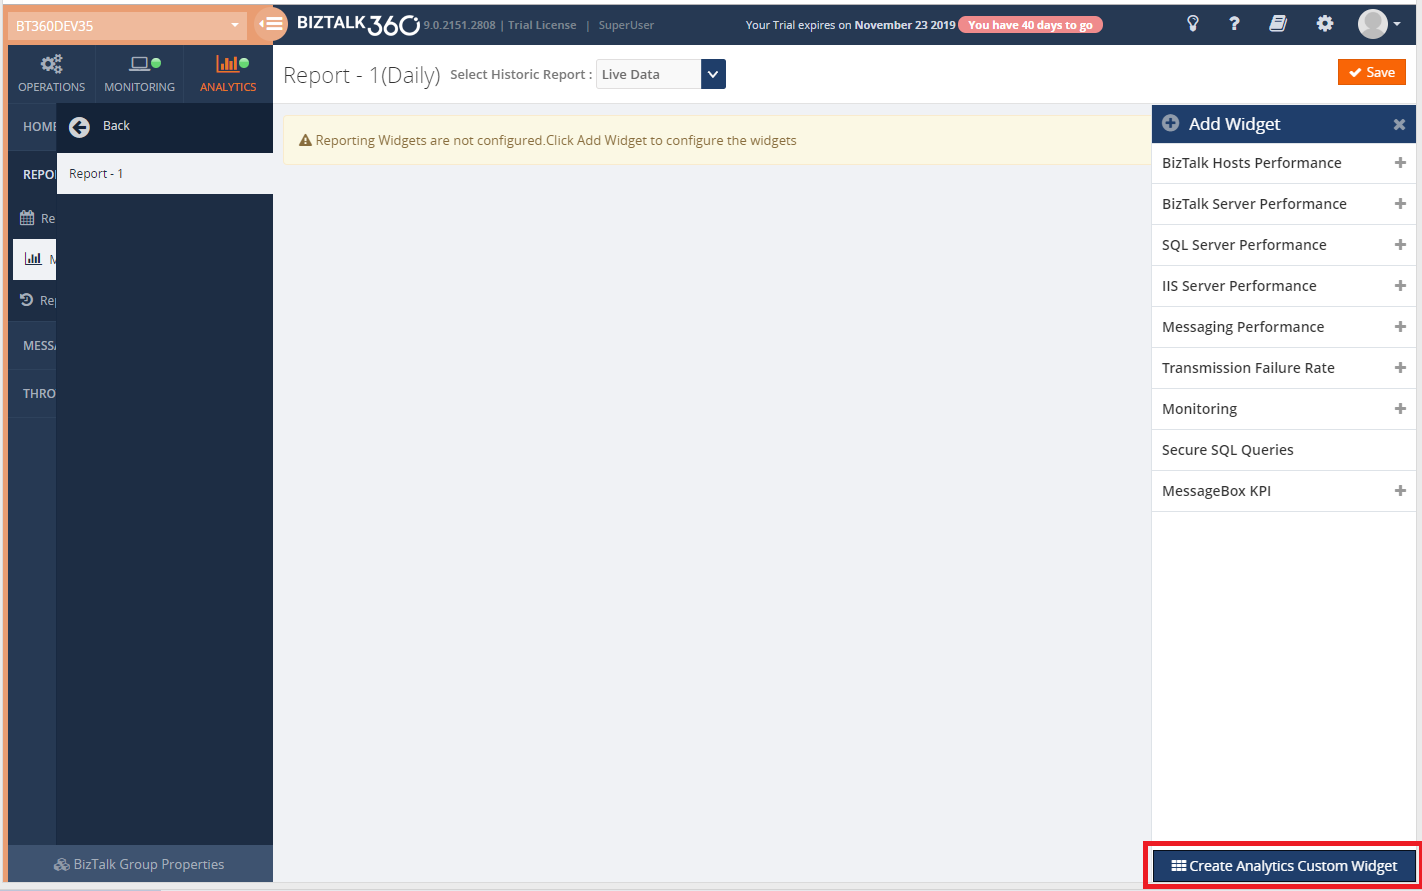
Configure Analytics Custom Widgets to the Report
Click on ‘Add Widget’, this will open a blade. At the bottom of the blade you can see the ‘Create Analytics Custom widget’ option.
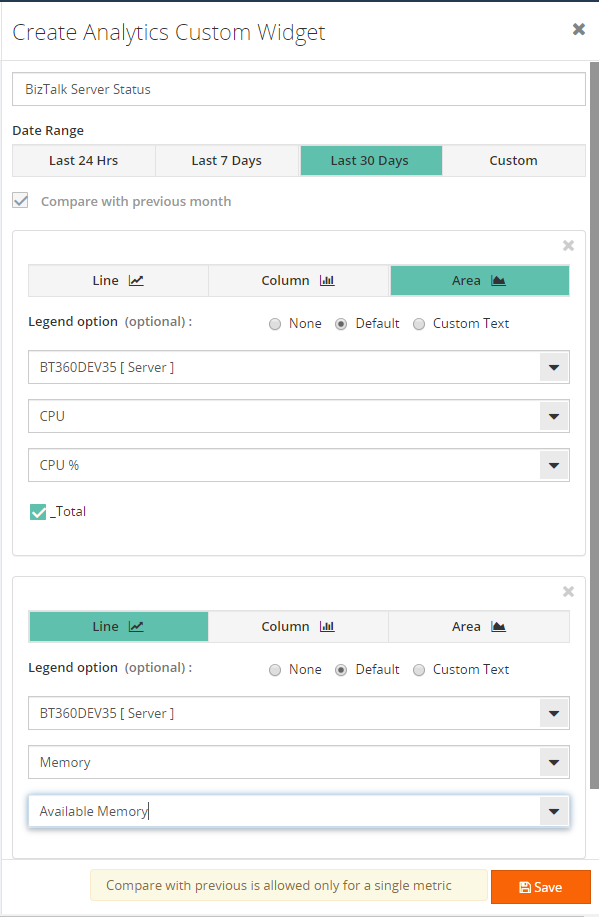
Click ‘Create Analytics Custom Widget’, it opens a blade where you can see the metrics which all are enabled (in Tracking data collection in the Settings section).
You can map whatever performance metrics you want to get as a PDF in your email box.
For instance, I will configure the metrics, as mentioned above, that I want to know how much memory and CPU my BizTalk Server consumes.
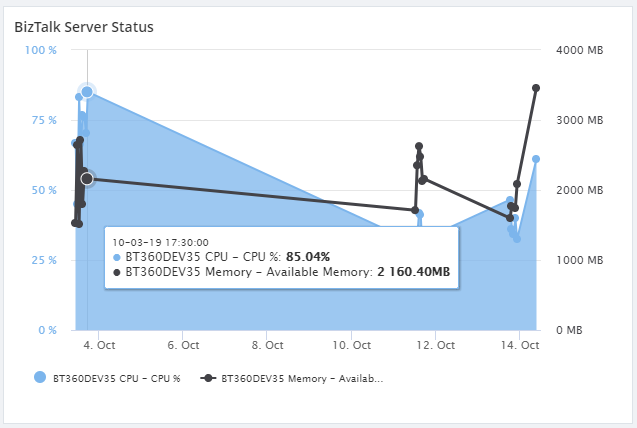
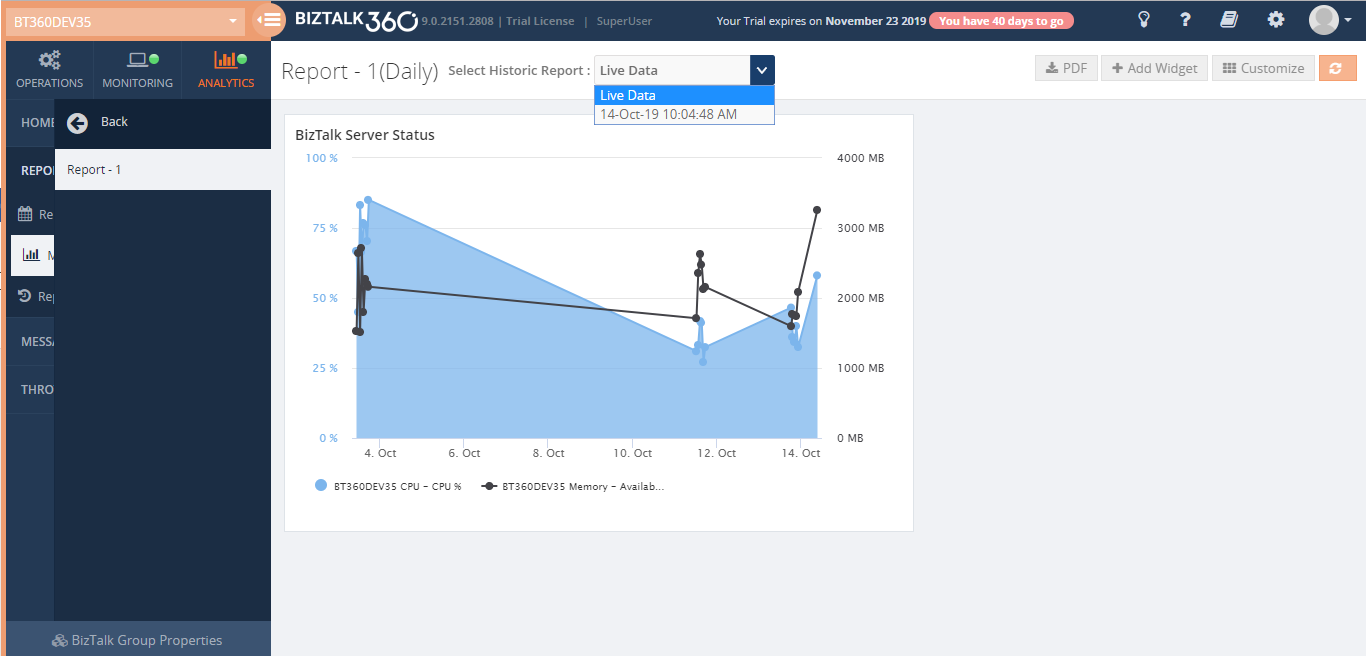
Live Data and Historical Data
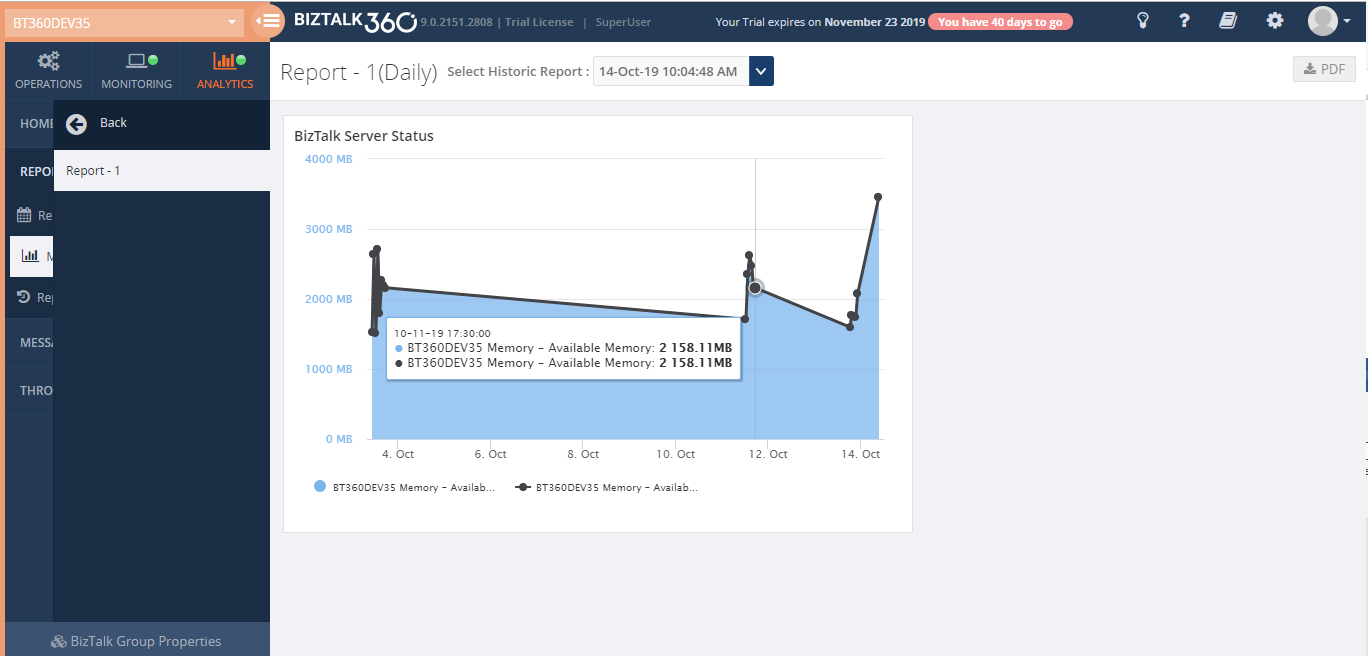
Once the report has been generated and sent to the recipient’s email, the generated report will be stored and can be viewed by choosing the Date Time in the filter.
You can see the actual data sent as an attachment to your email address.
Using Live Data, you can see the actual metrics.
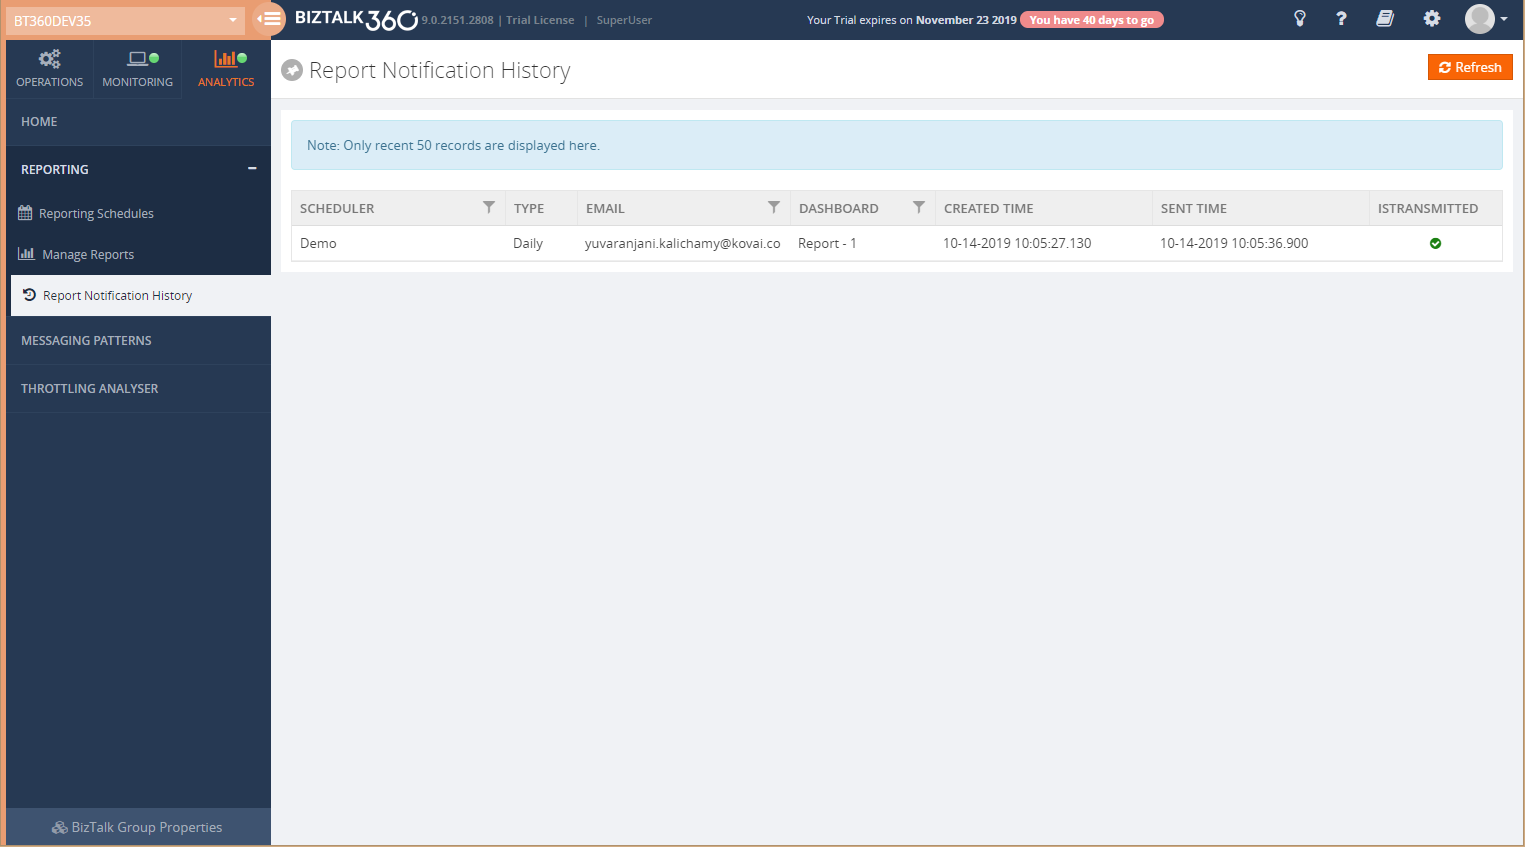
Report Notification History
Using Report Notification History, you can see whether the mail has been sent to the recipient’s Email address or not. This will be represented in a success and error icon; A green tick icon is for the successful message and a red cross icon for the failure of sent. It will show only the top 50 records.
Conclusion
I hope this blog has given you overall information about how to start with Analytics Reporting, the new user interface and how to configure the Analytics custom widget to the Reports.
For more information about how these widgets work, check our Documentation Portal.
Microsoft Integration, Azure, Power Platform, Office 365 and much more Stencils Pack it’s a Visio package that contains fully resizable Visio shapes (symbols/icons) that will help you to visually represent On-premise, Cloud or Hybrid Integration and Enterprise architectures scenarios (BizTalk Server, API Management, Logic Apps, Service Bus, Event Hub…), solutions diagrams and features or systems that use Microsoft Azure and related cloud and on-premises technologies in Visio 2016/2013:
BizTalk Server
Microsoft Azure
Integration
Integration Service Environments (ISE)
Logic Apps and Azure App Service in general (API Apps, Web Apps, and Mobile Apps)
Azure API Management
Messaging: Event Hubs, Event Grid, Service Bus, …
Azure IoT and Docker
AI, Machine Learning, Stream Analytics, Data Factory, Data Pipelines
SQL Server, DocumentDB, CosmosDB, MySQL, …
and so on
Microsoft Power Platform
Microsoft Flow
PowerApps
Power BI
Office365, SharePoint,…
DevOps and PowerShell
Security and Governance
And much more…
… and now non-related Microsoft technologies like:
SAP Stencils
The Microsoft Integration Stencils Pack is composed of 23 files:
Microsoft Integration Stencils v4.0.2
MIS Additional or Support Stencils v4.0.0
MIS AI Stencils v4.0.0
MIS Apps and Systems Logo Stencils v4.0.0
MIS Azure Additional or Support Stencils v4.0.0
MIS Azure Others Stencils v4.0.0
MIS Azure Stencils v4.0.2
MIS Buildings Stencils v4.0.0
MIS Databases Stencils v4.0.0
MIS Deprecated Stencils v4.0.0
MIS Developer Stencils v4.0.0
MIS Devices Stencils v4.0.0
MIS Files Stencilsv4.0.0
MIS Generic Stencils v4.0.0
MIS Infrastructure Stencils v4.0.0
MIS Integration Patterns Stencils v4.0.0
MIS IoT Devices Stencils v4.0.0
MIS Office365 v4.1.0
MIS Power BI Stencils v4.0.0
MIS PowerApps and Flows Stencils v4.0.0
MIS SAP Stencils v4.0.0
MIS Security and Governance
MIS Servers (HEX) Stencils v4.0.0
MIS Users and Roles Stencils v4.0.0
That you can use and resize without losing quality, in particular, the new shapes.
What’s new in this version?
I’m doing some changes in the project in terms of organization and resources but instead of taking too much time doing it from top to bottom, I will be releasing small versions until the job is done. In this version the changes and additions are:
New shapes: near 50 new shapes have been added:
3 related to Microsoft Intune – a requested from a community member;
47 related to Security and Governance;
New category: I add a new file to the project called: Security and Governance with 47 shapes;
SVG Files: I’m starting to provide also the SVG files, from all these resources. At the moment these new shapes that were released in this version are now available in SVG Files on GitHub
Do you feel difficult to keep up to date on all the frequent updates and announcements in the Microsoft Integration platform and Azure iPaaS?
Integration weekly update can be your solution. It’s a weekly update on the topics related to Integration – enterprise integration, robust & scalable messaging capabilities and Citizen Integration capabilities empowered by Microsoft platform to deliver value to the business.
If you want to receive these updates weekly, then don’t forget to Subscribe!
We are super excited to share the list of features that are planned for our upcoming BizTalk360 release 9.0 Phase 3. We always aim to constantly improve our product in every release, based on customer feedback and their business needs. Generally, we release a new version each quarter. In August 2019, we released Version 9.0 Phase 2. Now Version 9.0 Phase 3 is planned for late November and our team is energetically working towards it.
Reporting for Analytics custom widget
The BizTalk360 Reporting feature offers out of the box capabilities that allow users to create schedules and generate PDF documents of critical performance metrics at specific time periods.
From v9.0 phase 3 on, you can configure analytics custom widgets with the performance metrics of your BizTalk environment such as Messaging Performance, Message Transmission failure rate, Server performance, etc . and get that as a report, based on the schedule configuration.
For example, you can get a report by the end of the day with the number of messages processed for a particular schema or a particular send port.
Database Size Monitoring
This feature will be helpful for BizTalk administrators who frequently check the database growth to ensure the health of the BizTalk databases.
Some of the BizTalk databases can grow extremely big; it’s not uncommon to have over 1 million records in certain tables (ex: MessageInOutEvents table in Tracking Database). As the database size grows, the SQL server will need more memory and CPU to read data from the tables, and when the size of each table increases, it slows down the DB operations and affects the BizTalk operation.
With Database Size Monitoring, you can monitor the database and log file size of below BizTalk and BizTalk360 databases, by simply configuring the error and warning threshold values for the database and log file sizes.
BizTalkDTADb
BizTalkMgmtDb
BizTalkMsgBoxDb
BizTalkRuleEngineDb
BAM Db’s
SSODB
BizTalk360
For example, If the size of the BizTalkDTADb is greater than a threshold value configured, then you will get notified.
Configurable polling interval for monitoring
The BizTalk360 Monitoring Service usually runs every 60 seconds and checks for the status of the artifacts which are mapped for monitoring, which include Application artifacts, File/FTP/SFTP, Queues, web endpoints, etc. We got requests from a few of our customers that they have configured multiple endpoints for monitoring and the BizTalk360 monitoring service calls the endpoint for every 60 secs to check the status, but they don’t want to call the endpoints frequently i.e. every 60 secs. So, to improve this, we are providing an option to configure the polling interval for monitoring; depending on the configurated time, only then the monitoring service calls the endpoint.
SQL Server Cluster Monitoring
In BizTalk360, we have a BizTalk and SQL Server Monitoring which allows you to monitor the Disks, System Resources, Event Log, and NT Services. From this version on, we extend our support to monitor the SQL Server cluster. By configuring the SQL Server network name for monitoring, BizTalk360 will start monitoring the current active node and in case of failover scenario, BizTalk360 will automatically take the active server for monitoring.
Support SQL Authentication SQL Query
The standard BizTalk Admin Console does not come with any capabilities related to accessing SQL Server data. This leaves the support people to rely on external SQL tools like SQL Server Management Studio (SSMS). Tools like SSMS are designed for DBA’s and Developers, and it’s not particularly friendly when it comes to pure support and management; a level of technical expertise is required to be able to use SSMS. We understood the practical challenges of not having an integrated SQL data access tool along with the BizTalk Administration and the challenges it exposes.
That’s why we have already built the “Secure SQL Queries” feature in BizTalk360.
Using Database Query monitoring, you can set up thresholds that are limited to database scalar values. For every BizTalk360 Monitoring cycle, the monitoring service will validate the results of the SQL query against the configured threshold values. If any violation happens, it will trigger a notification to the configured emails in the alarms.
However, since BizTalk360 does not support SQL authentication, currently you cannot access Azure databases from Secure SQL query and in Database Query monitoring. From this version on, the product supports SQL authentication for database access. You can query your Azure databases from the BizTalk360 Database query monitoring and Secure SQL Query sections.
Logic Apps Improvements
From this version on, you can provide access restrictions for logic apps. Based on the role, you can define which user can manage (enable, disable, delete, trigger) the Logic Apps.
Additional details such as Version, Last Run Time and Last Run Status of the logic app will get listed in the grid.
Copy Alarm along with artifact mapping
The first step in monitoring by using BizTalk360 is to create Alarms. Alarms in BizTalk360 act like a package to associate things together. We already have an option to copy the alarm which will copy only the alarm configuration. Now we are extending this to copy the alarm along with the artifact mapping configuration.
Alarm and Monitoring Dashboard Improvements
Below are some of the improvements, we have planned for this release in the Monitoring section:
Indication of alarm status (Enabled/Disabled)
Last Execution Time of the alarm
Number of Alerts Notified (2/3)
Indication whether Auto Correct is enabled or not
The artifacts from the collapsed view will be made clickable to route to the respective configuration
Performance data collection improvement for DTA
We already optimized performance data collection in the last release. in this release, we are improving on DTA performance data collection. With this, we allow users to choose the relevant DTA metrics, which will reduce the number of calls to the DTA database.
Conclusion
Considering the feedback from our customers, BizTalk360 will continue to provide more useful features on every release.
Why not give BizTalk360 a try! It takes about 10 minutes to install on your BizTalk environments and you can witness and check the security and productivity of your own BizTalk Environments.
Last time I spoke both at Integrate UK and Integrate USA were in 2017, that in fact was the last time this event also happened in the USA, in which my session was on this same topic, part one of this topic: BizTalk Server Fast & Loud. And in reality, it was merely a happy coincidence, to do these two events again two years later and have decided to do the second part of this previous lecture, because by the time I chose the topic I didn’t know that I would return to the US… but it was a happy coincidence that fit very well!
And the reason I decide this second part was because I had received so much amazing feedback about my BizTalk Server Fast & Loud session two years ago. I can confess that in the beginning, I was a bit nervous to do this sequel, mainly because I want to keep the same good level of the previous one, avoiding what usually happens with the sequels in the movies, as a new part is released the quality goes down… but in the end I think I did a good job, that was confirmed by the awesome feedback provided by the attendees of both events. Personally, I love this session more than the previous one. But if you were not there two years ago, do not watch this talk without seeing the first part of this session here: BizTalk Server Fast & Loud.
About my session
Session Name: BizTalk Server Fast & Loud Part II: Optimizing BizTalk
Session Overview: Following the success of one of Sandro’s previous presentations at Integrate, Sandro decided to go deep on this hardcore BizTalk topic: Optimizing your BizTalk Server. This session will allow you to gain a better view on how to optimize BizTalk Server for better performance in all phases: your team’s proactivity, your code, your environment, and your goals. Once again, this is a very extensive and complex topic and there is no magic formula you can apply to solve all your problems. This presentation will aim to guide you through some of the most important steps, operations, tasks and best practices that you need to do or be aware of, in order to boost the performance of your BizTalk Server projects and that you can adjust or follow according to your needs.
Like previous years, the event in London is recorded, so if for any reason you could not be present at these events, or if you want to review it again, you can now do it here: