This post was originally published here
From the upcoming BizTalk360 version 9.0 phase 3 on, we extend our support to monitor SQL Server clusters. By configuring the SQL Server Network Name for monitoring, BizTalk360 will start monitoring the current active node and in case of failover scenario, BizTalk360 will automatically take the active server for monitoring.
It’s important to make sure the physical infrastructure of your SQL servers like disks, CPU, memory, etc., are healthy for proper functioning. BizTalk360 made this simpler by having the SQL Server Monitoring capability.
BizTalk360 will alert to the user when the configured disk space, CPU, memory usage exceeds the set percentage.
Challenge
In existing BizTalk SQL Monitoring, we came across a few challenges on monitoring the clustered SQL Server
- The user could not find the active node while monitoring the clustered SQL Server.
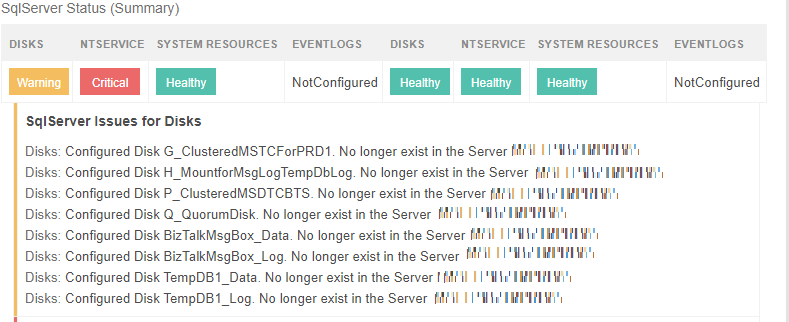
- When the Failover happens, the disk monitoring could not identify the disks of the failover node and an error message was displayed as below.
Scenario 1 (Active/Active): As the same as the previous version of BizTalk360, you can monitor the Clustered SQL Server (Active/Active) or a non-clustered SQL Server, by simply adding the SQL Server physical node in the “Add SQL Server For Monitoring”.
Scenario 2 (Active/Passive): In BizTalk360, you can monitor the Clustered SQL Server (Active/Passive), by adding the common “SQL Server Network Name” for the physical node into the “Add SQL Server For Monitoring”. It will automatically pick up the active server node for monitoring and then it will start monitoring the active node. If a Failover happens, then it will automatically switch to the failover node (Active Node).
Let’s take a quick look at how you can monitor Non-Clustered/Clustered SQL Server (Active/Passive) using BizTalk360.
Non-Clustered SQL Server
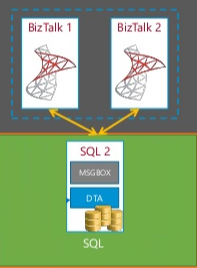
The BizTalk server database will be pointed to one SQL server Instance as below.
Failover Clustered SQL Server
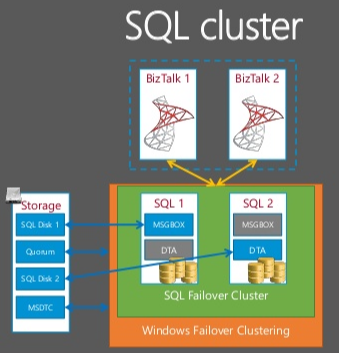
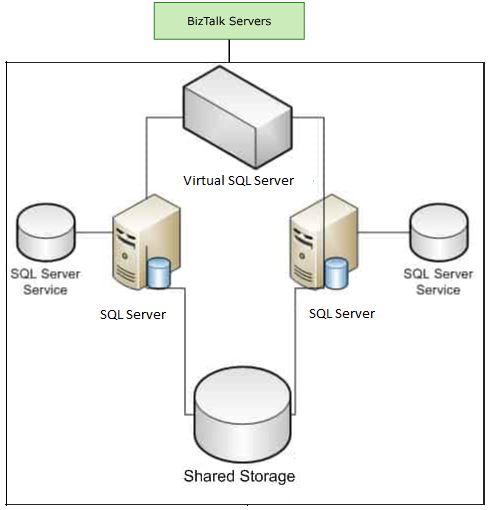
Windows Failover Clustering is a high-availability option which is designed to increase the uptime of SQL Server instances. A SQL Server cluster includes two or more physical servers, called nodes. One is identified as the active node, on which a SQL Server instance is running the production workload, and the other is a passive node, on which SQL Server is installed but not processing the workload. If the SQL Server instance on the active node fails, the passive node becomes the active node and begins to run the SQL Server production workload with some minimal failover downtime.
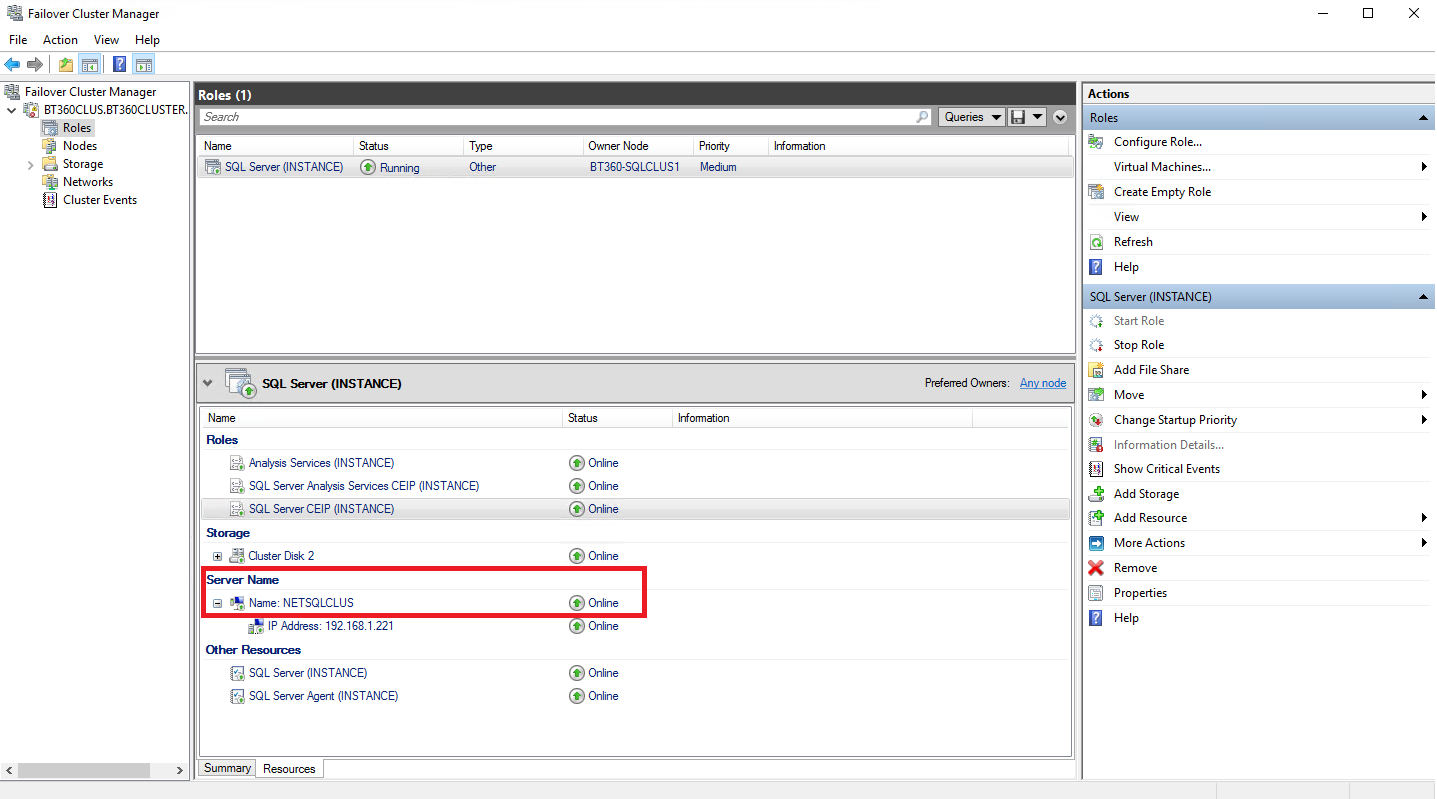
The SQL Server Network Name is used to identify a failover cluster (active node) on the network. This was known as the virtual SQL Server name.
The virtual SQL Server will automatically connect to the currently active node. You can find the SQL Server Network Name as below in the Failover Manager.
Prerequisites or Permissions required to monitor the Non-Clustered/Clustered SQL Server in BizTalk360
- MSDTC should be enabled in the BizTalk360 server and SQL Server. In the case of Clustered SQL Server, MSDTC should be enabled in all the SQL Servers which belong to the cluster. Follow the link to enable the MDTC.
- If BizTalk360 is installed using the service account, then the service account should get added to the Administrator group in the SQL Server node. In the case of a Clustered SQL Server, the service account should get added to both physical SQL Server Nodes(active & passive node).
How the (Non-Clustered) SQL Server is monitored in BizTalk360
Let’s have a detailed look at how you can monitor a non-clustered SQL server using BizTalk360.
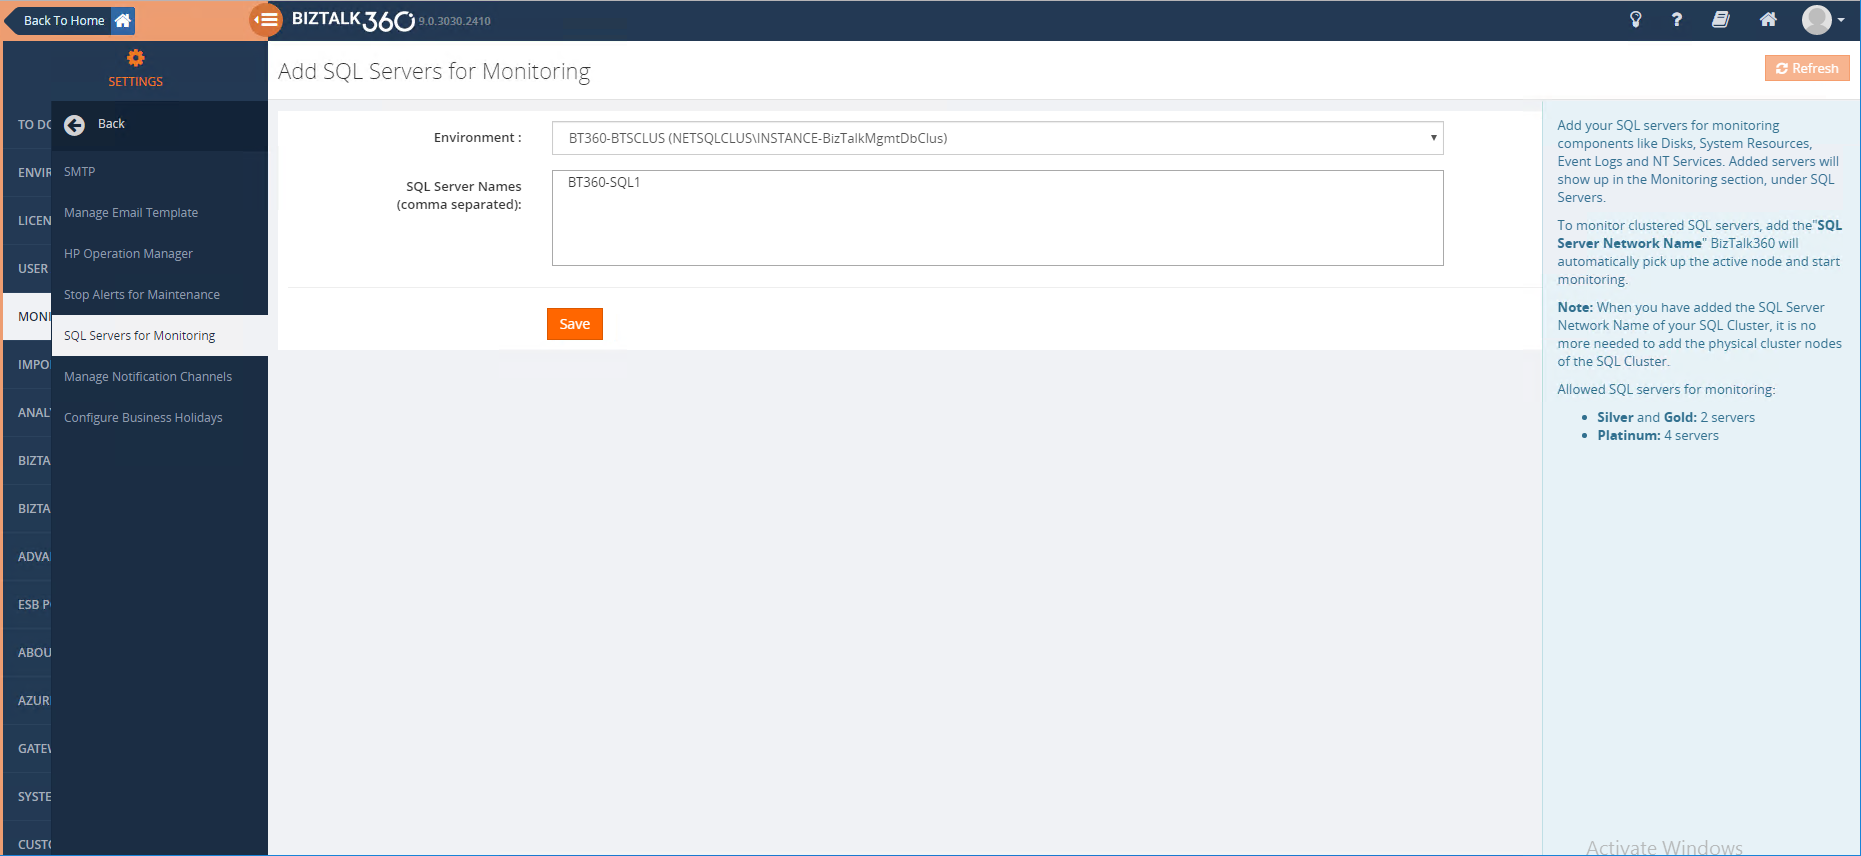
By adding the Physical SQL server name for Monitoring, you can monitor the disks, CPU, memory, etc. You can add the SQL Server name under BizTalk360->Settings ->Monitoring and Notification ->Add SQL Server for monitoring.
Note: For non-clustered SQL servers you must add the physical SQL Server name for monitoring.
Once the above configuration is done, the added SQL servers will get available for monitoring as below.
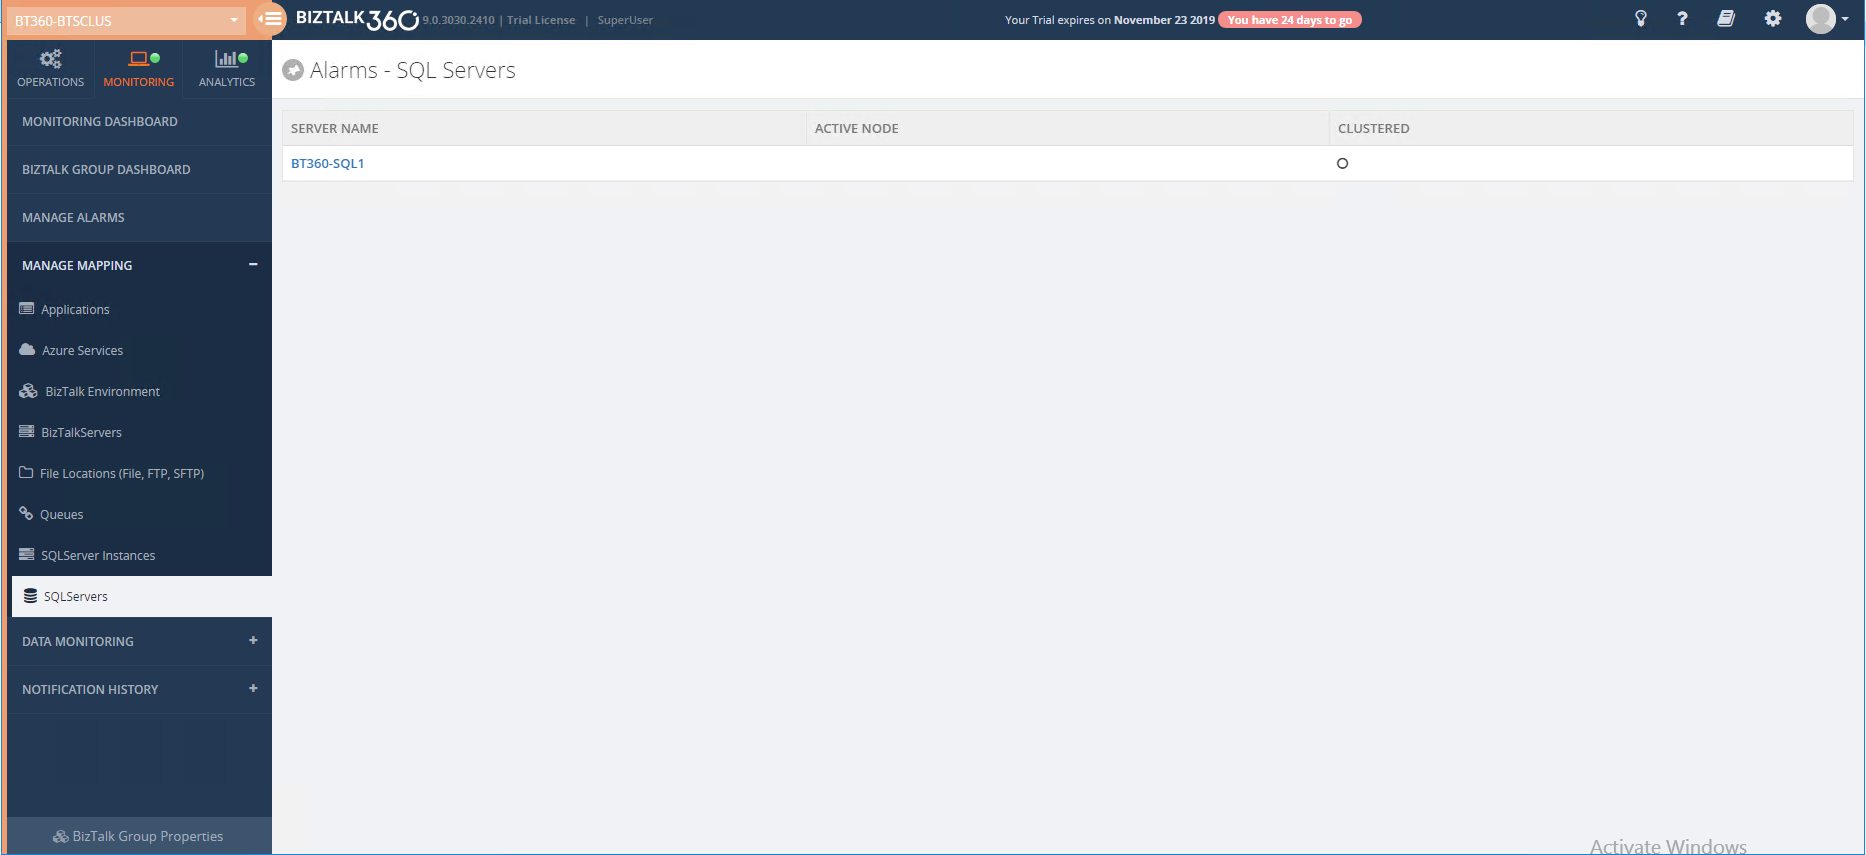
The configured server will be listed for monitoring under BizTalk360->Monitoring ->Manage Mapping->SQL Servers. By clicking on the Server name you can configure Disks, System Resources (CPU, memory), Event Logs and NT Services of the specific SQL server for monitoring.
Disk Monitoring
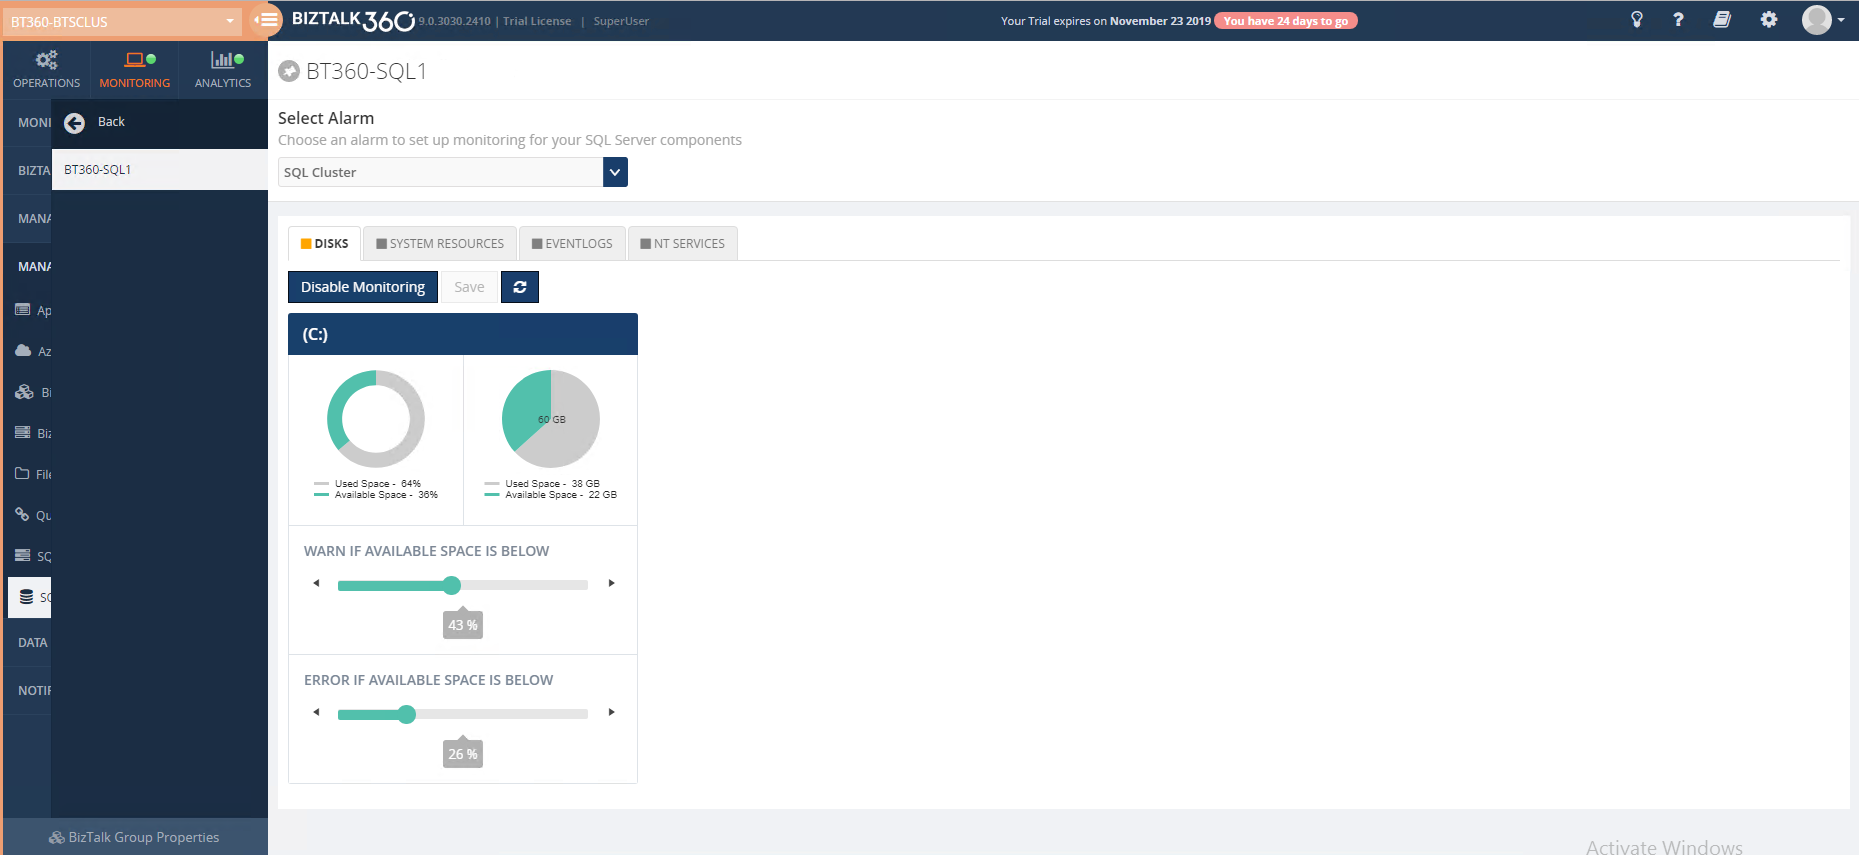
A click on the Disks tab, will automatically pick up all the disks in the configured SQL server and show a graphical view of the disk properties with total and available disk space. To monitor the disk, you can simply set the appropriate warning and error threshold level for each disk in percentage (%), as shown below. For more detailed information, follow the article link.
Note: The system reserved and the unpartitioned disk will not be available for monitoring.
System Resource Monitoring
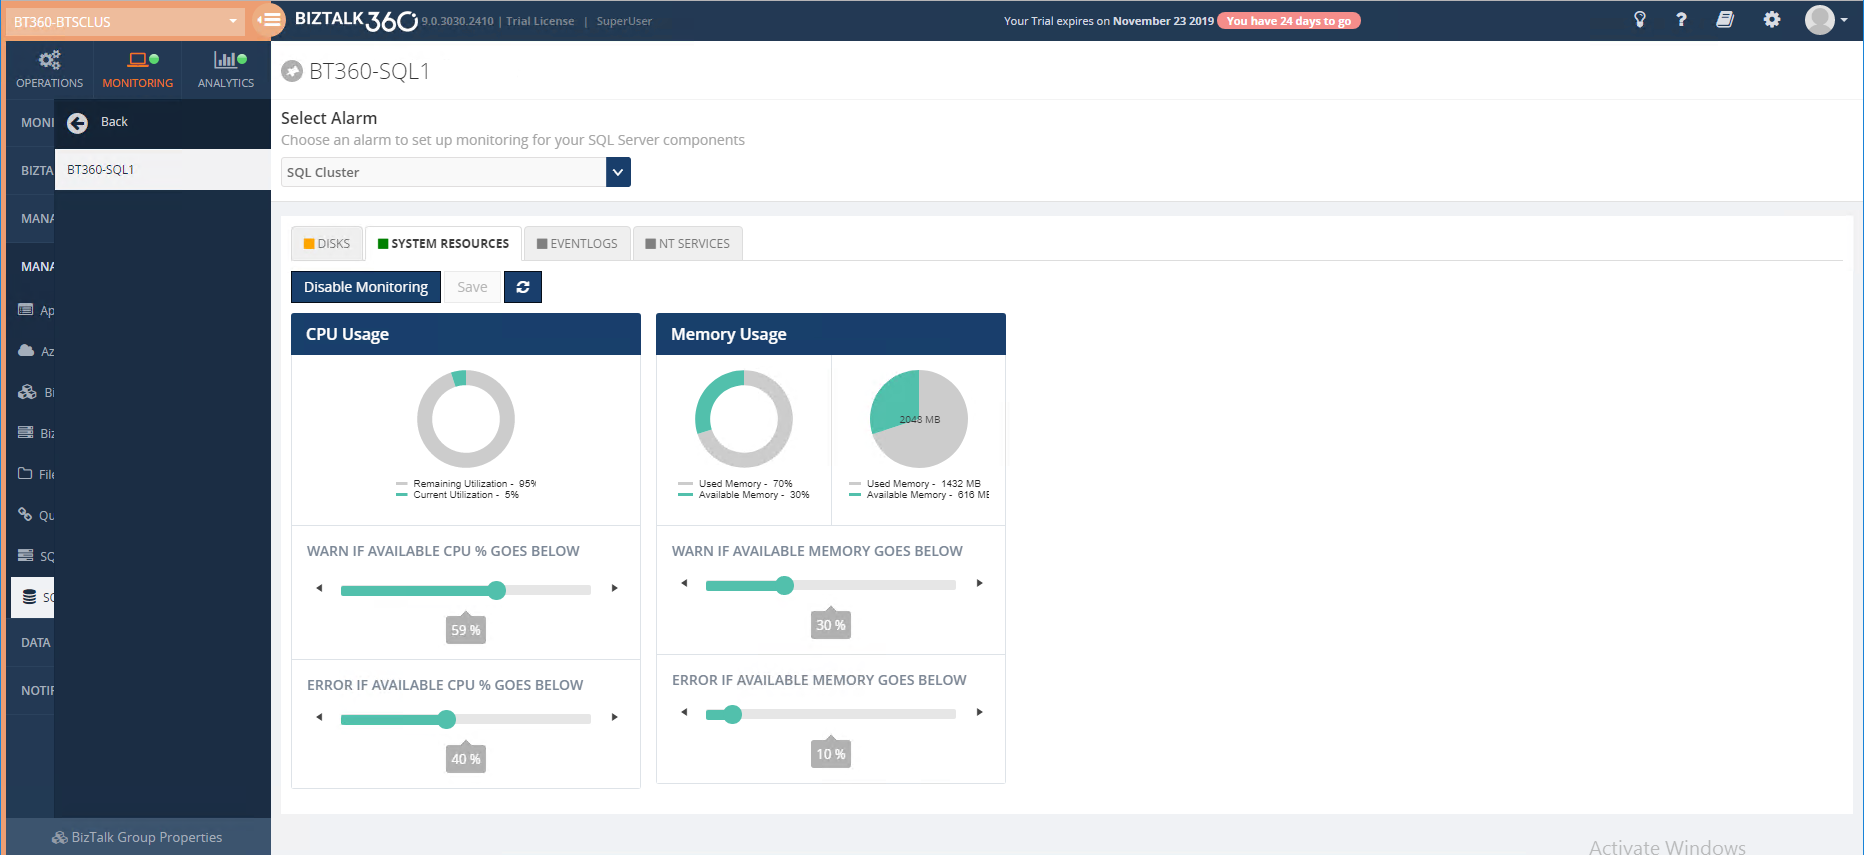
Click on the System resource tab to monitor the CPU usage and Memory consumption. Next, configure the appropriate warning and error thresholds for CPU and memory. The system will start alerting if the system condition hits the configured warning/error level for the persisted duration, which you can see below. For more detailed information about the CPU and Memory, follow the article link.
By default, warning and error thresholds for CPU and memory will be in 30% and 10%, but you are free to reconfigure these thresholds depending on your own requirements
Event Log Monitoring
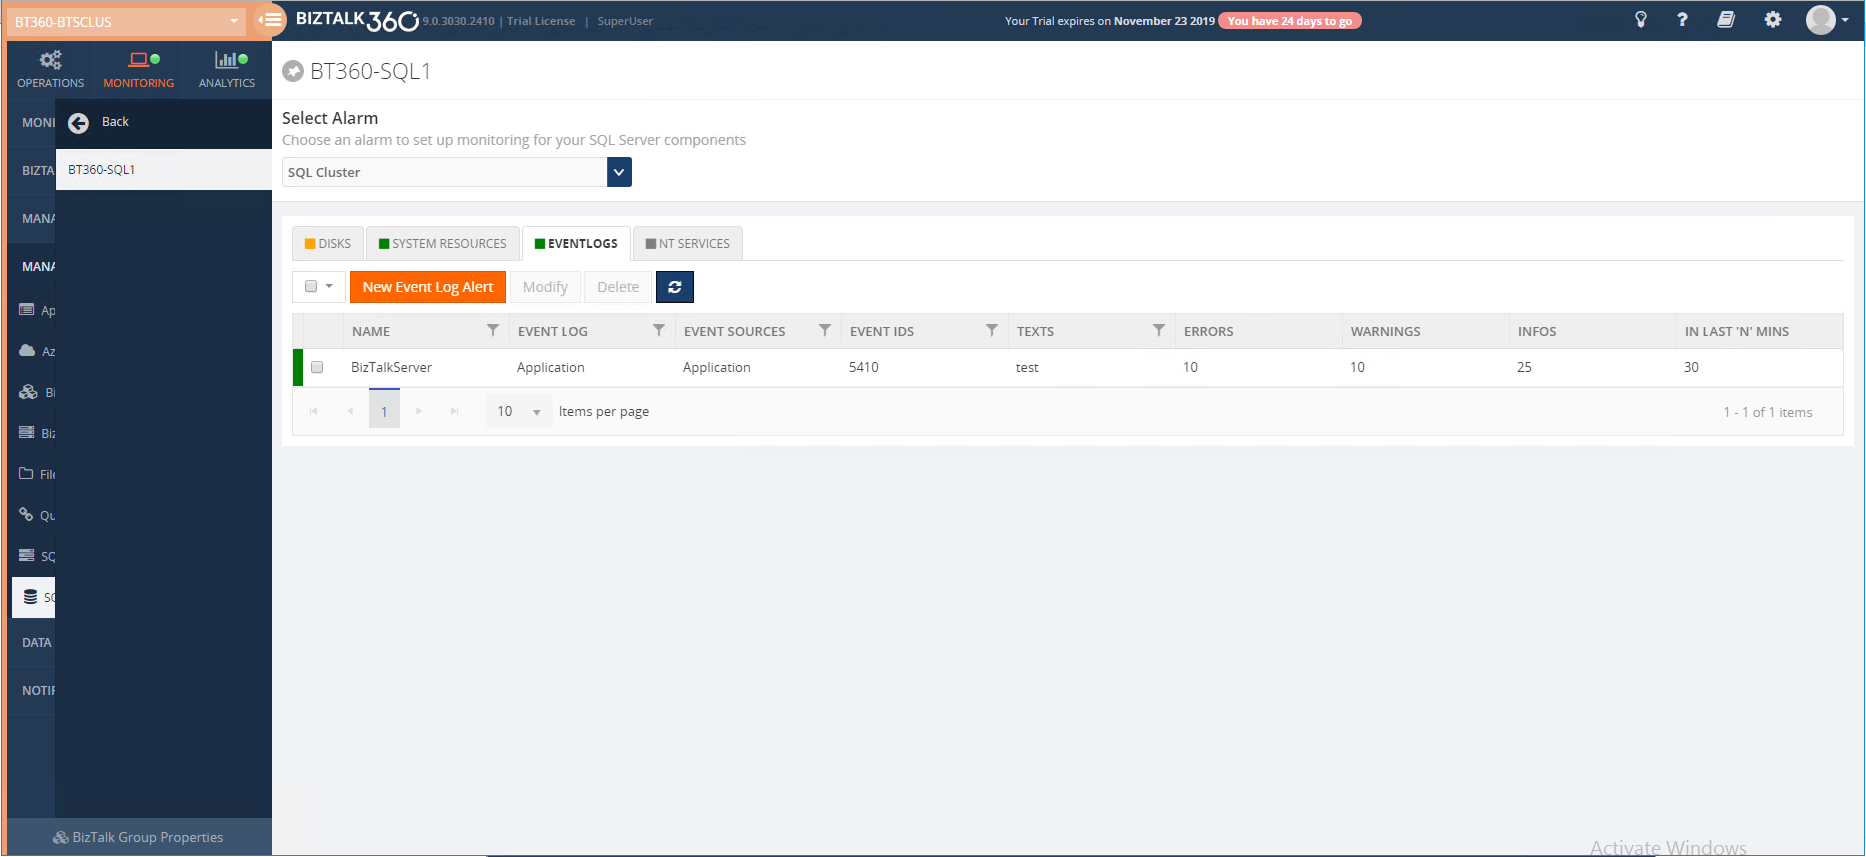
You can monitor for various event log entry conditions using BizTalk360. You can have multiple combinations of event log monitoring, for example, certain sources, certain event ids, certain text in the message, with configured threshold conditions as below.
Note that you can also set up Event Log monitoring in the Data Monitoring section. Setting it up there helps in correlating event log entries across multiple servers. For more detailed information about the Event Log monitoring, follow the article link.
NT Service Monitoring
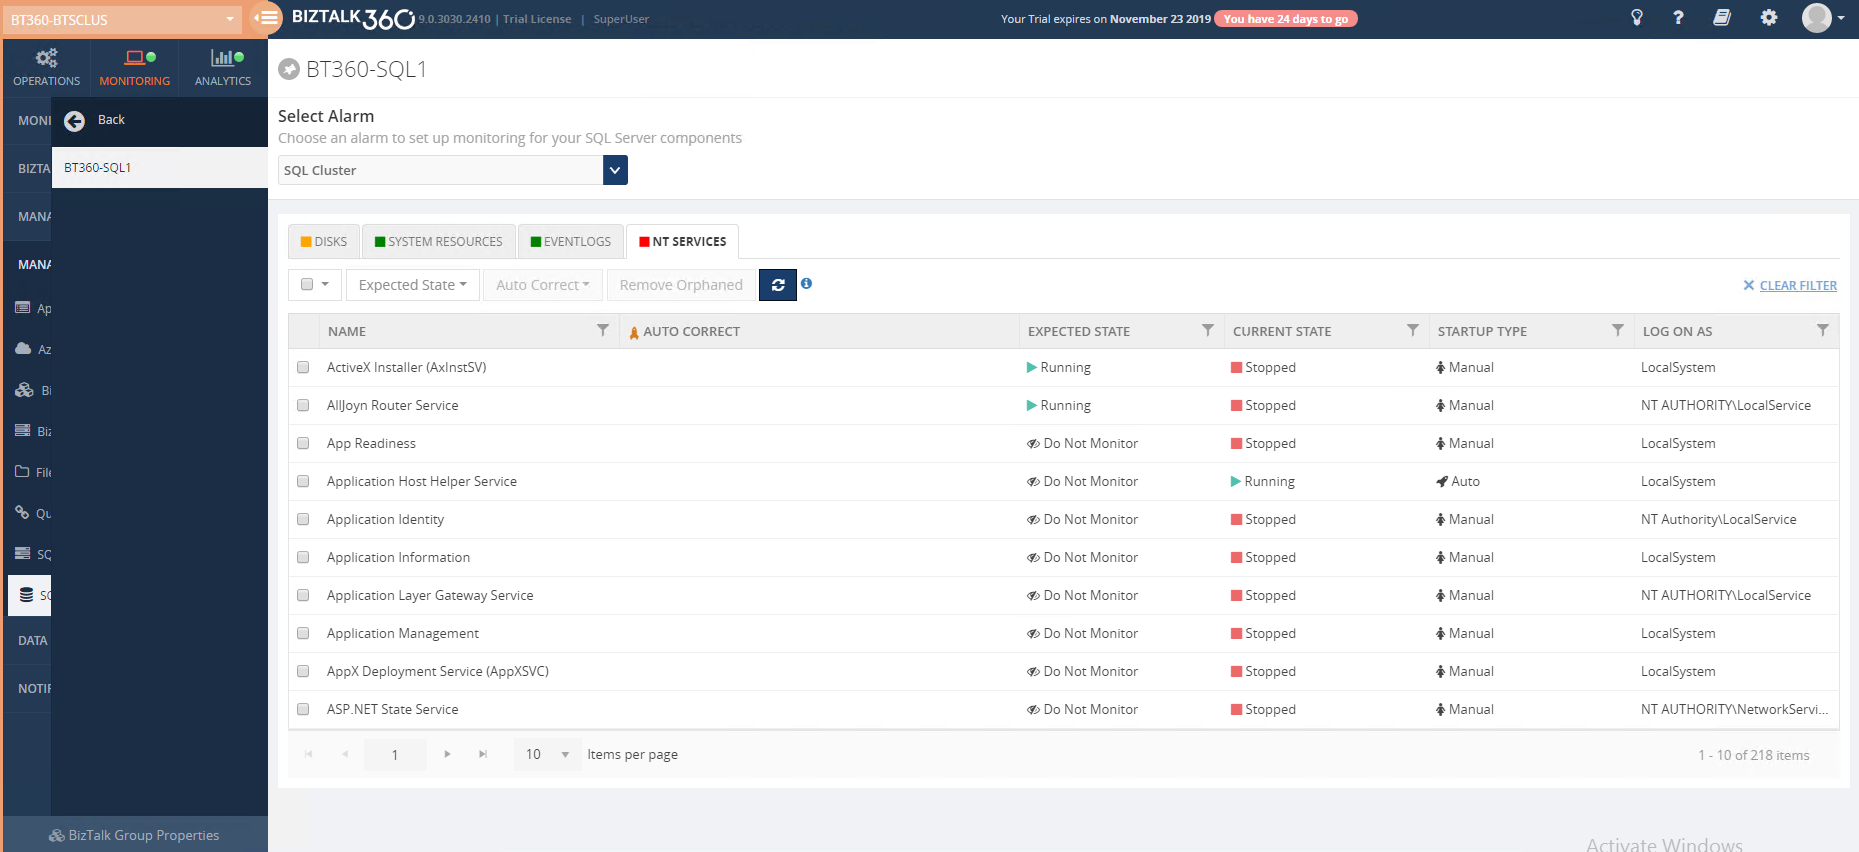
You may want to keep an eye on certain NT services that are running in SQL Server. BizTalk360 gives you the opportunity to automatically monitor the NT services by just setting the expected state. BizTalk360 will alert you when the configured expected state is not equal to the current state. For more detailed information about the NT Services monitoring, follow the article link.
How a SQL Clustered node is monitored in BizTalk360
Now, let us have a quick look at how we can use BizTalk360 to monitor a clustered SQL server.
Configuring a Cluster SQL Server for monitoring
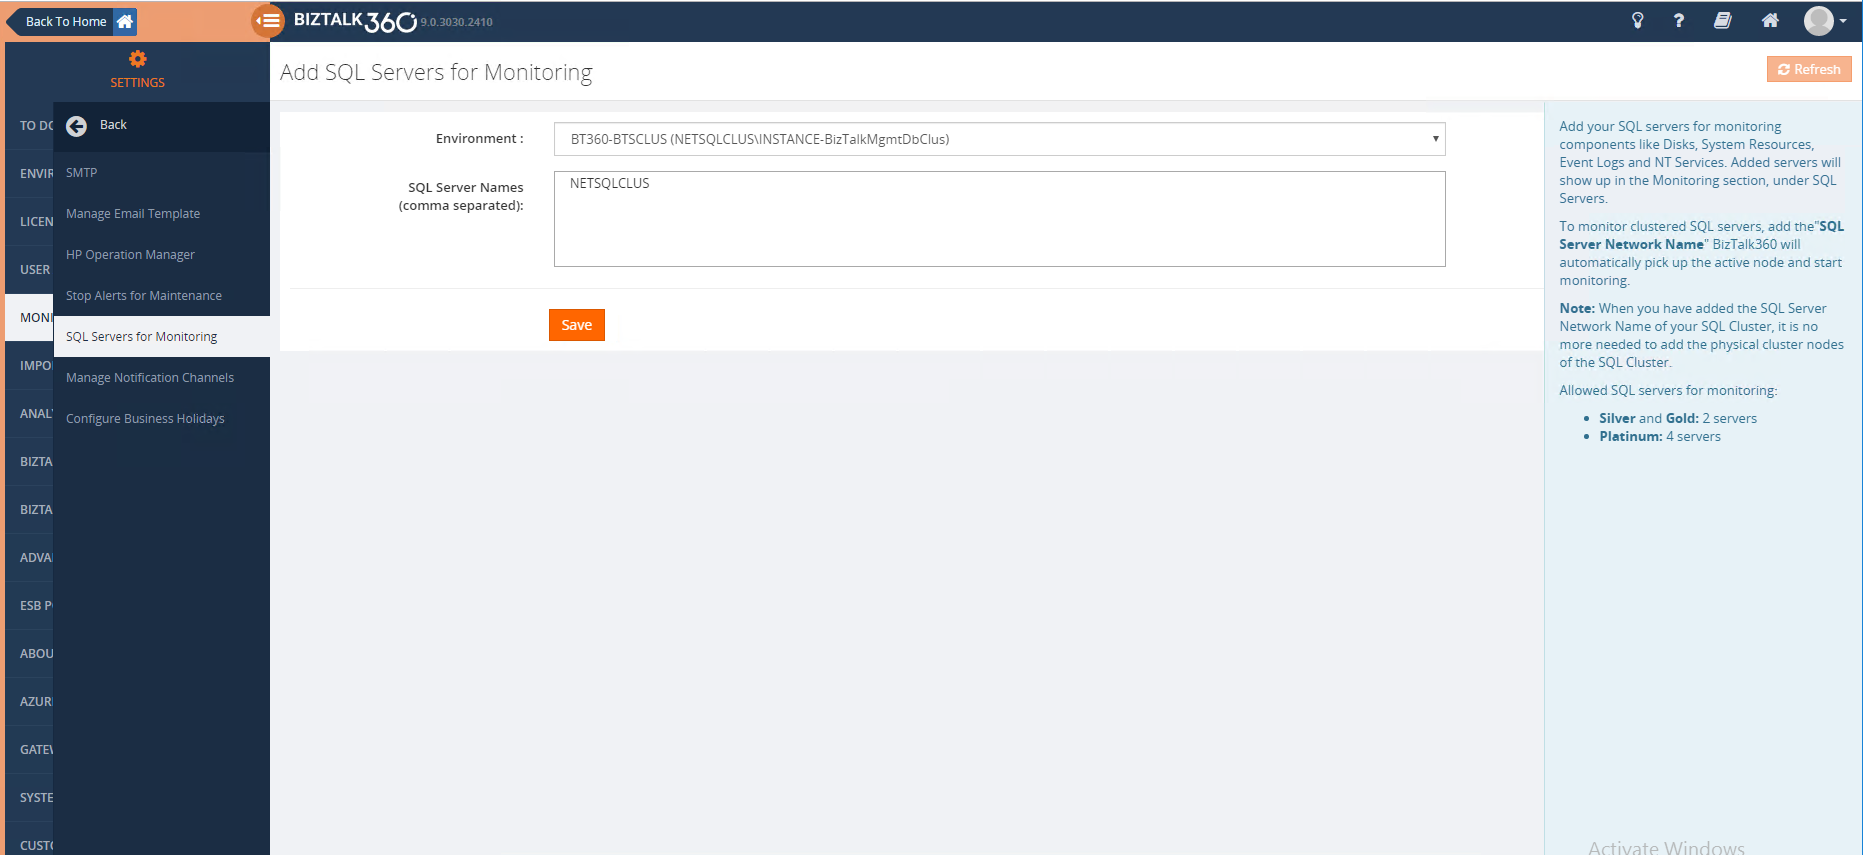
If you want to monitor a Clustered SQL Server, all you need to do is, specify the name of the Virtual SQL Server (SQL Server Network Name). When you connect to SQL Server using this SQL Server Network Name, BizTalk360 will automatically connect to the currently active node.
Note: It is is enough to add just the SQL Server Network Name for monitoring the SQL Cluster, it is not required to add the actual physical SQL cluster nodes.
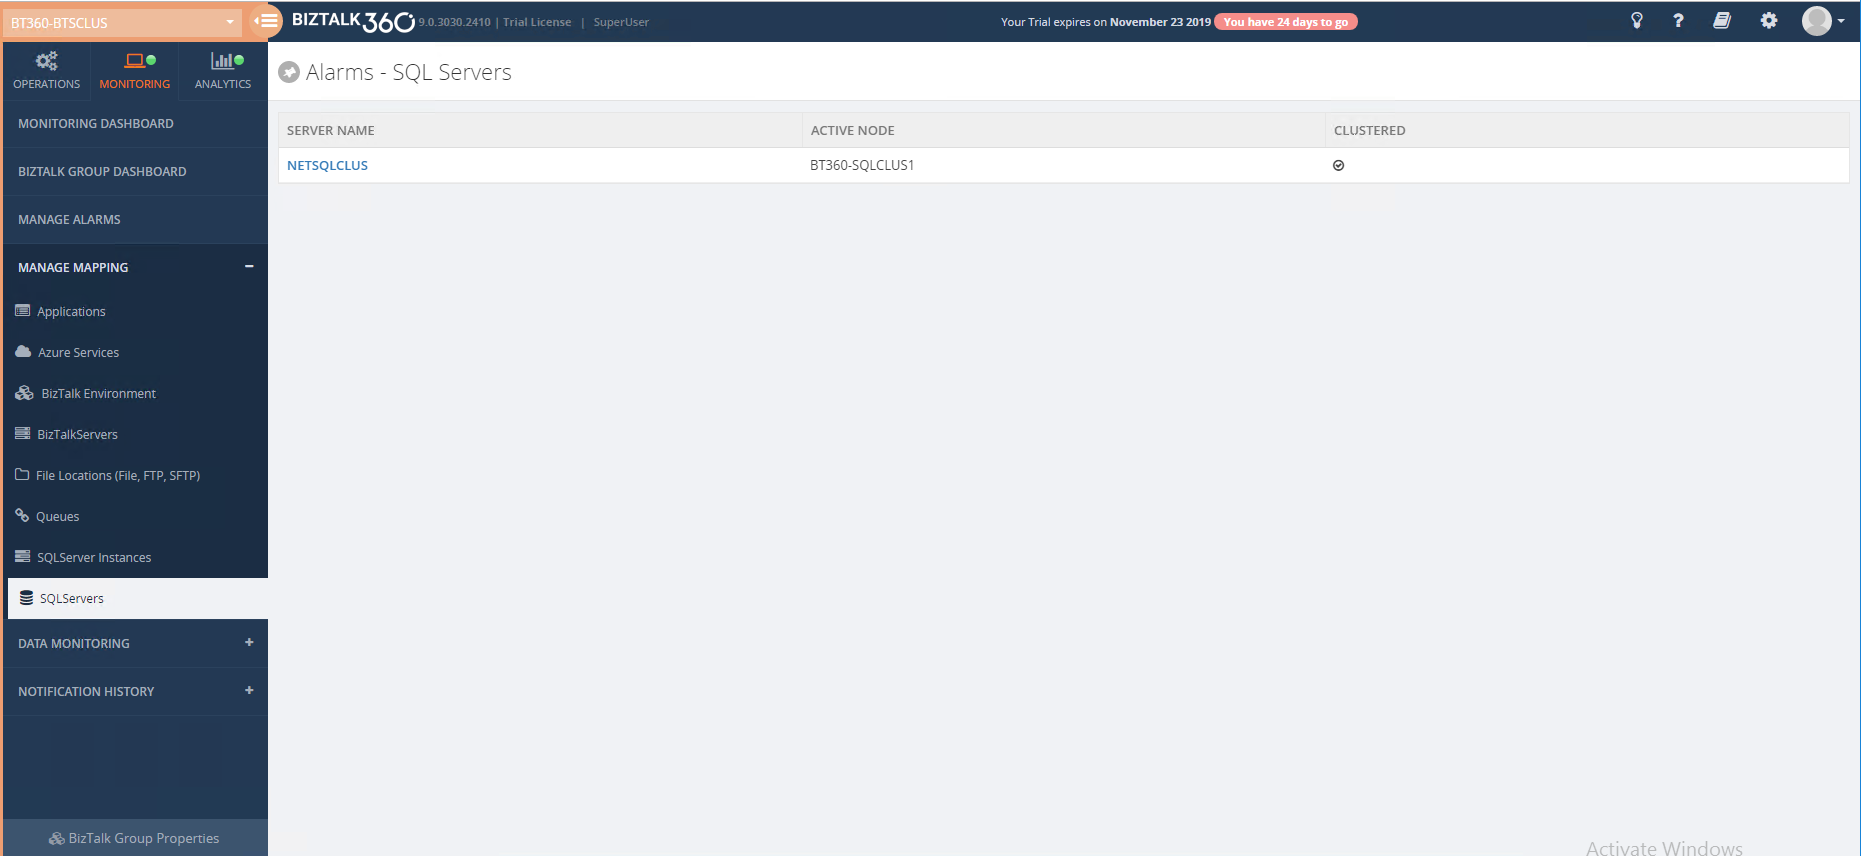
Once the above configuration is done, then the added clustered SQL Server Name will get listed for monitoring as shown below.
It will automatically pick the active node and the state of the (clustered) server.
Disk Monitoring
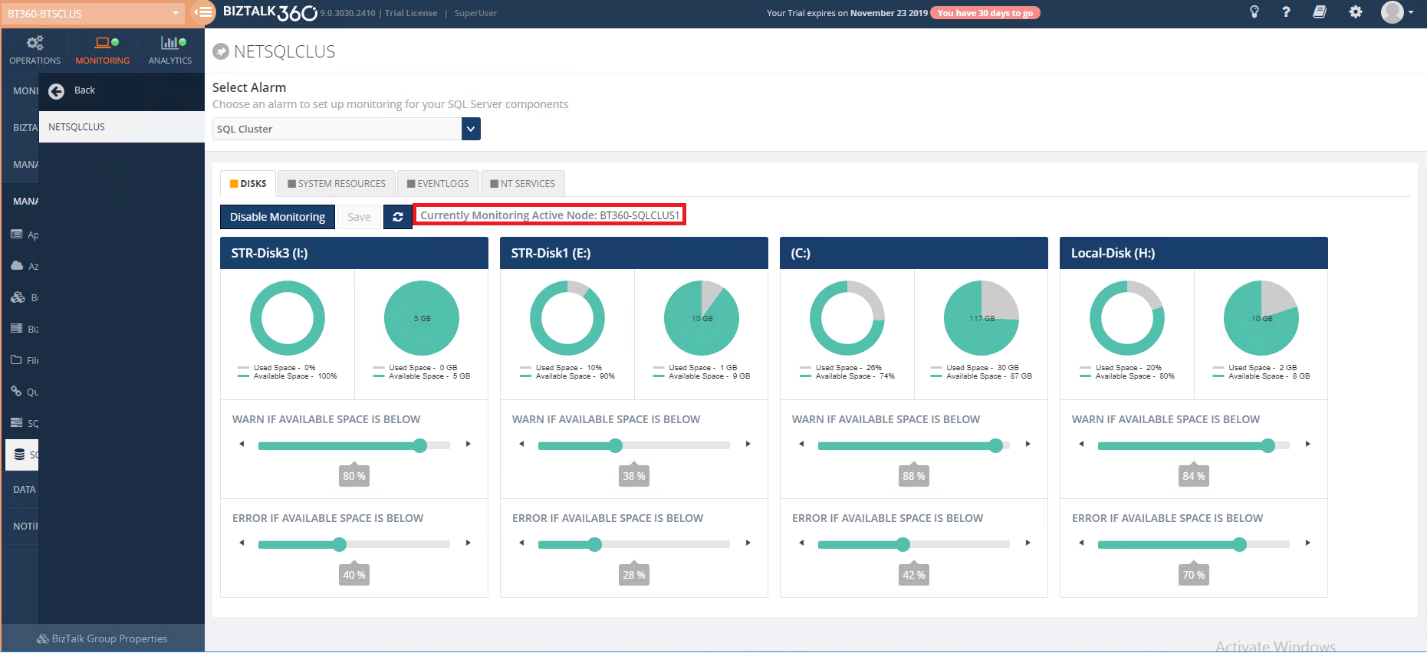
In clustered SQL Server monitoring, it will show the currently active monitoring Node, and also it will automatically pick up all the disks in the currently active node.
By Default, warning and error thresholds for each disk will be in 20% and 10%. You can also change the warning and error percentage as per your need and save it. Then, the currently active node will get monitored by the BizTalk360. If the disk space exceeds the set percentage, BizTalk360 will send the alert to the respective user.
If the “Failover” happens for the monitored disk, then the configured disk will automatically switch to the active server(Failover server).
Consider a scenario if Node 1 has disk A and disk B which are configured for monitoring (error and warning condition as 50 %). Let say, Node 1 went down, then BizTalk360 will automatically pick up the currently active node 2 for monitoring. But what happens if node 2 has Disk B and Disk C?
In the above scenario, the default monitoring configuration i.e error and warning condition 20% is set to the Disk C. Disk A, which is available in node 1 but not in node 2 will be moved to the orphaned state.
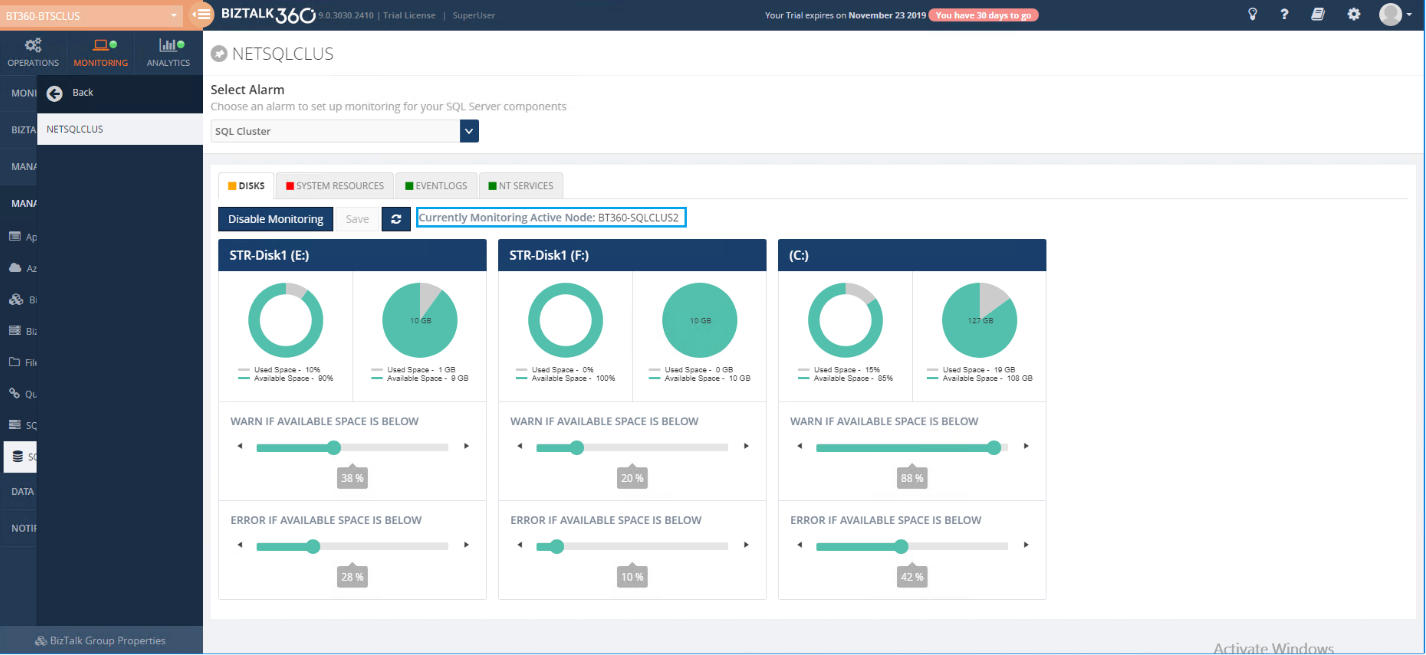
As in the above screenshot, the “STR-Disk1 (F:)” disk is newly added after failover with the default warning and error conditions. The other two disks are “STR-Disk2 (E:)”, which is a shared volume, and the (C:) drive is a common volume, which is also configured with the existing warning and error percentages.
System Resource Monitoring
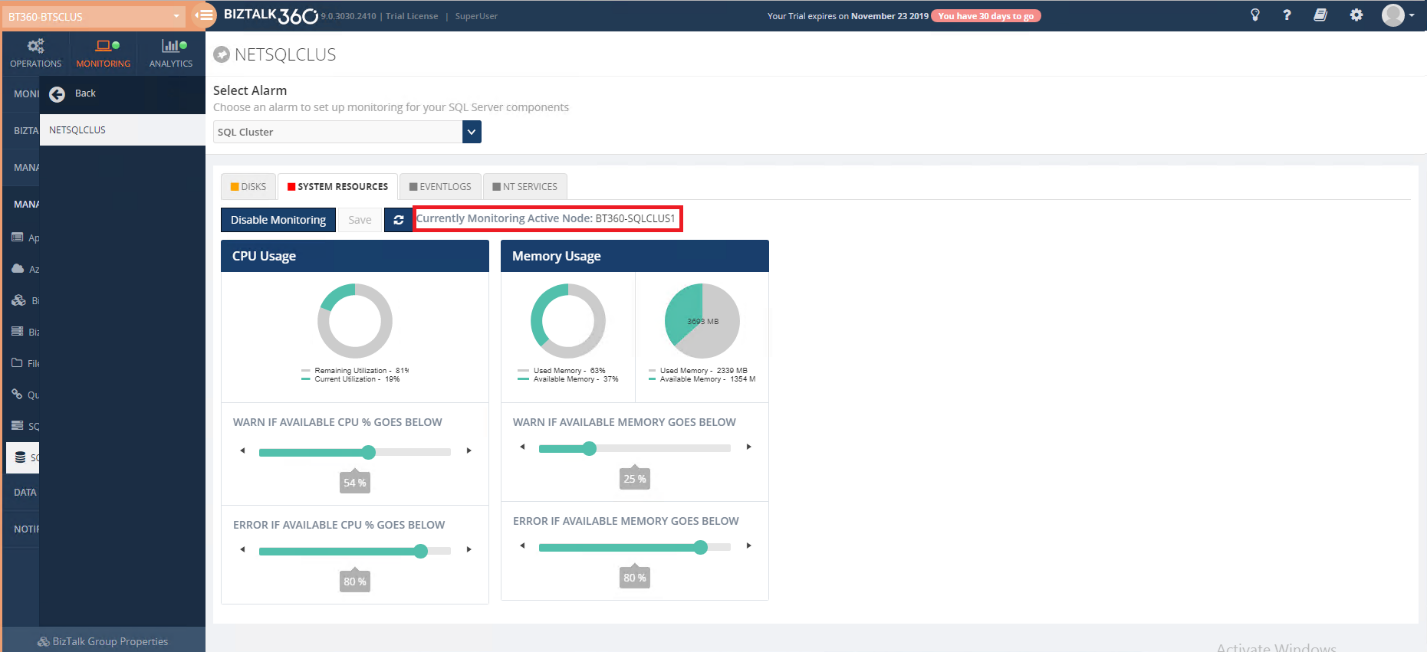
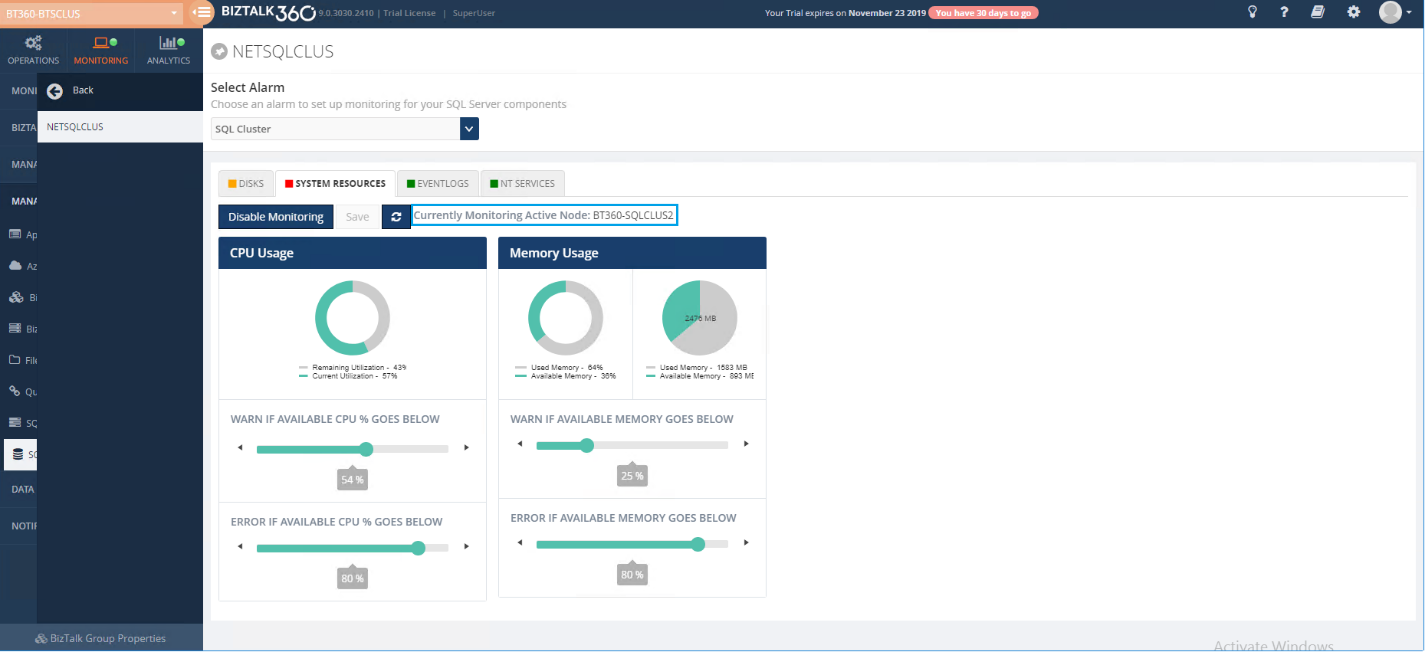
As the same as disk monitoring, you can set up appropriate warning and error thresholds for CPU and memory as per your business needs. For a Clustered SQL Server, it will show the current active monitoring Node. It will automatically pick up the CPU usage and the memory for the currently active node.
In the case of a Failover, the CPU and the memory will automatically get updated for the active node (failover node) with the existing warning and error conditions.
Event Log Monitoring
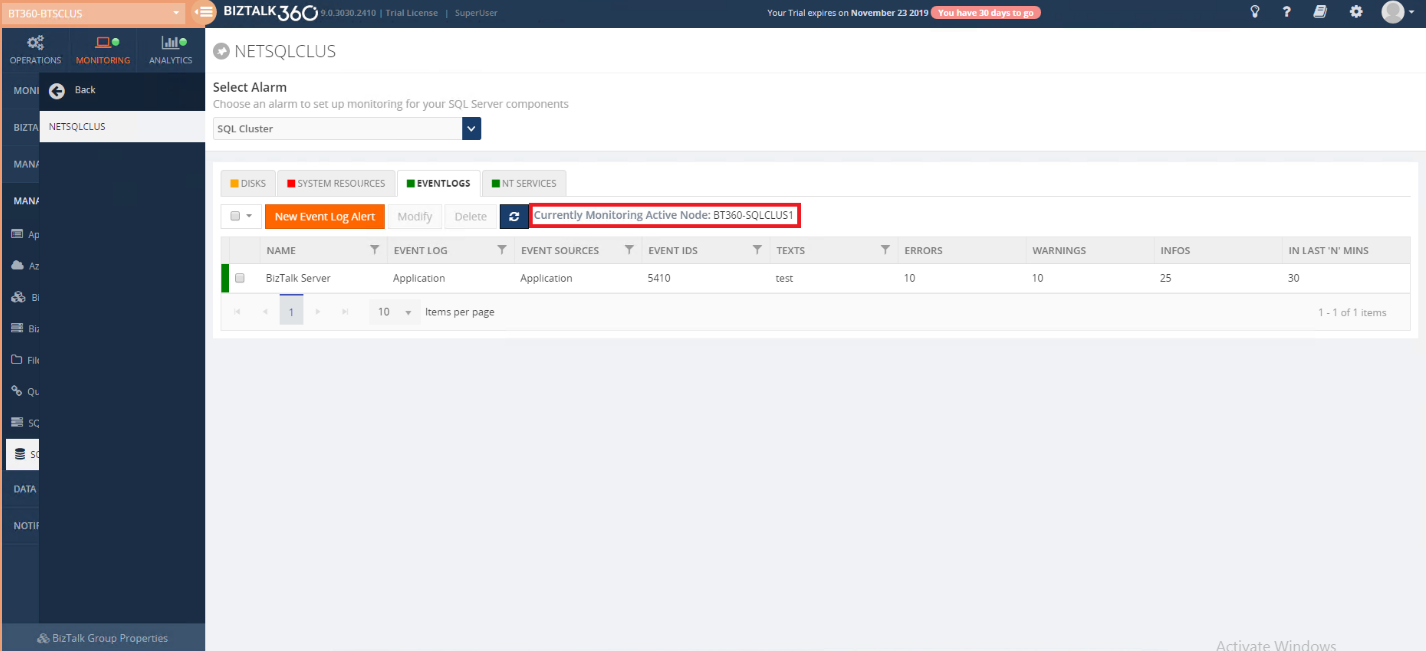
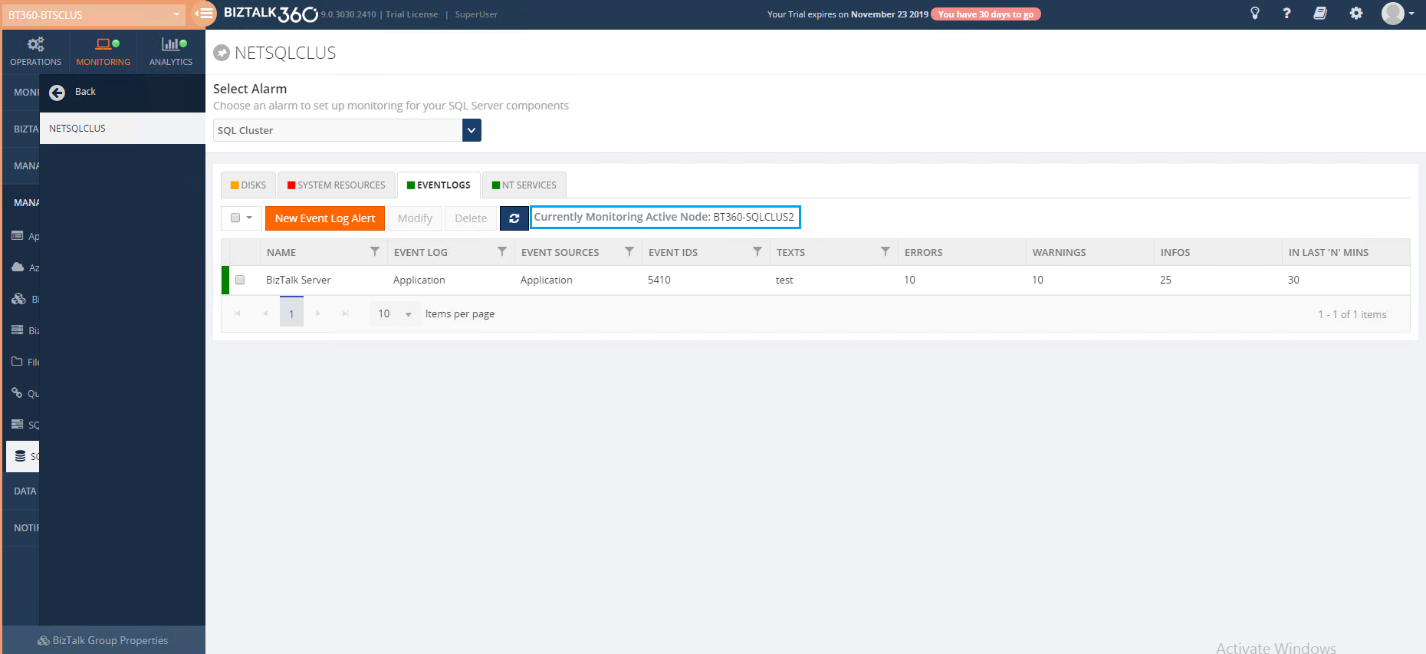
In a Clustered SQL Server, BizTalk360 monitors the Event Log based on the active node. You can have multiple combinations of event log monitoring, for example, certain sources, certain event ids, certain text in the message, with configured threshold conditions.
Once after Failover, then BizTalk360 automatically starts monitoring the existing event log conditions based on the currently active node (Failover node).
NT Service Monitoring
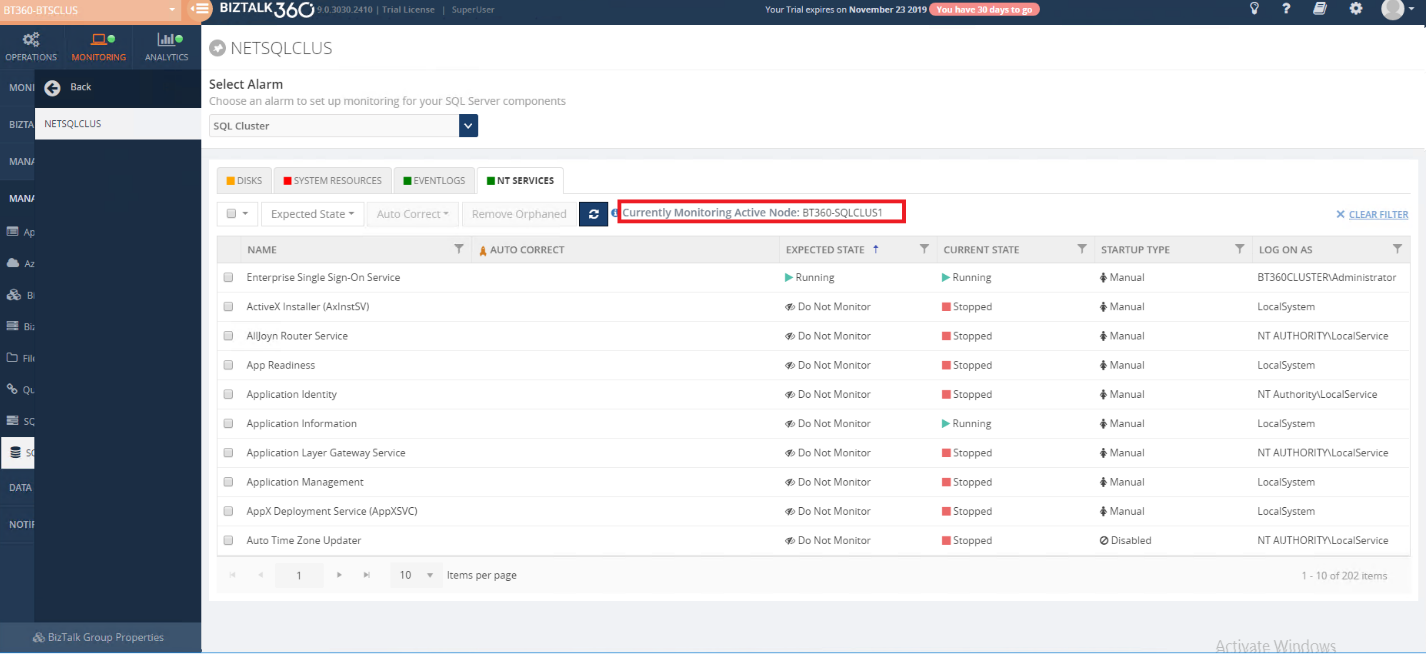
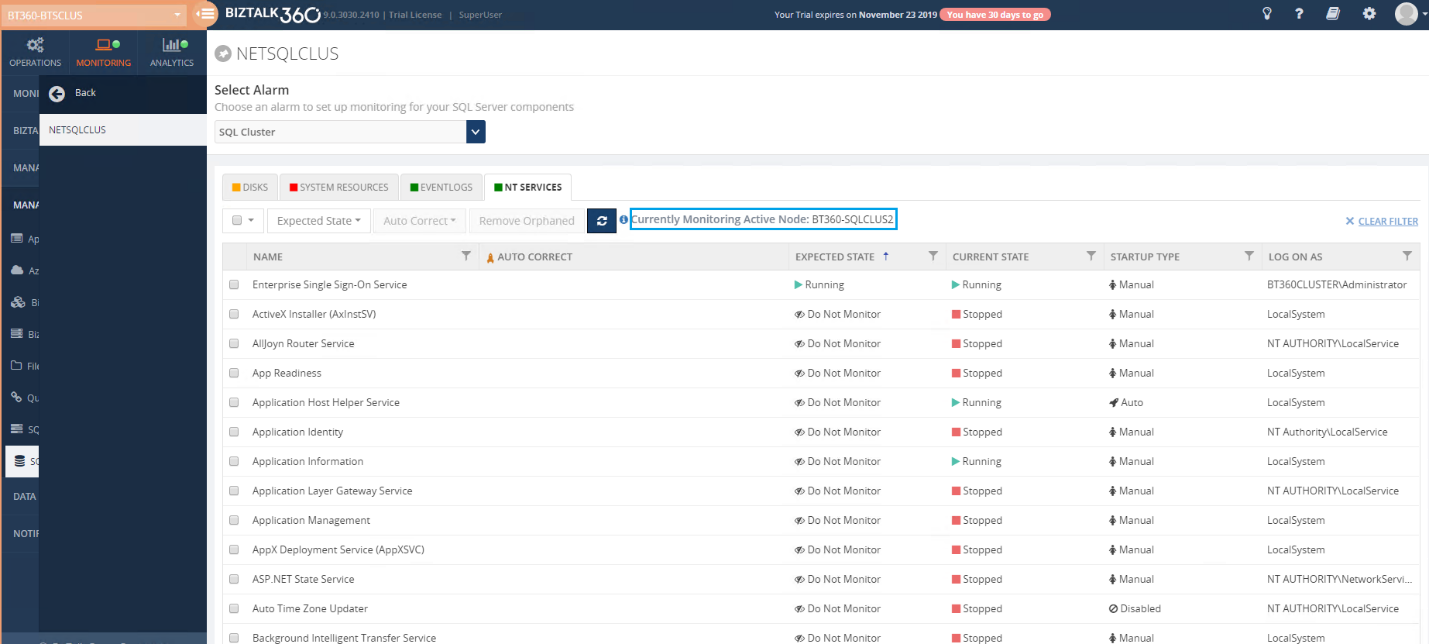
In a Clustered SQL Server, current monitoring will be based on the active server. It will pick up the NT services from the active server for monitoring as you can below.
Once after Failover, the configured NT service will automatically switch to the failover node and start monitoring.
Conclusion
Our objective with the monitoring aspect of BizTalk360 is to make it simple to configure, manage and use it on a day to day basis. The above SQL Server Monitoring will do that, and it will also do the automatic way of monitoring when a failover happens. There is plenty to consider when planning on clustering SQL Server, but we trust that we came up with the best solution. For any suggestion or feedback, post it in the feedback portal.
The post SQL Server Monitoring in BizTalk360 appeared first on BizTalk360.
