
by Saravana Kumar | Jan 15, 2018 | BizTalk Community Blogs via Syndication

BizTalk360 is pretty much a matured product now from its inception back in May 2011. Every year, we consistently released between 5 to 10 releases. In each release, we target anywhere from 3-5 good (useful) features and constant improvements, bug fixes, and usability enhancements. Over the last 6 years, we made 2 major/complete user interface revamp to give the product a face-lift in terms of user experience. First, when we moved the platform from Microsoft SilverLight to HTML5 (version 7.0) and the second when we revamped the complete user interface (version 8.0) to categorize the UI clearly into BizTalk Server Operations, Monitoring and Analytics sections.
Every feature we add to the product is carefully selected. We have clear objectives for each one of them. Before starting to work on a new feature, we ask the following questions like why are we building a particular feature, what problem we are trying to solve, and whether we can make BizTalk Server operations more streamlined/productive/secure.
In this new blog series “Why did we build XYZ feature in BizTalk360”, I wanted to explain clearly the reasoning behind each one of the core feature in the product, why we built it, what business problem it solves when it comes to running your BizTalk environment smoothly.
Here is the list of topics we are going to cover in this series. You can book mark this article, we will add links to each article as and when we publish the blog.
Operations
- Why did we build a web-based BizTalk Admin Console?
- Why did we build User Access Policy?
- Why did we build Auditing & Governance?
- Why did we build Advanced Event Viewer?
- Why did we build Custom SQL Queries?
- Why did we build Team Knowledgebase?
- Why did we build Operations Dashboard?
- Why did we build Search and Action on BizTalk Artifacts?
- Why did we build Advanced Tracking Manager?
- Why did we build Business Rules Composer?
- Why did we build ESB Management Portal?
- Why did we build EDI Dashboard?
- Why did we build Message Box Queries (MBV)/ BizTalk Health Monitor (BHM) Integration?
- Why did we build Graphical Message Flow viewer?
- Why did we build dedicated dashboard pages for BizTalk and SQL Servers?
- Why did we expose all of our internal REST API’s?
General BizTalk Server Monitoring
- Why did we build FTP/SFTP Monitoring?
- Why did we build MSMQ, IBM MQ, Azure Service Bus Queue Monitoring?
- Why did we build Web Endpoints Monitoring?
- Why did we build Database SQL Queries Monitoring?
- Why did we build Message Box Queries (MBV)/ BizTalk Health Monitor (BHM) Monitoring?
- Why did we build Azure Logic Apps Monitoring?
- Why did we build Azure API Apps Monitoring?
- Why did we build Receive Locations, Send Ports and Orchestrations Monitoring?
- Why did we build CPU, Memory and Disk Monitoring on BizTalk and SQL Servers?
- Why did we build BizTalk Host Instances Monitoring?
- Why did we build Auto Healing capability in Monitoring?
- Why did we build Windows Event Log Monitoring?
- Why did we build Window NT Service Monitoring?
- Why did we build Export and Import capability for Monitoring Configuration?
- Why did we build SQL Jobs Monitoring?
- Why did we build Notification History capability for BizTalk Monitoring?
- Why did we build Custom Notification Channels in Monitoring?
- Why did we build Webhook Channel out of the box?
- Why did we build ServiceNow Integration out of the box?
- Why did we build Slack Integration out of the box?
Data/Transaction Monitoring in BizTalk Server
- Why did we build Data Monitoring for Receive Locations and Send Ports?
- Why did we build Data Monitoring for BizTalk Message Box Data?
- Why did we build Data Monitoring for BizTalk Tracking Data?
- Why did we build Data Monitoring for BizTalk EDI Data?
- Why did we build Data Monitoring for BizTalk Business Activity Monitoring Data?
- Why did we build Data Monitoring for Azure Logic Apps Data?
- Why did we build a dedicated Transaction/Process Monitoring Dashboard?
Analytics
- Why did we build Analytics Dashboard?
- Why did we build Messaging Patterns Visualizer?
- Why did we build Throttling Analyser?
- Why did we build New Relic Integration?
Author: Saravana Kumar
Saravana Kumar is the Founder and CTO of BizTalk360, an enterprise software that acts as an all-in-one solution for better administration, operation, support and monitoring of Microsoft BizTalk Server environments.
View all posts by Saravana Kumar
by Sriram Hariharan | Jan 3, 2018 | BizTalk Community Blogs via Syndication
In 2017, we released 4 major releases and 3 patch releases of BizTalk360 with various new capabilities, usability improvements and bug fixes. We wanted to summarize the 15 best features we released in 2017 in this blog
1. EDI Capabilities
We enhanced the Electronic Data Interchange (EDI) capabilities of BizTalk360 with new features such as —
- EDI Reporting Manager
- EDI Reporting Dashboard
- EDI Functional Acknowledgement Status
EDI Reporting Manager
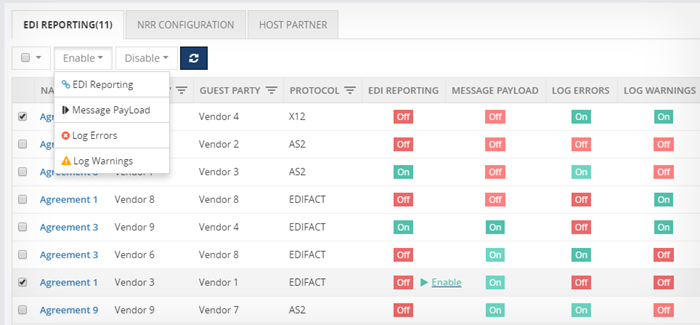
With the EDI reporting manager capability, you can turn on/off reporting for each agreement in a single click. This becomes a very tedious process when performed using the BizTalk Administration Console (BAC), especially when there are multiple EDI parties and agreements. Users can also perform bulk enable/disable operations on the NRR configuration. Administrators have the option of adding the Host Partner information that is required to configure the host party for NRR configurations.
EDI Reporting Dashboard
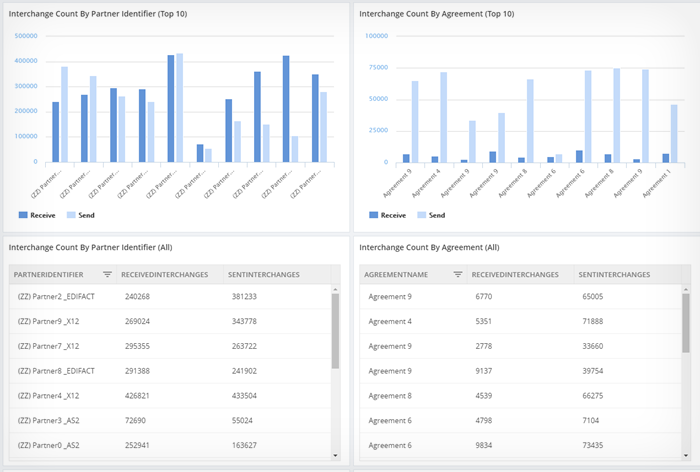
We added a rich out-of-the-box EDI dashboard that will aggregate the different EDI transactions to help business users to visualize the EDI data in a better way. The different widgets available in the EDI Reporting Dashboard are EDI Interchange Aggregation widgets, EDI Transaction Set aggregation widgets, AS2 messaging aggregation reports.
We also added few new aggregations (as widgets) that are not available in the BizTalk Administration Console such as Interchange Count by Agreement Name (Top 10), Interchange count by Partner Name (Top 10), Transaction count by ACK Status (Filtered by partner id), AS2 messaging aggregation reports.
EDI Functional Acknowledgement Status
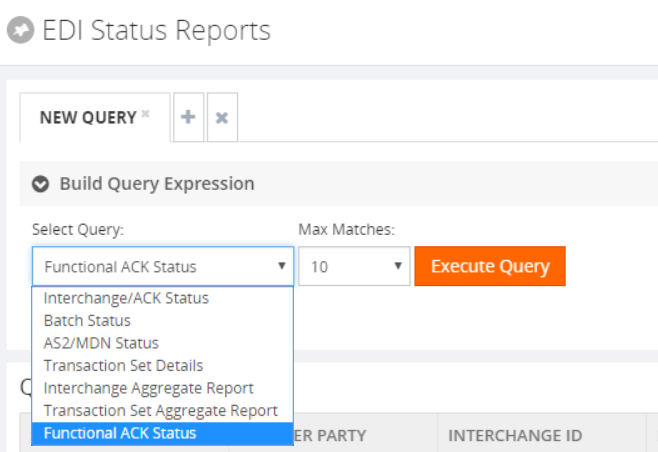
In any common B2B scenario, when a message is sent from the source to destination, an ACK will be sent back to the source with the status of the message (say, a technical acknowledgment TA1 or 997 functional ACK). Say, a message is sent from source to destination and the TA1 ACK is successfully received, but the 997 functional ACK is not received. With BizTalk Administration Console, it is not easy to identify the reason why the 997 functional ACK was not received by the sender. BizTalk360 brings in the capability to allow administrators to easily view the status of functional ACK within the UI and set up data monitoring alerts to get notified of negative functional ACKs.


2. ESB Dashboard
We added a new ESB Dashboard that will allow users to aggregate ESB reports into a single graphical dashboard. There are total 13 widgets that will help users understand their ESB integrations and to better analyse the data to improve performance. The widgets are categorized into 3 groups — Fault code widgets (based on application, service or error type), Fault code over time widgets, Itinerary Widgets.
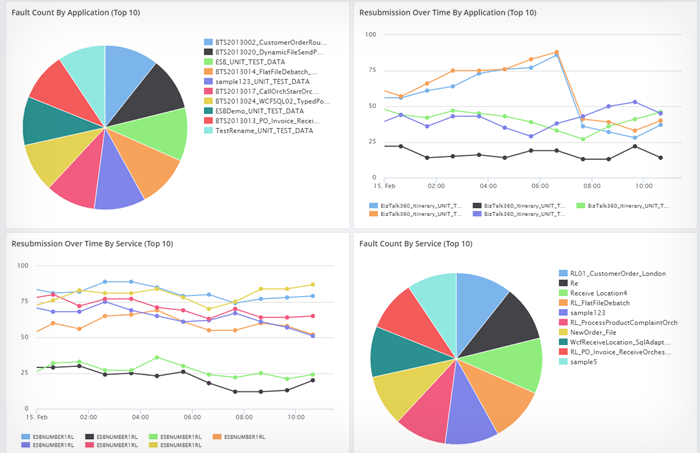
3. Notification Channels (Webhook, Microsoft Teams)
We added two new notification channels — Webhook and Microsoft Teams in addition to the existing notification channels such as Email, HP Operations Manager, Slack, ServiceNow. The new webhook notification channel allows you to send structured alert notifications (JSON format) to any REST endpoints whenever there is a monitoring violation.
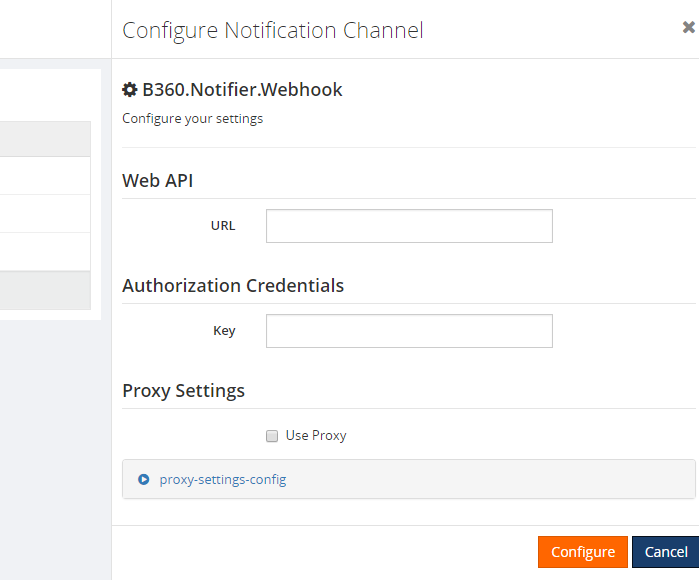
Additionally, users can now connect a Microsoft Teams channel to their respective BizTalk360 alarms with the proper Webhook URL and receive alert notifications directly to their Teams channel.
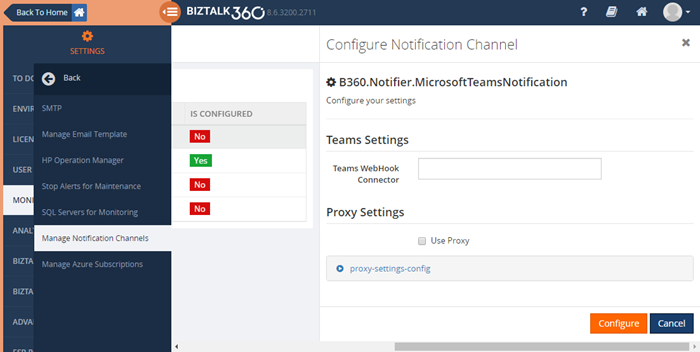
4. Azure Logic Apps (Operations, Data Monitoring)
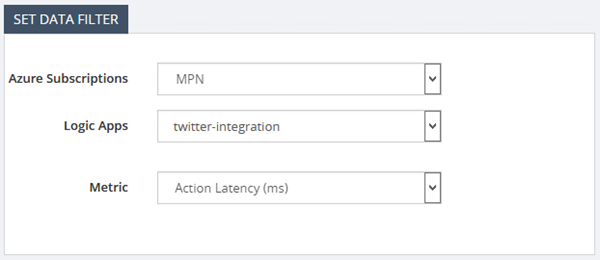
We brought in the capability into BizTalk360 to be able to manage and monitor the Azure Logic Apps. Therefore, if you are using only the Logic Apps offering from Azure, you need not switch to Azure Portal to manage your Logic App. You can perform all operations on the Logic App such as Enable, Disable, Run Trigger, and Delete. The Trigger history and Run history details are available in both graphical and grid view.
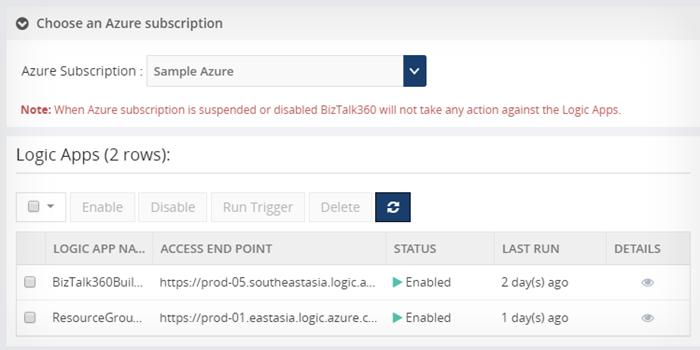
In addition to Logic App Operational capabilities, users can configure Data monitoring to monitor and trigger alerts based on historical events.
5. IBM MQ Monitoring
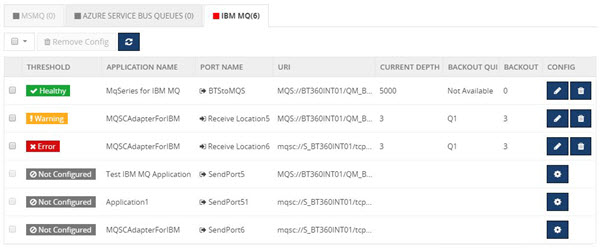
In addition to MSMQ and Azure Service Bus Queue monitoring capabilities, we added the IBM MQ monitoring capability. IBM MQ monitoring supports both MQSC and MQS based configurations; you can monitor for the following 4 parameters – queue depth, backout queue depth, queue usage percentage and backout queue percentage.
6. Folder Monitoring, FTP/FTPS/SFTP Monitoring
With BizTalk360, we wanted to make monitoring of BizTalk resources very seamless in order to differentiate BizTalk360 from other general purpose monitoring solutions. We introduced the capability of Folder monitoring where users get to view all the configured receive locations and send ports that make use of the FILE Adapter and configure monitoring on those specific folders.
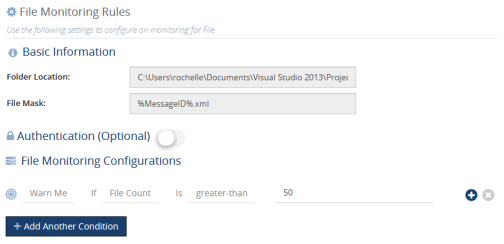
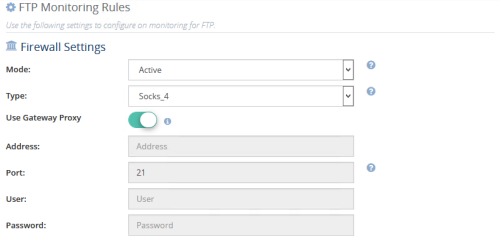
Similar to Folder monitoring, BizTalk360 also supports the monitoring of FTP, FTPS and SFTP adapters. The main purpose of configuring monitoring of these adapters is to monitor for data pile up!
7. Infrastructure Settings – New Additions
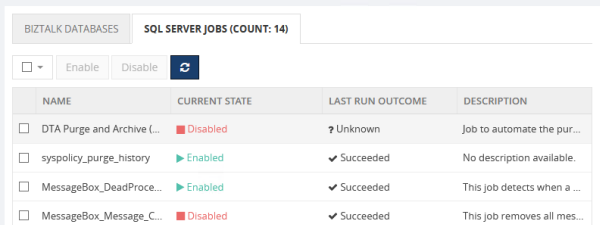
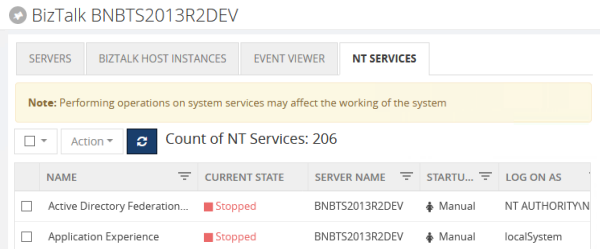
We added new options to the Infrastructure Settings — BizTalk and SQL NT Services and SQL Server Jobs. Users can perform operations like Start, Stop, Restart, Pause and Resume on the BizTalk and SQL NT Services. Similarly, users can manage SQL Server Jobs (start and stop SQL jobs) in BizTalk360.
8. BizTalk Server Licensing Information Widget
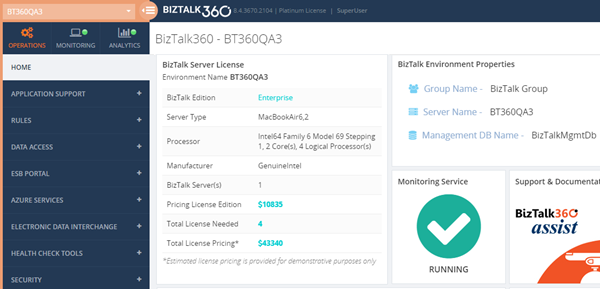
We added a new widget on the Home Dashboard screen that will display key information of the BizTalk server such as BizTalk edition, Server type, Processor, Manufacturer, Number of BizTalk Servers, Total number of license needed and estimated pricing.
For more details about BizTalk Server Licensing, please refer this blog article.
9. BizTalk Health Monitor Integration
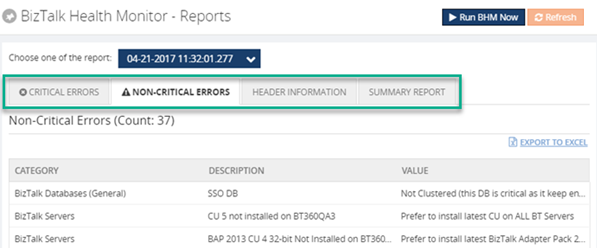
BizTalk360 now supports BizTalk Health Monitor (BHM), previously known as Message Box Viewer (MBV). For many years, we had support for Message Box Viewer where we periodically run MBV in configured environments, parse and store the result and display it in the BizTalk360 web console.
10. BizTalk Server Host Throttling Monitoring & Availability Monitoring
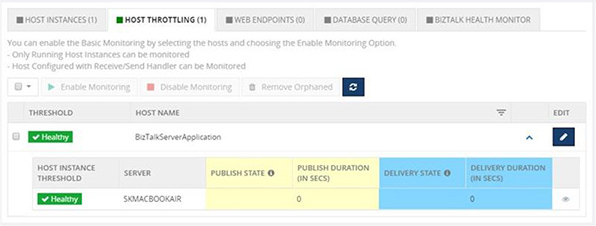
The ability to monitor throttling is not something new in BizTalk360. With Throttling Analyser, you can easily identify when your BizTalk environment is throttling and in what particular state. With the new host throttling capability, you can visualize and get alerted whenever your BizTalk environment is in the throttling state.
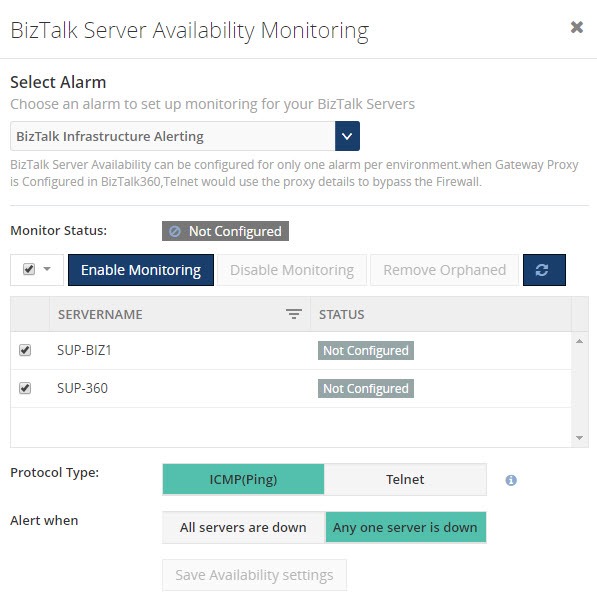
In addition to host throttling monitoring, we also added the capability to monitor the availability of your BizTalk server, say, all your BizTalk servers are up and running. If something goes wrong with one of your BizTalk server, you will automatically get notified about this through the notification channel.
11. Email Template
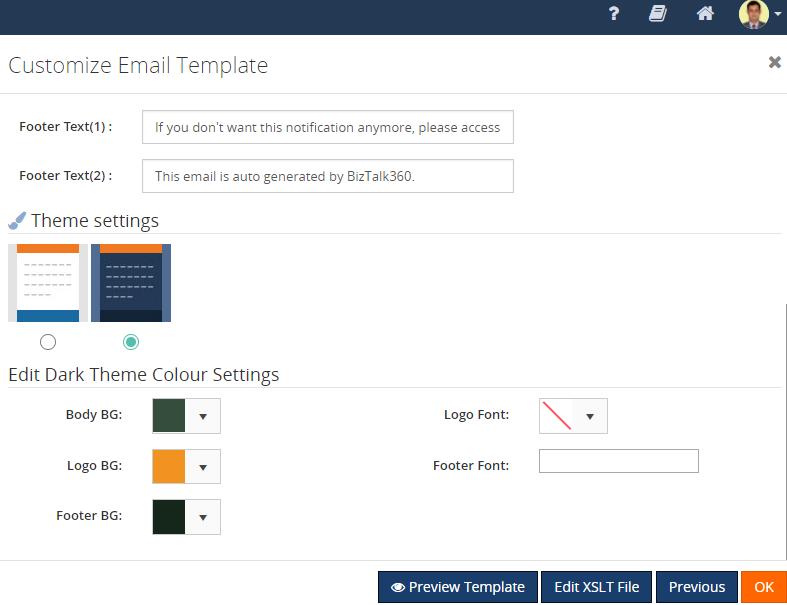
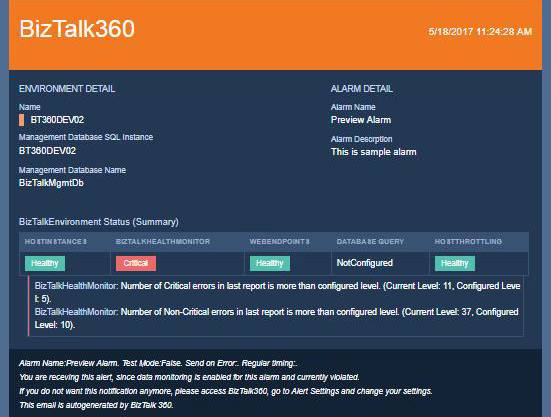
You can now set up different email templates for different alarms — customize the colour of the email body, font, logo, background, footer background etc. You also have the option to create an email template with an in-built XSLT validator with preview options. We have provided an option for you to choose the notification template in a light/dark theme.
12. Azure Integration Account
In an effort to support Hybrid Integration, we have integrated Azure Integration Account within BizTalk360. This allows users to access Maps, Schemas, Certificates, Parties and Agreements stored in Azure Integration account in configured Azure subscriptions all withing BizTalk360 instead of logging into the Azure portal.
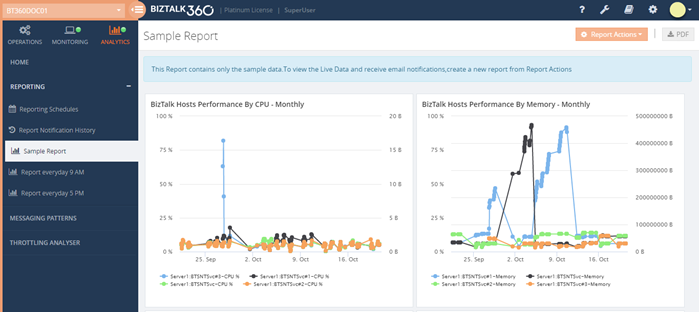
13. BizTalk Reports (Analytics)
We added this new feature “BizTalk Reports” under Analytics that offers capabilities for users to create schedules and generate PDF reports of performance metrics at specific time intervals (eg., daily/weekly/monthly). The PDF will contain the key performance metrics of BizTalk, SQL and IIS servers, messaging performance and so on.
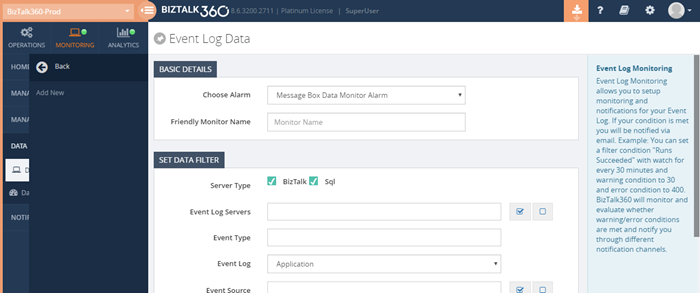
14. Event Log Data Monitoring
In addition to the existing data monitoring configurations, users can now monitor the event logs from BizTalk and SQL server in a particular environment. Users can take advantage of the rich querying capabilities of BizTalk360 Data Monitoring to monitor the event sources from different servers in a single place.
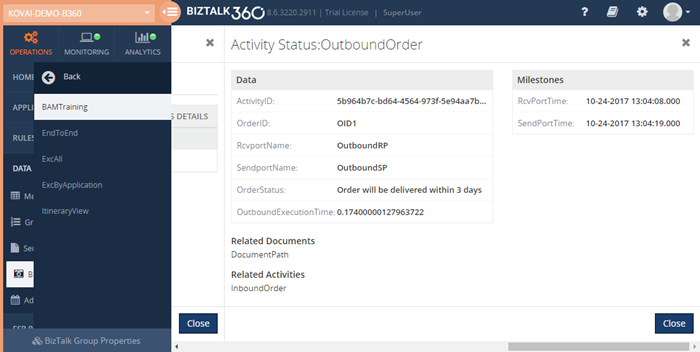
15. BAM Related Activities and Documents
We enhanced the existing Business Activity Monitoring (BAM) feature to accommodate the Related Activities and Related Documents functionality similar to BAM portal. We brought in this feature due to the repeated requests from our customers. You can view the detailed information for the request, view the related activities for the request, download the related documents and view the response activity.

Author: Sriram Hariharan
Sriram Hariharan is the Senior Technical and Content Writer at BizTalk360. He has over 9 years of experience working as documentation specialist for different products and domains. Writing is his passion and he believes in the following quote – “As wings are for an aircraft, a technical document is for a product — be it a product document, user guide, or release notes”.
View all posts by Sriram Hariharan
by Saranya Ramakrishnan | Dec 5, 2017 | BizTalk Community Blogs via Syndication
Event logs are normally used to inform about an important event in the running applications and subsystems, which plays a vital role in troubleshooting problems.
While monitoring multi-server environments, how many times in a day does your administration team log in to multiple servers to check for the root cause of a problem? Have you ever thought of a tool that could help you avoid this time-consuming process? Yes, BizTalk360’s in-built Advanced Event Viewer (AEV) helps you solve this business problem.
Set-up AEV to retrieve the event data you want from your BizTalk and SQL servers in your environment and display it all in a single screen, where you can use the rich query capabilities to search and analyze the data.
How to Set Up AEV in BizTalk360
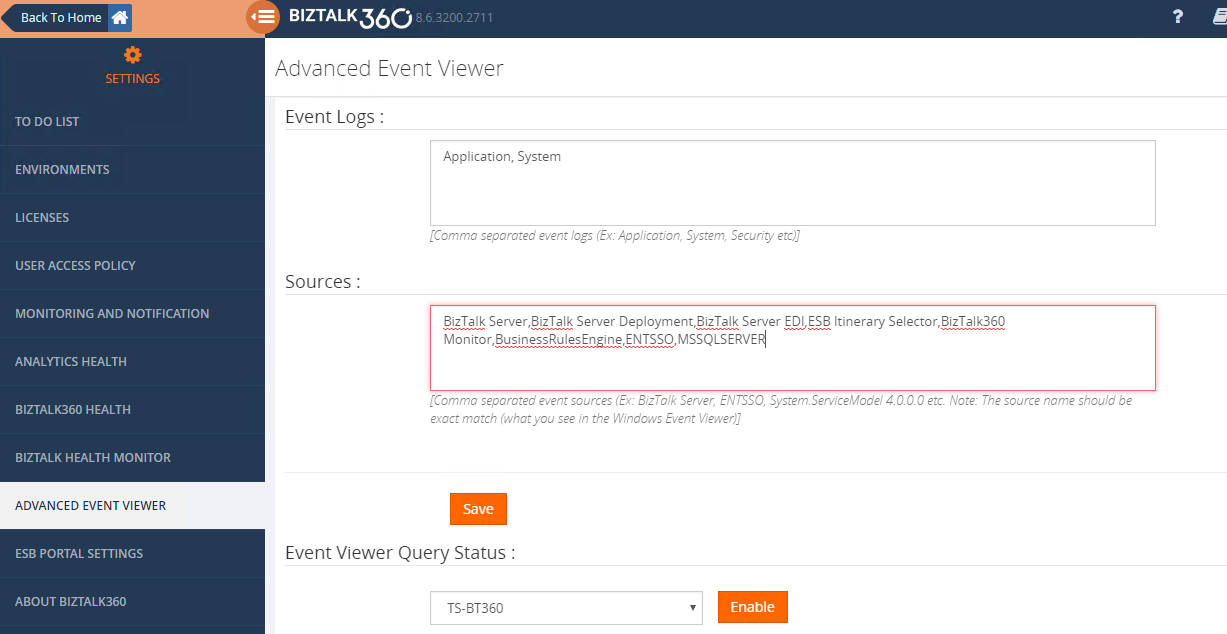
As a first step, in BizTalk360 settings, you need to configure event logs and event sources that you want to monitor and then Enable AEV for the environment. Now the BizTalk360 Monitoring service will collect event log data for all the configured servers in that environment and store it in BizTalk360 DB.
What ‘s new in v8.6?
BizTalk360 already supports AEV in operations and monitoring section for a long time. While demonstrating BizTalk360 to customers, we asked for “How to monitor a specific event occurring in BizTalk environments on a specific frequency and get an alert based on Threshold conditions”. So, keeping that in mind we have implemented Event Log Data Monitoring in version v8.6.
Let us take this complex scenario to understand more about Event Log Data Monitoring.
Scenario1: User wants to monitor different event logs for multiple servers. Example: If an administrator wants to monitor ESB events from BizTalk server and also wants to ensure there is no problem in SQL servers and also to monitor ENTSSO events form SSO server.
Start Monitoring Event log Data in 3 Steps:
- Enable AEV for an environment
- Create a Data Monitoring Alarm
- Create a schedule under event log and configure the rich filtering conditions based on your business needs as below.
Server Type : BizTalk, SQL
Server Names :BizTalk Server ,SQL Server,SSO Server
Event Type: Error
Event Sources: ESB Itinerary Selector, ENTSSO , MSSQLSERVER,

And group (All these below conditions are true)

Event ID Greater than or equal to 3010
Event ID Less than or equal to 3034
Message Contains 'ESB.ItineraryServices.Generic.WCF/ProcessItinerary.svc'

EventID IS Between 10500-10550
Message Contains ‘SSO Database’
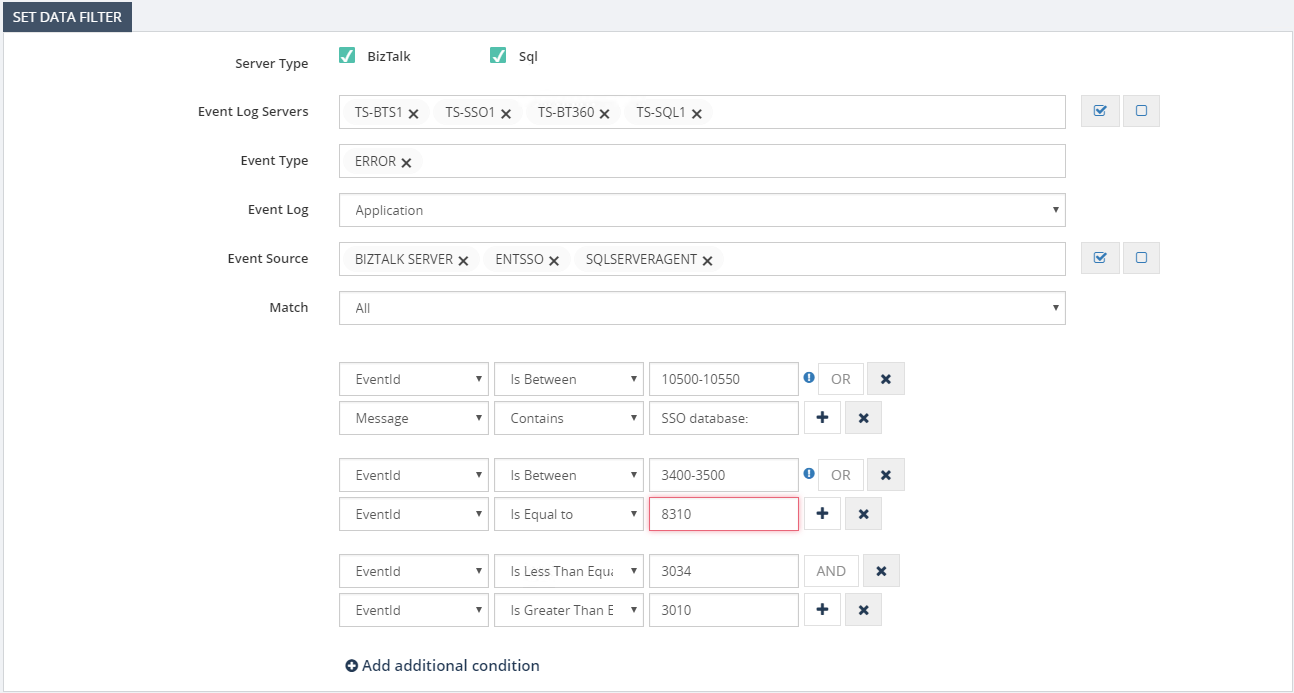
When we looked in more detail, it would normally take us into running a filtering query against configured event sources in servers and alert them when certain conditions are met.
Scenario 2: To detect the same event occurring on different servers. For example, when a certain instance of an orchestration is firstly executed on server 1 and throwing a certain error and next to another instance of the same orchestration throws the same error, while the instance becomes executed on server 2, this will now easily be detected with event log data monitoring.
BizTalk360 brings all these data into a single console and on top of that provides a powerful capability to set alerts based on various thresholds.
You can also set how frequently you wanted to run the queries based on their business requirements such as the frequency of daily validations (ex every 15 mins, 1 hour etc), end of business day or even monthly events such as month-end processing. With these thresholds, the result from the query will be evaluated and in case of any threshold violation, you will be notified via notification channels/Email.
Event Log Details in Alerts
Event Log Details will be listed in alerts by enabling the option ‘Send Event Log details in Mail’ while creating the schedule.
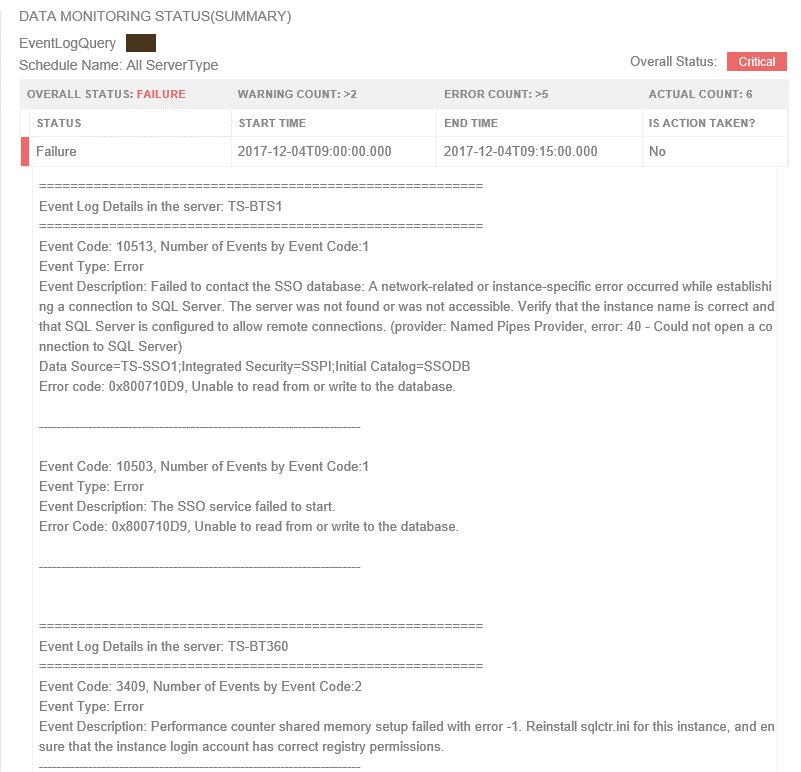
Event Log data in the Data Monitoring Dashboard
Also, the information will be visible on the Data Monitoring dashboard, you can visualize the day calendar view. If you need to understand what happened for an execution, you can click on one of the entries in the day view of the dashboard and view the details as shown below.
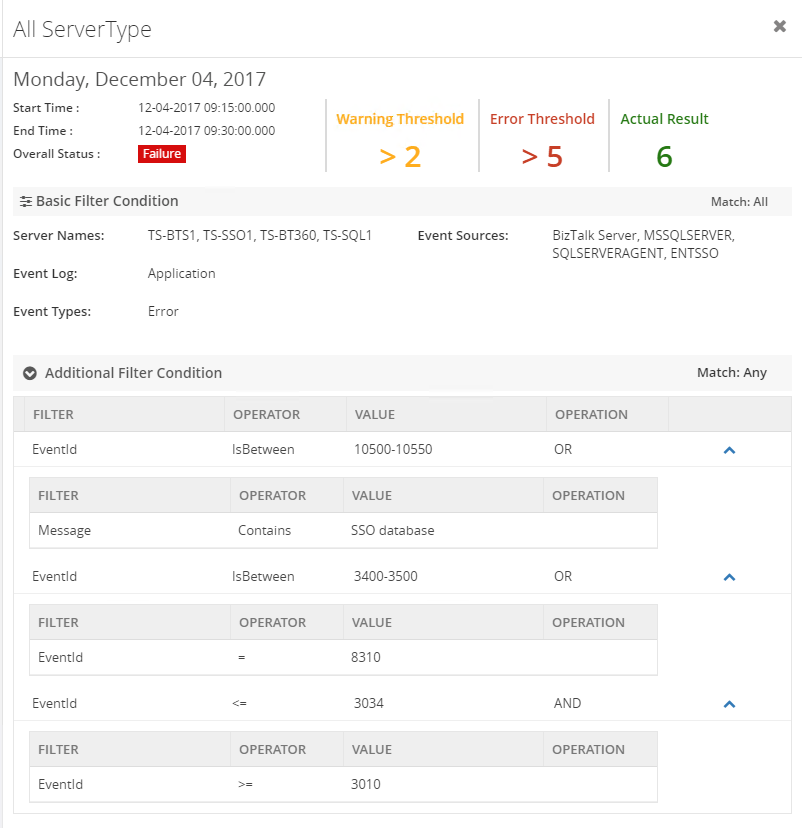
Note :
- Maintenance is very simple, once after scheduling event log data monitoring, when you disable AEV for the environment, it will stop collecting Event Log data.
- And you don’t Worry about data growth, BizTalk360 purge policy will take care of it.
- Apart from monitoring BizTalk specific SQL server, you can also monitor other SQL servers simply by adding SQL server names for monitoring in the settings section.
by Praveena Jayanarayanan | Nov 13, 2017 | BizTalk Community Blogs via Syndication
We, the product support team, often receive different types of support cases reported by the customers. Some of them may be functional, others may be related to installation and so on. Every support case is a new learning experience and we put in our best efforts to resolve the issues, thereby providing a better experience to the customers. As the below quotes say,
“Customer success is simply ensuring that our customers achieve their desired outcome through their interactions with our company” – Lincoln Murphy
We must make sure that we are taking the customers in the right direction when they raise an issue and must give them confidence about the product as well as service.
As already known, BizTalk360 is the one stop monitoring tool for BizTalk server. BizTalk360 not only contains the monitoring options for BizTalk server, in turn contains other in-built tools as well such as BAM, BRE etc. Whenever an issue is reported by the customer, we start our investigation from the basic troubleshooting steps. Hope it would be interesting to know what are the basic troubleshooting that we do. Yes, it would be. In this blog, I will share the information about the basic troubleshooting tools that we have in BizTalk360 that help us in resolving the customer issues.
Installer Log Information:
The first step in using BizTalk360 is the installation and configuration. The installation, as well as the upgrade process, is seamless with simple steps and some of the permission checks are done in the installer. But there may be some cases where the installer may fail with the below error.
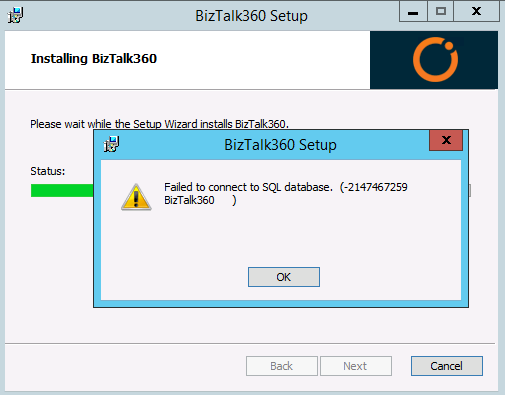
There is no much information about the error on the screen. So how do we check this error? Here comes the Installer logs for our help. Generally, when we install BizTalk360, we just give the name of the MSI in the admin command prompt and run it. But to enable installer logs we need to run the installer with the below command with the BizTalk360 version number.
msiexec /i “BizTalk360.Setup.Enterprise.msi” /l*v install.log
The installer log location can also be provided in the command, else the log will be created in the same folder where the MSI file is located. The steps performed during the installation will be logged in the installer log. The log will also contain information about any exception thrown. So, for the above error, the logged information was:
MSI (s) (E0:D4) [13:57:50:776]: PROPERTY CHANGE: Modifying CONNECTION_ERROR property. Its current value is ‘dummy’. Its new value: ‘Cannot open database “BizTalk360” requested by the login. The login failed.
Login failed for user ‘CORPsvcbiztalk360′.’.
The error clearly states that it is a permission issue. When BizTalk360 is installed, the BizTalk360 database gets created in the SQL server. BizTalk360 may be installed on the same machine where BizTalk server resides, or in a standalone machine and the SQL database may be on a separate server. As a prerequisite for BizTalk360, we recommend providing the SYSADMIN permission for the service account on the SQL server. Giving this permission to the service account resolves the above error. Hence, any installation related error information can be identified from the installer logs and can be resolved.
Troubleshooter:
This is an interesting tool which is integrated within BizTalk360 and available as a separate window-based tool. contains an extensive set of rules to verify all the prerequisite conditions in order to successfully run BizTalk360. As you can see in the below picture, the user just enters the password for IIS application pool identity and monitoring service account and clicks the “Troubleshoot BizTalk360” button. The rules will be verified and results will be indicated in the form of RED/GREEN/ORANGE.
This way, we can check the missing permissions for the BizTalk360 service account and provide the same.
Apart from the permissions, the other checks done by the troubleshooter are:
- IIS Check
- SQL Select Permission check
- Configuration File check
- Database report
If the customer faces any issue during the initial launch of the application, then they can run the troubleshooter and check for the permissions. Once the errors are resolved and everything is green, they can start BizTalk360 and it should work.
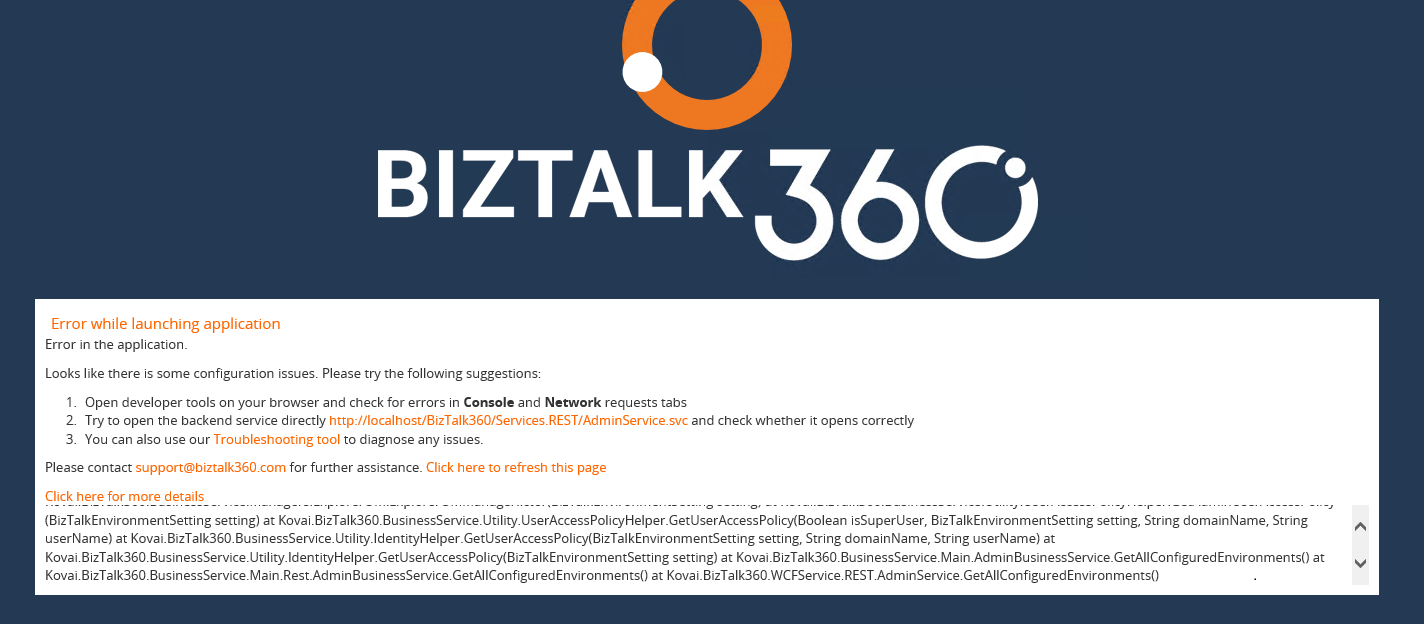
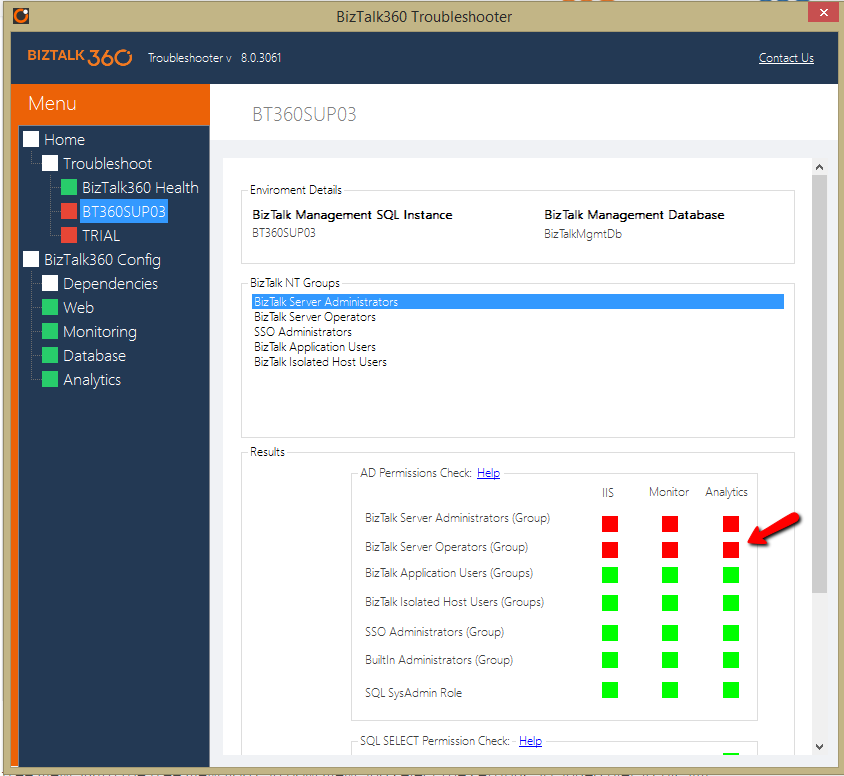
Hence all the information regarding the service account permissions, BizTalk360 configuration and database can be obtained with the help of troubleshooter. The integrated troubleshooter can be accessed from BizTalk360 itself as seen below.
BizTalk360 Service Logs:
The details of the exceptions that occur in BizTalk360 are captured in the log files that are generated in the BizTalk360 folder. The logs files not only contain the information of the exceptions, but they also contain the information about the alarm processing and the subservices statuses. There are different logs for each of them which are described below.
Monitoring Logs
Monitoring is one of the most important tasks performed in BizTalk360. There are new features getting added in every release of BizTalk360. The monitoring capability is also extended to File Locations, Host Throttling monitoring, BizTalk server high availability and much more. The BizTalk360 monitoring service is installed along with the BizTalk360 web application. Once the artefacts are configured for monitoring, the service runs every 60 seconds and triggers alert emails according to the conditions configured.
What happens if there occurs some exception during the monitoring and alerts are not triggered? Where can we find the information about these exceptions and take necessary actions? Here come the service logs that are located in BizTalk360 installation folder/Service/Log folder. There are about 25 different logs that get generated for each monitoring configuration separately and get updated whenever the monitoring service runs. Say for example, if the alerts are created, but not transmitted due to an exception, this information will be logged in the BizTalk360.SendMail.log file. So, when the customer raises an issue regarding the transmission of alerts, the support team starts the investigation from the logs. We ask the customers to share the logs from their environment and we check them. Let’s look at a customer scenario.
One of the issues came up such that:
- The customer has configured a receive port for process monitoring
- But they are getting Actual count = -1 even when there are messages processed via this port.
- They wanted to know the reason why the actual count was -1.
In BizTalk360, the negative value denotes that there has been some exception occurring. And, the exception would be logged in to the service logs. Hence, we asked them to share the logs.
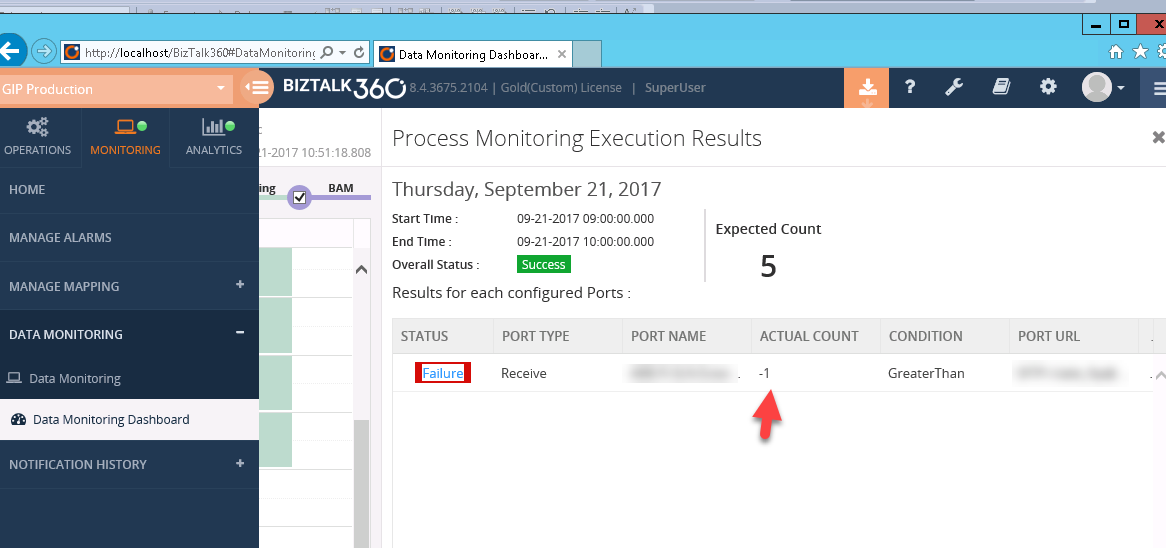
From the BizTalk360.ProcessMonitor.log, we could see the following exception:
2017-09-21 10:16:45 ERROR – ProcessMonitoringHelper:GetMonitoringStatus. Alarm Name:PROD_DataMonitor: Name: Application : Atleast 20 Messages from DHL per hour: Exception:System.Data.SqlClient.SqlException (0x80131904): Timeout expired. The timeout period elapsed prior to completion of the operation or the server is not responding. —> System.ComponentModel.Win32Exception (0x80004005): The wait operation timed out at System.Data.SqlClient.SqlConnection.OnError(SqlException exception, Boolean breakConnection, Action`1 wrapCloseInAction)
The timeout exception generally happens when there is a huge volume of data in the BizTalkDTADb database since for Process Monitoring, we retrieve the results from this database and display it in BizTalk360. The database size was checked at their end and found to be 15 GB which was greater than the expected size of 10 GB. For more information on the database size, you can refer here.
Similarly, we have different log files generated from which we can get the information about the different sub services running for BizTalk360 Monitor and BizTalk360 Analytics services.
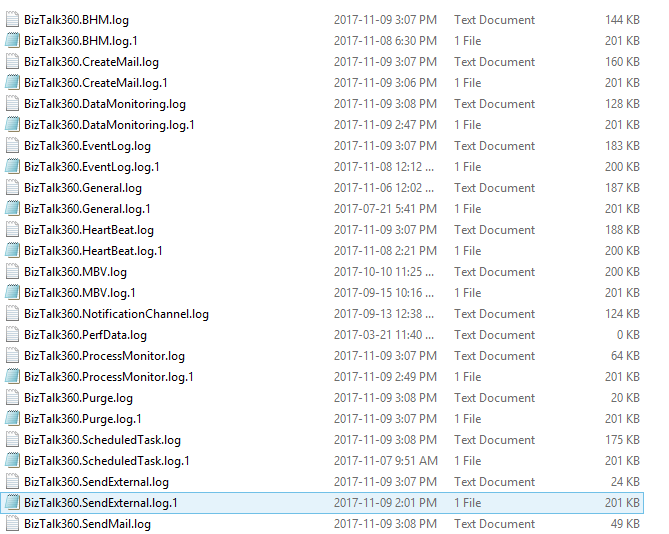

We can also check if all the subservices are started properly. The log information is captured along with the timestamp and this would make much easier for the support team to identify the cause and resolve the issues in time, thereby making the customer happy. In case of monitoring logs, the Alarm name and configurations are also captured. There are separate logs for Process Monitoring and other Data Monitoring alarms. We have separate logs for FTP and SFTP monitoring too for capturing the exceptions if any.
Analytics logs
Analytics is yet another important feature in BizTalk360 with help of which you can visualize a lot of interesting facts about your BizTalk environment like number of messages processed, failure rate at message type level, BizTalk server CPU/Memory performances, BizTalk process (host instances, SSO, rules engine, EDI etc) CPU/memory utilization and lots more. BizTalk360 Analytics service also contains different sub services run and any exception occurring for these services will be captured in the logs under C:Program Files (x86)Kovai LtdBizTalk360AnalyticsLog folder.
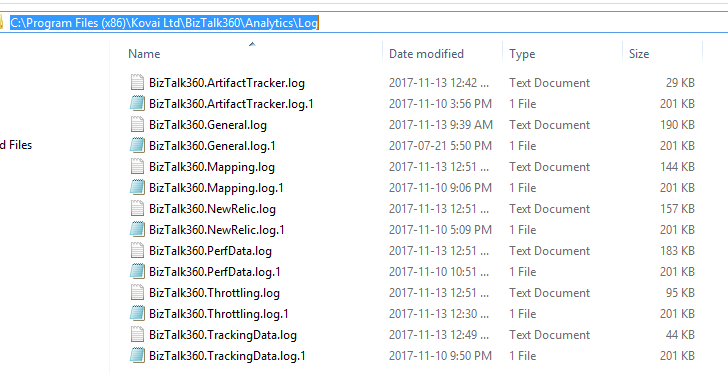
BizTalk360 Analytics is used to gather the information about the performance counters in the server and display them in the form of widgets. Also, BizTalk360 will display the information if the system is under throttling condition in a graphical format. There was a case from the customer that the Throttling Analyser was not displaying any formation when the system was under throttling condition. We then checked the logs and found the below error in the BizTalk360.Throttling.log.

From the logs, we could understand that the performance counters were corrupted and rebuilding the counters resolved the issue.
Web and Svc logs
At times, there are scenarios where a page in BizTalk360 may take some time to get loaded leading to performance issues. The time taken to load the page can be captured in the svc logs present in C:Program Files (x86)Kovai LtdBizTalk360Web folder.
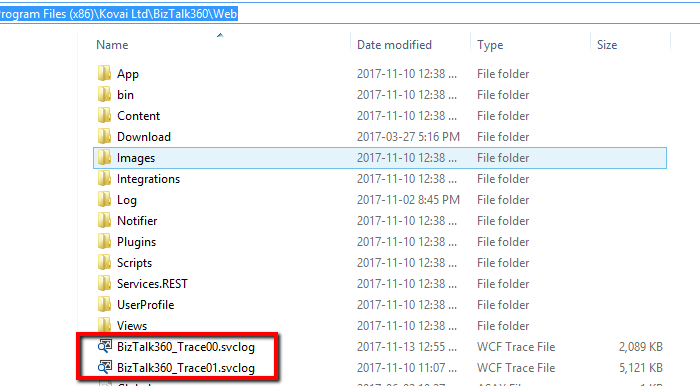
Once a customer reported that there was performance latency in some of the BizTalk360 pages. We checked these trace logs and found that the service calls GetUserAccessPolicy & GetProfileInfo methods were taking more than 30 seconds to get resolved.
GetUserAccessPolicy–>Groups/user assigned to provide access to the features of BizTalk360.
GetUserProfile –> Fetch the UserProfile of the group/user been configured.
These methods were then optimized for caching in the next BizTalk360 version release and hence the performance issue was resolved.
BizTalk360 subservices status
As mentioned before, we have different subservices running for BizTalk360 Monitor and Analytics services. In case, if there is any problem in receiving alerts or if the service is not running, the first step would be to check for the status of the monitoring subservices for any exceptions. This can be found in BizTalk360 Settings -> BizTalk360 Health -> Monitoring Service Status. The complete information will also be captured in the logs.
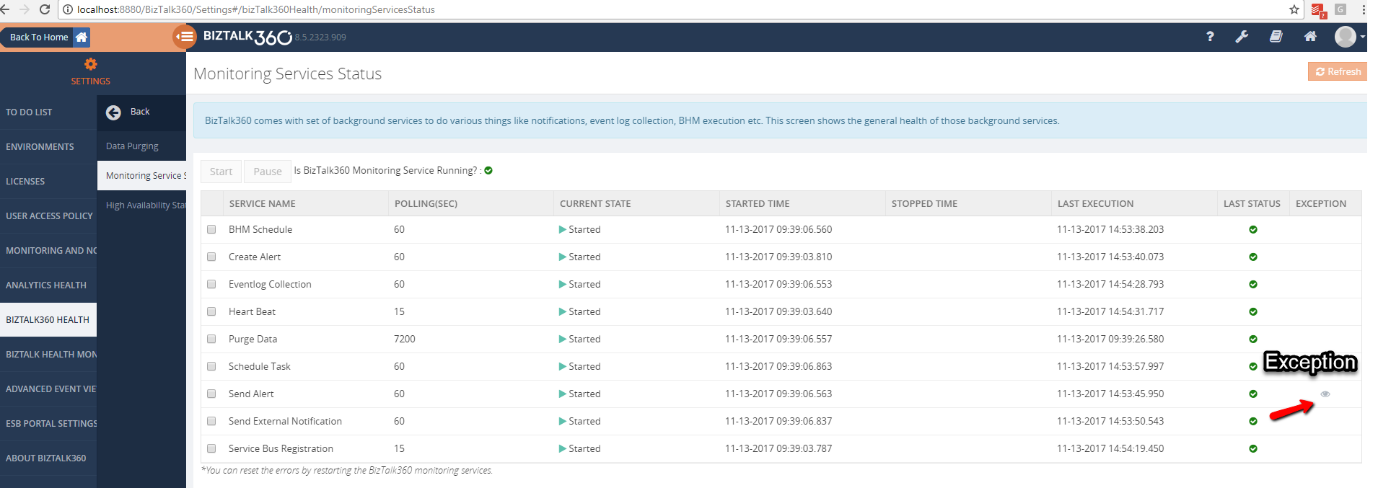
Similarly, we have the check for the Analytics sub services under Settings -> Analytics Health.
What if the customer has configured BizTalk360 under High Availability(HA)? High Availability is the scenario where BizTalk360 is installed on more than one servers pointing to the same database. The BizTalk360 Monitor and Analytics services can also be configured for HA. So, when there is an issue reported with these services, the logs from the active server must be investigated. The active server can be identified from BizTalk360 Settings -> BizTalk360 Health -> High Availability Status.
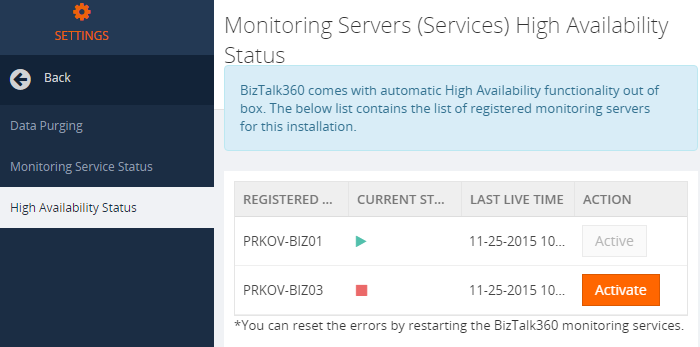
Conclusion:
These basic troubleshooting tools available in BizTalk360 make our support a little easier in resolving the customer issues. The first step analysis can be done with these tools which help us identify the root cause of the problem. We have our latest release BizTalk360 v8.6 coming up in a few weeks with more exciting features. In case of further queries, you can write to us at [email protected].
Author: Praveena Jayanarayanan
I am working as Senior Support Engineer at BizTalk360. I always believe in team work leading to success because “We all cannot do everything or solve every issue. ‘It’s impossible’. However, if we each simply do our part, make our own contribution, regardless of how small we may think it is…. together it adds up and great things get accomplished.” View all posts by Praveena Jayanarayanan
by Sivaramakrishnan Arumugam | Sep 19, 2017 | BizTalk Community Blogs via Syndication
In my previous blog, I spoke about one of the issues we encountered during our support. In this blog, I will specifically be talking about the custom widgets in BizTalk360, which a lot of our customers use to display data that is important to them. Users are able to create custom widgets and associate them with a dashboard. Custom widgets allow integration with BizTalk360’s own API’s, as well as third-party API’s.
The below code in a custom widget shows analytical data in graphical form. In recent times, we received a support case where the customer was trying to create a custom widget referencing the blog. Following should be the result of the custom widget in the dashboard.
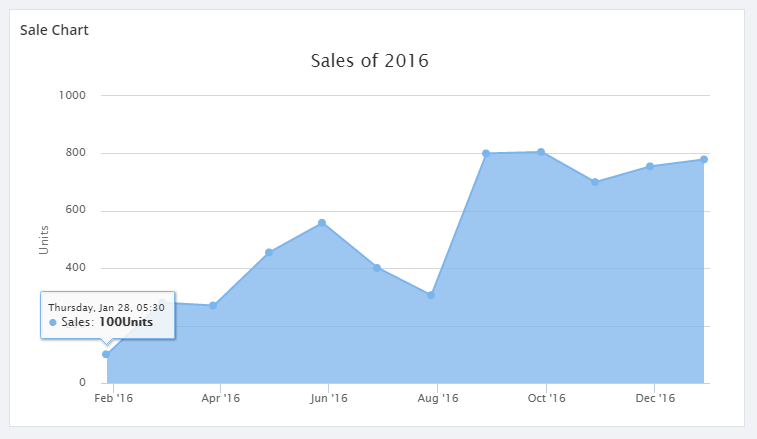
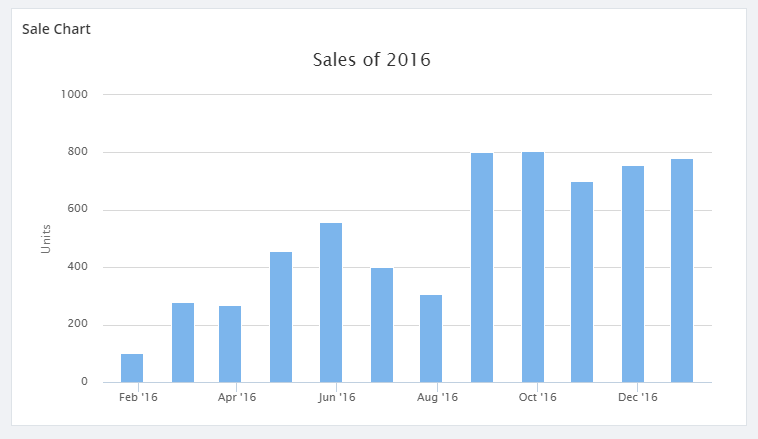
But the customer ended up with the below error after integrating the custom widget.
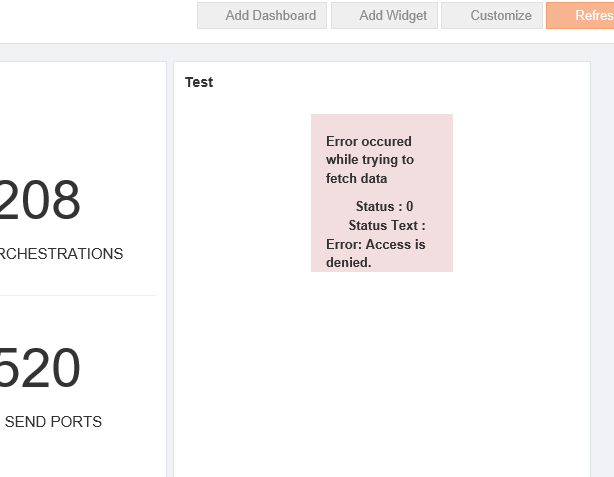
A script for the custom widget:
<script>
//URL used to get JSON Data for the Charts
this.URL = 'http://rawgit.com/cyberkingvb/CustomWidgetWithChart/master/sales2016.json';

//Refresh interval in milliseconds 60000 milliseconds = 60 seconds
this.REFRESH_INTERVAL = 60000;

//flag to check if widget should auto Refresh
this.AUTO_REFRESH_ENABLED = true;

//Highcharts Options
this.HIGHCHART_OPTIONS = {
            chart: {
                type: 'line',
                zoomType: 'x'
            },
            exporting: {
                enabled: false
            },
            credits: {
                enabled: false,
                title: '',
                style: {
                    display: 'none'
                }
            },
            title: {
                text: 'Sales of 2016'
            },
            xAxis: {
                type: 'datetime'
            },
            yAxis: {
                min:0,
                title: {
                text: 'Units'
                },
            },
            tooltip: {
                crosshairs: true,
                shared: true,
                valueSuffix: 'Units'
            },
            legend: {
                enabled: false
            },
            series: [{
                name: 'Sales',
                data: []
            }]
        };

this.widgetDetails = ko.observable();
this.error = ko.observable(null);
var _this = this;
var getdata = function()
    {
$.getJSON(_this.URL, function (data)
            {
                _this.HIGHCHART_OPTIONS.series[0].data = data;
                _this.widgetDetails(_this.HIGHCHART_OPTIONS);
            _this.error(null);
            }).fail(function(errorObject,error)
            {
    console.log(errorObject);
    _this.error(errorObject);
});
    }

//loading data for the first time
getdata();

//handles auto refresh
if(this.AUTO_REFRESH_ENABLED)
    setInterval(getdata, this.REFRESH_INTERVAL);

</script>

<!-- ko if: error() == null -->
<div data-bind="highCharts: widgetDetails()" style="height:380px; width:700px"></div>
<!-- /ko -->

<!-- ko if: error() != null -->
<div class="row">
  <div class="col-md-offset-4 col-md-4 bg-danger">
    <b>
      <p>Error occured while trying to fetch data </p>
        <span>Status : </span><span data-bind="text:error().status"></span><br>
      <span>Status Text : </span><span data-bind="text:error().statusText"></span>
    </b>
</div>
</div>
<!-- /ko -->
Script Explained
This code consists of 4 configuration variables.
URL
URL variable will allow you configure the API URL from where you fetch the JSON data. Based on the High charts options, the formatting for the data may also change. Here in the above example, the API returns the data as JSON array and date-time stamp as a Unix Timestamp.
AUTO_REFRESH_ENABLED
This flag determines if your widget should be auto-refreshed or not. For instance, if the service call that feeds your chart is very expensive and you don’t want to call that every now and then, then you can probably disable this flag or set the refresh interval to a higher value.
REFRESH_INTERVAL
Refresh interval lets you configure the interval after which the widget data should be refreshed. Note that the interval is in milliseconds. So, if you want it to refresh every one minute then you should set the refresh interval to 60000. Note that for an auto-refresh to work, AUTO_REFRESH_ENABLED flag must be set to true.
HIGHCHART_OPTIONS
BizTalk360 uses High charts for all data analytics. We already have the underlying binding handler framework to apply the options and this makes analytic widget creation a lot easier. To modify the charts, you simply need to update the HIGHCHART_OPTIONS. In this example,
the “data” property inside series array (where the data is supposed to be) is left as an empty array intentionally. It will be filled with the data that is retrieved from the URL that you have specified. High charts support a variety of charts and you can follow this link to get the type of chart that you want to bring into your custom widget.
The line chart that we have created here can be converted into an Area chart or a Column chart by simply changing “type” under “charts” options in HIGHCHART_OPTIONS.
Investigation of the Issue
Initially, we suspected that the customer might not be able to fetch the JSON data using the http://rawgit.com/cyberkingvb/CustomWidgetWithChart/master/sales2016.json URL. When we asked to browse the URL and they could browse and view the results. So, the next step was to isolate the case at the customer end. Whenever such a situation arises we require more information about the customer’s environment, we would go for a web meeting with a screen sharing session. We went for the screen sharing session and we started with the basic troubleshooting steps like checking the configuration, environment etc.
At last, we found that the customer is using https://localhot/biztalk360 and he is trying to monitor http://rawgit.com/cyberkingvb/CustomWidgetWithChart/master/sales2016.json.
Using HTTPS, there is a security code being generated and shared to accept the information between computers. (Say, in client and server architecture). This keeps the information safe from the hackers.
They use the “code” on a Secure Sockets Layer (SSL), sometimes called Transport Layer Security (TLS) to send the information back and forth.
Resolution Provided
When the HTTP is used inside the HTTPS URL, the HTTPS expected a “code” from HTTP. When the response from the widget URL was coming without the code it threw the error message “Access is denied” on the widget.
Hence, It is not possible to create custom widgets with the cross-domain URL. If the HTTPS is used, all the related URL must use the HTTPS.
If you have any questions, contact us at [email protected]. Also, feel free to leave your feedback in our forum.
Author: Sivaramakrishnan Arumugam
Sivaramakrishnan is our Support Engineer with quite a few certifications under his belt. He has been instrumental in handling the customer support area. He believes Travelling makes happy of anyone. View all posts by Sivaramakrishnan Arumugam
by Rochelle Saldanha | Sep 11, 2017 | BizTalk Community Blogs via Syndication
We are planning a series of blogs, Customer feedback getting Answered, where we will be trying to address and answer some of the issues where a workaround is possible rather than awaiting a new feature release.
Many of our customers put a lot of effort in describing their problems in the feedback portal – (where we collect all requirements in single place and we pick the popular features to be implemented based on the voting done by various customers). We often go through the feature requests – updating the status of the issues and also discussing them with our technical development team of the feasibility of implementing them.
Behind the scenes, we go through a process for the popular requests and help to bring them to implementation in the upcoming releases.
In one of our previous blogs, I went through the FAQ’s a lot of our customers usually have. In this article, I take an issue from the feedback portal and show how it can be solved with the API we expose.
The Issue:
Monitoring Alarms information on the Operations Dashboard
The Operations Dashboard is widely used by a lot of companies to have a quick overview of the system. While we do have a lot of interesting widgets, we do not have anything which links the Alarm notification section to this area.
http://feedback.biztalk360.com/forums/331698-biztalk360-monitoring/suggestions/20369500-widget-with-errors
With API Documentation capability of BizTalk360, we have exposed over 350 REST services (APIs) that have the capability to retrieve the requested information from the BizTalk server environment. The APIs are defined as Swagger files which mean that you have the ability to execute them online to see if the result is what is intended. For example, you may want to display the list of BizTalk Applications or the performance of the BizTalk server (such as CPU, Memory, etc.) in a custom dashboard application within your organization. With BizTalk360 API Documentation, it is very easy for you to consume the API and retrieve the information from the BizTalk server environment. It not only ends with these. You can access pretty much any information like EDI, BAM, Artifact information, and so on from the BizTalk environment with the help of BizTalk360 APIs.
The Solution:
I have used for this example, a very simple API to retrieve the latest monitoring data for a specific alarm from the below API.
GET Services. REST/AlertService. svc/GetLatestMonitoringData
You can use the BizTalk360 API documentation to test your parameters and then view the output response.
In BizTalk360, navigate to Settings -> API documentation -> Select Alert services from the dropdown and then select GetLatestMonitoringData.
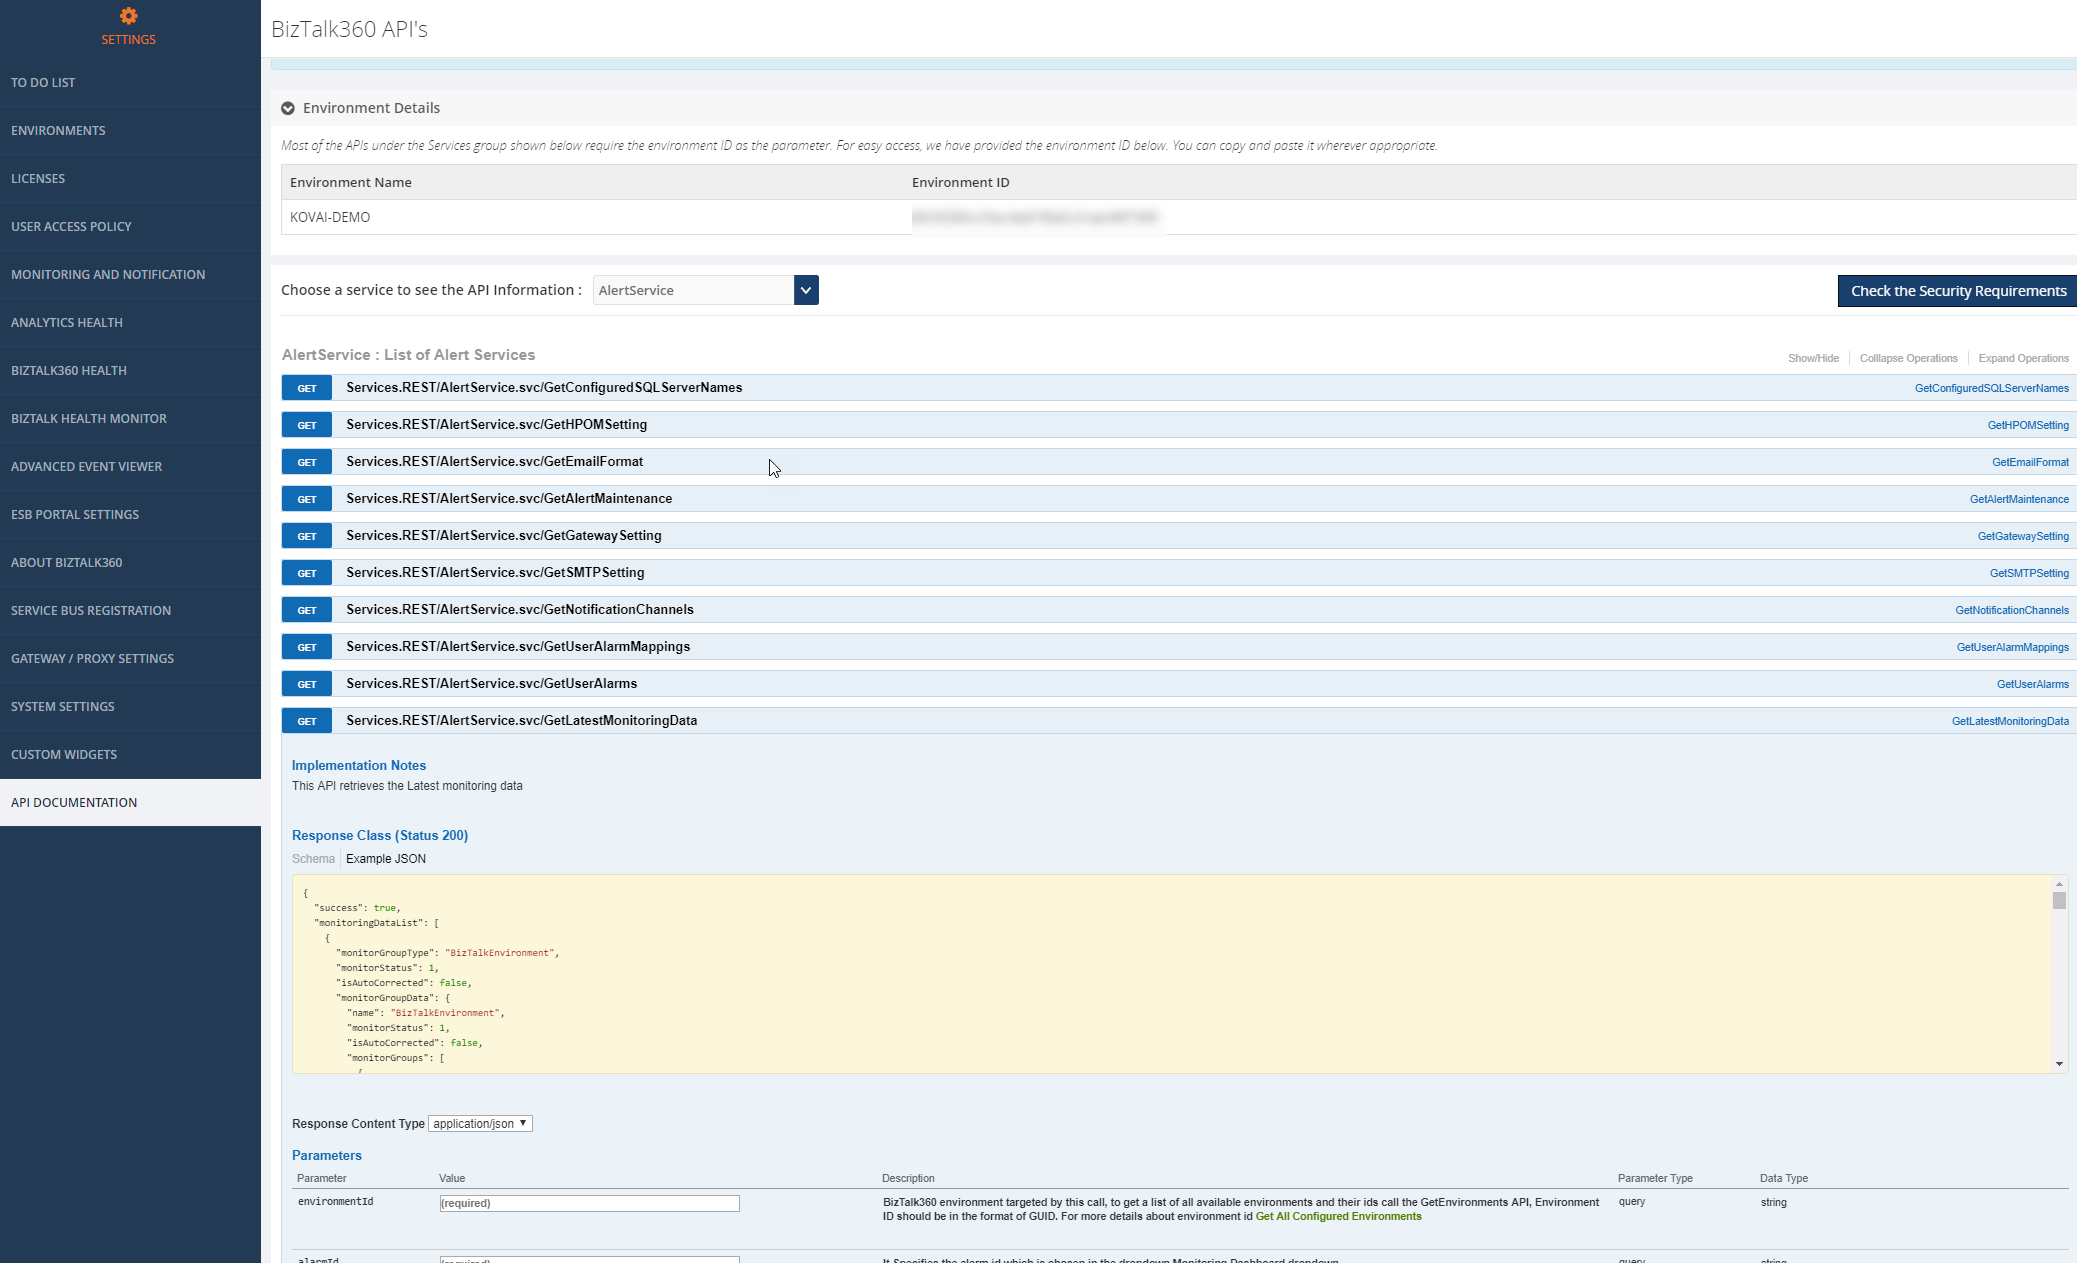
Current Alarm Monitoring Dashboard View
This is how my Alarms current state is in the Monitoring dashboard is currently.
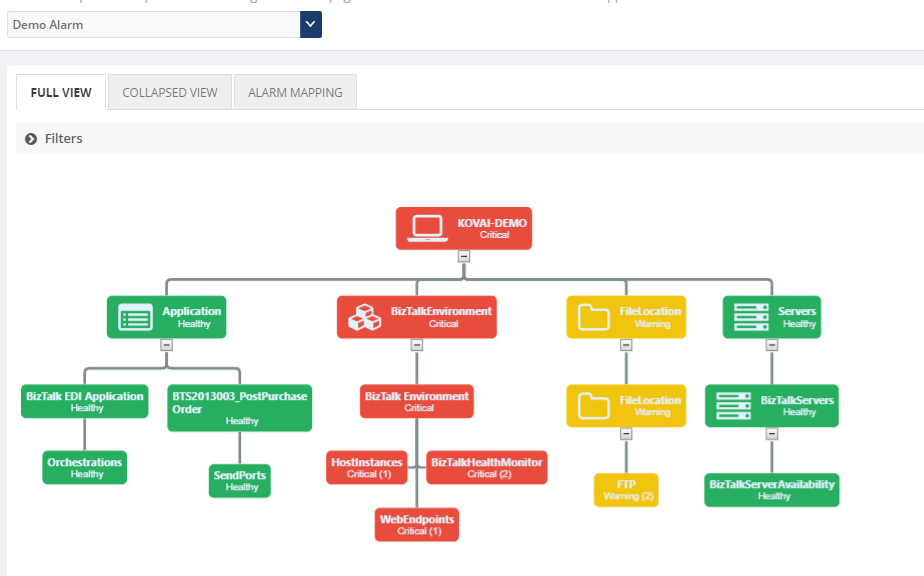
And now to view the same data in the Operations Dashboard, we need to create a custom widget which will use the API call as shown earlier. All you need to provide is the <Environment ID> & <Alarm Id> to pass as parameters which you can retrieve from the SQL tables. (Environment ID is provided at the top of the API Documentation page already)
Then you can use this code for the widget which I wrote to have a basic widget for a specific alarm to show on the Operations Dashboard.
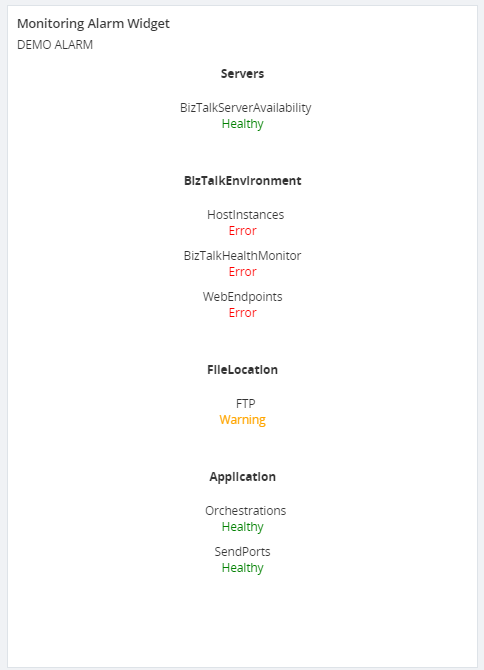
Thus, you can see for the Alarm – Demo Alarm, I have displayed all the artifacts and the state they are in.
This can be crucial for those who use their dashboards a lot. Rather than switch to the Monitoring dashboard, you can view the same data as a widget on the Operations Dashboard, along with other useful information.
Hopefully, this blog gave you some more ideas on how you can use the API & Custom widgets to customise the data displayed.
If you have any questions, contact us at [email protected]. Also, feel free to leave your feedback in our forum.
Author: Rochelle Saldanha
Rochelle Saldanha is currently working in the Customer Support & Client Relationship Teams at BizTalk360. She loves travelling and watching movies. View all posts by Rochelle Saldanha
by Senthil Palanisamy | Sep 6, 2017 | BizTalk Community Blogs via Syndication
Introduction
BizTalk server state based artifacts such as receive location, send port, orchestration may go down due to various reasons. This could stop a business critical interfaces from processing messages. Monitoring the artifact states is a tedious task for both operational and administrative users. The operational users must monitor the state of artifacts constantly if any violation happens to the artifact state the operational user will intimate the administrative users immediately. In turn, administrative users should take corrective actions to bring the artifact to the expected state to avoid/minimize the business impact. This process involves the operational and administrative users be available throughout the clock to enable the interfaces again. BizTalk360 overcomes this challenge with its auto healing capability.
I am writing series of articles on “Automating BizTalk Administration Tasks Using BizTalk360”. First Blog was focused on service instance data monitoring. In this article, I will be explaining how you can leverage auto healing capability in BizTalk360.
How it works
With the auto healing functionality, Administrators can set up monitoring on any “State-based” artifact and let the monitoring service to automatically heal the artifact any time when there is a mismatch between the “Expected State” and “Current State”. For instance, Administrators can set up monitoring on the receive location(s) of an application and additionally set up the auto correct functionality for the Expected State of the artifact (which should be “Started”). Whenever the receive location goes down/gets disabled, there will be a state mismatch and the auto correct will try to bring the artifact back to the expected state. If the operation is successful, the artifact will come back to the Expected State within the next monitoring service cycle (60 seconds).
State Based Monitoring
Artefacts State Based monitoring is one of core feature in BizTalk360. State Based monitoring is included for Application Artefacts
- Send Ports
- Receive Location
- Orchestrations
- Host Instances
- NT Services
- SQL Jobs
- Logic Apps
To avoid this manual intervention, administrators can set up the “Max Retries” count in the auto healing. This would allow the auto healing (BizTalk360 monitoring service) to continuously try and bring back the receive location to “Enabled State”. If the operation was successful within the Max Retry count, the artifact would be automatically healed to ensure business continuity. If the operation was not successful within the Max Retry count, the artifact would move into a Critical state.
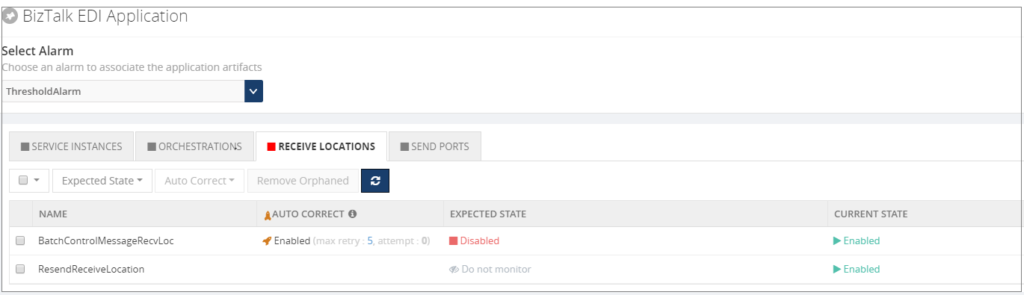
Email Notification
Artefact (Receive Location) is configured for monitoring and auto healing when the receive location violates the threshold condition means monitoring service will first trigger the down alert.

Monitoring service will auto correct the state of receive location to expected state and trigger an auto correct email.

Custom BizTalk Adapters
Custom BizTalk adapters are used in Receive Location/Send Port; In this case, we must install Custom adapter components in BizTalk360 servers.
If you have installed BizTalk360 Monitoring service in multiple servers for BizTalk360 HA then install Custom Adapters pack in multiple servers.
We can few cases where custom adapters pack needs to be installed;
1. BizTalk Scheduler Adapter
When you are using BizTalk Scheduler in BizTalk Artefacts and not installed in BizTalk360 Box. Then you will get the error as like below
“ReceiveLocations: Exception raised while trying to set receive locations to the expected state. Ex: Microsoft.BizTalk.ExplorerOM.BtsException: Could not validate TransportTypeData, Address or Public Address properties for Receive Location ‘Receive_INV_Scheduler’ “
To address this issue we need to GAC Microsoft.BizTalk.Scheduler.dll in BizTalk360 Box(es).
2. nSoftware Adapter
nSoftware Adapters are used in BizTalk Artefacts (e.g.: FTP(s)/SFTP Adapters). Exception raised while trying to set receive locations to the expected state by auto correct feature.
“Ex: Microsoft.BizTalk.ExplorerOM.BtsException: Failed to create ‘nsoftware.SFTP v4’ Transport Component at Microsoft.BizTalk.ExplorerOM.BtsCatalogExplorer.SaveChangesWithTransaction(Object transactionObj)”
Overcome this challenge we need to install the nSoftware adapters where BizTalk360 Monitoring service is running.
3. Host Integration Adapter Pack
BizTalk Artefacts are using MQSC (HIS) adapters in your BizTalk Environment means you have to install Host Integration Pack Adapters.
The following are adapters in Host Integration Adapter Pack
- Host Applications
- DB2
- WebSphere MQ
- Host Files
User Permission
Taking automatic actions on BizTalk Artefacts, SQL Jobs, Host Instances and NT Services we need adequate permissions to Service Account user with respect to Windows, SQL, and Azure.
| Feature |
Minimum Required Permission |
| BizTalk Artefacts – To change the status of BizTalk Artefacts |
BizTalk Operators Group |
| Host Instances – Operations (WMI) |
BizTalk Administrator Group |
| SQL Jobs – Change state of Jobs |
SQLAgentOperatorRole |
| Logic Apps – Enable/Disable |
Owner (Subscription User) |
You can see more information about BizTalk Server Security.
Conclusion
BizTalk users can leverage this most powerful feature “Auto Healing” in BizTalk360 to maintain/monitoring the states of various Artefacts. It will minimize the downtime of BizTalk Artefacts.
Author: Senthil Palanisamy
Senthil Palanisamy is the Technical Lead at BizTalk360 having 12 years of experience in Microsoft Technologies. Worked various products across domains like Health Care, Energy and Retail. View all posts by Senthil Palanisamy
by Saranya Ramakrishnan | Aug 7, 2017 | BizTalk Community Blogs via Syndication
Monitoring and Alert notification is one of the core functionality in BizTalk360. To empower better usability of a user, we have improved the alert notification in the latest release v8.5. The enhancements are typically chosen from our customer feedback based on the impact and the number of requests.
Event Log description:
Event logs can give the early warning of impending system issues and save you from unexpected disasters. It is quite important to monitor the event logs regularly to get proper insights of any windows servers.
BizTalk360 has ‘Advanced Event Viewer’ functionality in which BizTalk360 Monitoring services collect the data from event logs from defined event sources of multiple servers. And the same can be monitored with respect to event log type (Application, Security, System, Windows PowerShell etc…), event sources of each event types and also with the specific event id and texts by configuring threshold conditions.
The best way to monitor event logs is to choose a solution that reports the Windows Event ID as well as the error message. Considering this ideology, we enhanced this in 8.5 release, so that event log will be alerted along with the description. This feature is also enabled with the filter on the number of event logs and size of the description (up to 5000 characters) in the system settings. Now user can get clear insights on any events occurred in the configured BizTalk or SQL server.
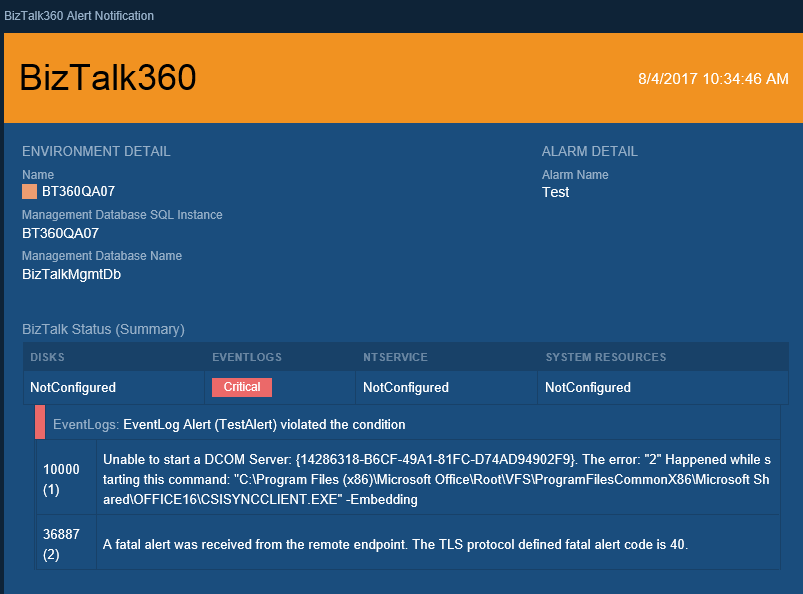
Event log monitoring can be done in few easy steps
- Enable Event Log Monitoring in Setting->Advance Event Viewer section
- Define Email Event Log Description character count and List Count in system settings
- Configure Monitoring Threshold conditions for event log monitoring.
Migration Scenario: To use this, the user needs to define the list count and description character count in system setting. By default, the values will be zero after migration.
Data Monitoring alerts in Notification channel
Data Monitoring is one of the powerful features in BizTalk360 which run queries against multiple data sources in BizTalk which include: Message Box Queries, Tracking Queries, BAM Queries, EDI Queries and ESB Queries, Logic Apps based on the configuration how the user wants to monitor data in each of these sources.
Previously Data Monitoring alert can be sent only through static notification end points like SMS, Email, Windows Event log and HP Operation Manager. From v8.5 we have extended custom notification support for data monitoring alert. Using this functionality, the users can get Data Monitoring alert from various external systems like Slack, ServiceNow, Web Hook and they can also build their own custom notification channels to any external systems.
To use this functionality user need to configure notification channel in setting side and enable the same in Data Monitoring alarm.
Migration Scenario: User need to enable Configured Notification Channel in Existing Data Monitoring Alarm to get Data Monitoring alert on custom notification channels.
Web Endpoint Monitoring Enhancement
We have web endpoint monitoring (ability to monitor any HTTP based URL’s) for very long time in BizTalk360, right from 6.x. In fact, this is one of the key monitoring component used by a lot of our customers. Web endpoint monitoring allows you to monitor the health of any HTTP based web service. You can monitor:
- Response status codes
- Response Keyword, XML, JSON
- Response Time
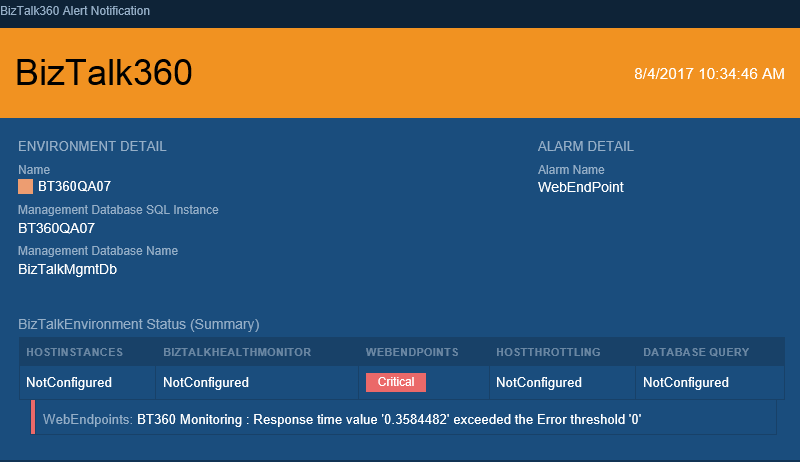
You can configure BizTalk360 to trigger an alert notification if the response value is not matching your requirement. We have done following improvements on web endpoint monitoring alerts.
- Many customers suggested to include the endpoint name in an alert email, alert history and also in monitoring graph to easily identify which endpoint has gone down in case of multiple web endpoint configured for monitoring.
- Also Expected Return code and Response Time Alert details are included in alert for more insights.
Folder Size Monitoring
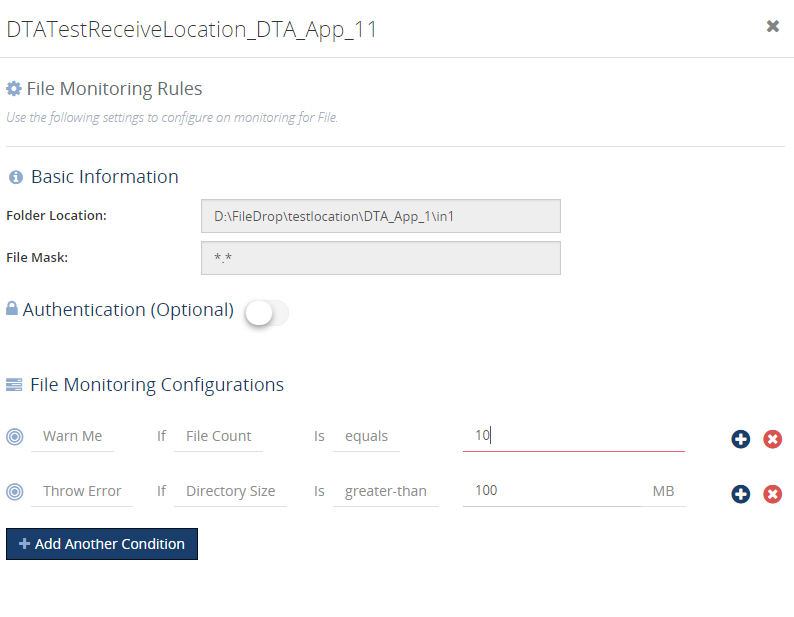
In BizTalk360 version 8.4, we introduced the capability of folder monitoring which monitors the file count for File Locations (File, FTP and SFTP) configured in BizTalk artifacts. From 8.5, we are supporting directory size monitoring for file locations which actually monitors the size of entire folder irrespective of file mask. (i.e) the folder may contain various file types XML, txt, png etc but the configured file may be either one of this type so here, folder size means entire folder with all the file types.
With in 2-3 clicks, the user can configure monitoring threshold conditions for folder size and start monitoring and get notified as and when folder size increases/decreases.
Conclusion
BizTalk360 enhances the complex administrative tasks into a modern easier task. This version of 8.5 is being added with more features thinking from a usability perspective of our customers. BizTalk360 continues to provide more such features considering the feedback from our customers and stay tuned for next version.
by Saravana Kumar | Aug 2, 2017 | BizTalk Community Blogs via Syndication
What is BizTalk Host Throttling?
BizTalk Server being a Middleware product connected to various legacy backend systems it needs to make sure the entire ecosystem can work in an optimal way. If one of the legacy system connected to BizTalk is slow for any reason, then BizTalk Server need to act sensibly not to overload that system with messages more than what it can handle. In such scenarios, BizTalk Server will throttle itself (slow down itself) and make sure the messages are delivered to the backend in an optimal rate.
BizTalk Server achieves this capability by continuously monitoring various performance counters (memory footprint, thread count, message publishing rates, database size etc.) and self tuning itself. There are over 50 performance counters related to throttling in BizTalk Server which monitors both inbound and outbound traffic.
BizTalk360 Throttling Analyser
One of the challenges for BizTalk Server Administrators when it comes to BizTalk Throttling is, there is no out of the box tooling from Microsoft to understand whether your BizTalk Environment is working efficiently or under throttling condition. You only have raw performance counters to measure throttling. Typically the BizTalk Administrators open up Windows Perfmon tool and add all the performance counters related to Throttling record and analyse throttling conditions. This requires extensive knowledge about how BizTalk Server works, various throttling counters & conditions, whether it’s running on optimum level etc.
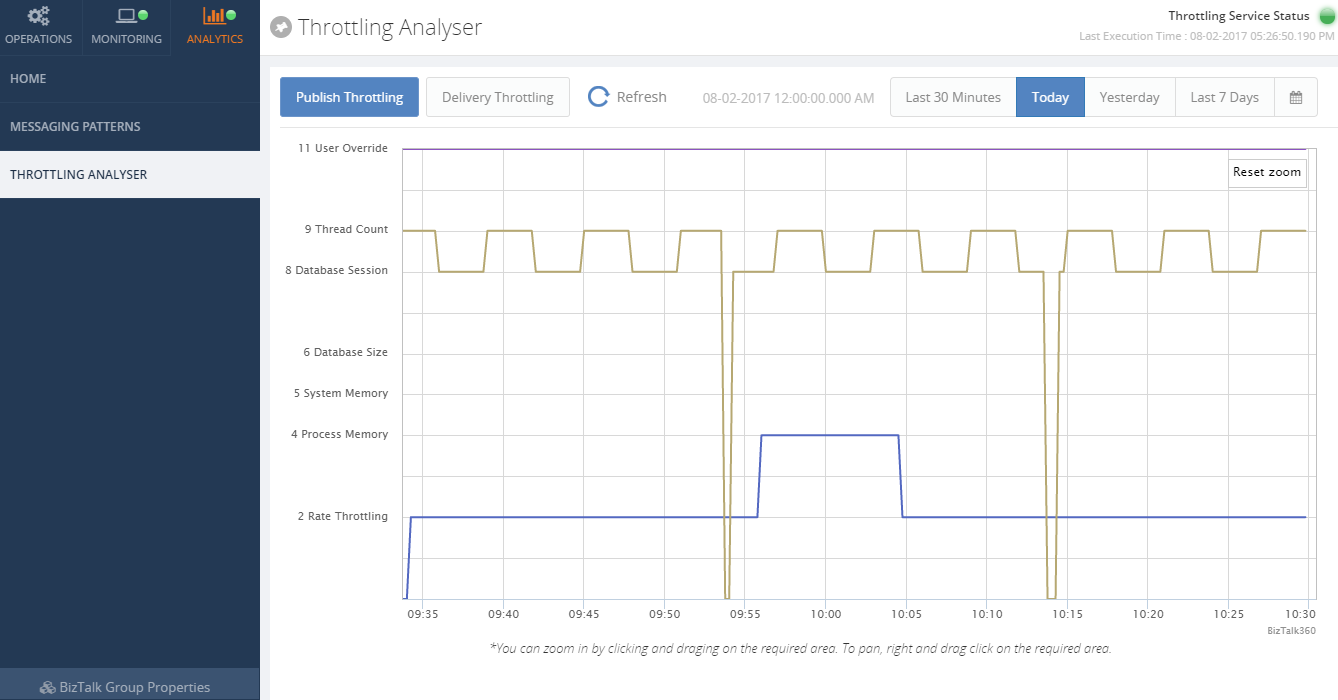
To address this issue, about 2 years ago we introduced “Throttling Analyser” in BizTalk360. Once enabled, BizTalk360 continuously collect all the throttling related performance counter data in our database and provide an intuitive user interface with highly interactive graphs to showcase whether the BizTalk Environment is working efficiently or under throttling condition. This saves a lot of time for BizTalk Administrators to understand environment throttling condition and the biggest advantage is you do not need to have in-depth knowledge about BizTalk Server internal architecture and throttling mechanism.
BizTalk360 Throttling Monitoring
The Throttling Analyser explained in the previous section only gives you the visual representation of the BizTalk Environment throttling condition. The BizTalk Administrator need to periodically log in to the system to see if the environment is healthy. However, we can clearly see a value in alerting the BizTalk Administrators if the environment is suffering from any critical throttling conditions for a perceived time.
That’s exactly what we have done with “Throttling Monitoring” in version 8.5 of BizTalk360. We wanted to make the experience super simple and intuitive.
How does it work?
Let’s take a close look at how this functionality is designed and how it works.
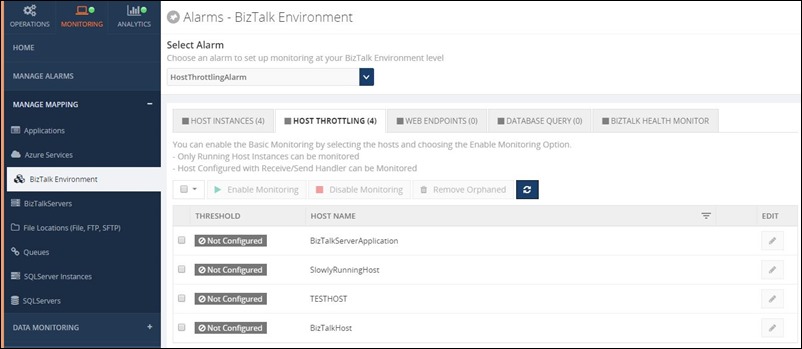
Under BizTalk Environment monitoring section we introduced a new category called “Host Throttling”, which by default will list out all the BizTalk Hosts that’s currently configured in the environment as shown in the below picture.
Enabling BizTalk Host Throttling monitoring in single click
You can enable default throttling for all the BizTalk Hosts in a single click, you simply select the hosts you wanted to monitor and click the button “Enable Throttling”, this will start monitoring the BizTalk Environment for any throttling violation that persist for 60 seconds.
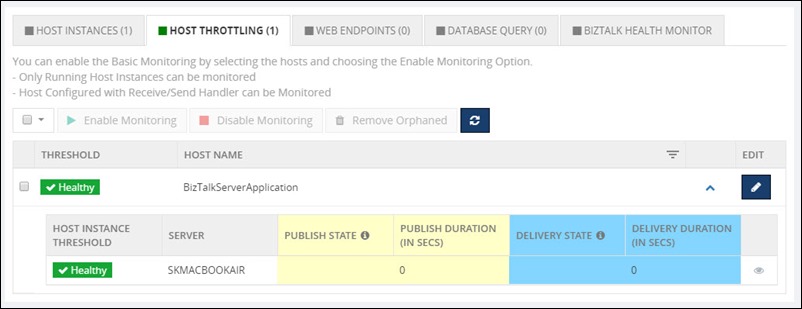
The whole idea for us is to make it as simple as possible to monitoring BizTalk Throttling condition, hence we provide the option to just enable the default monitoring with 60 seconds persistence in a single click.
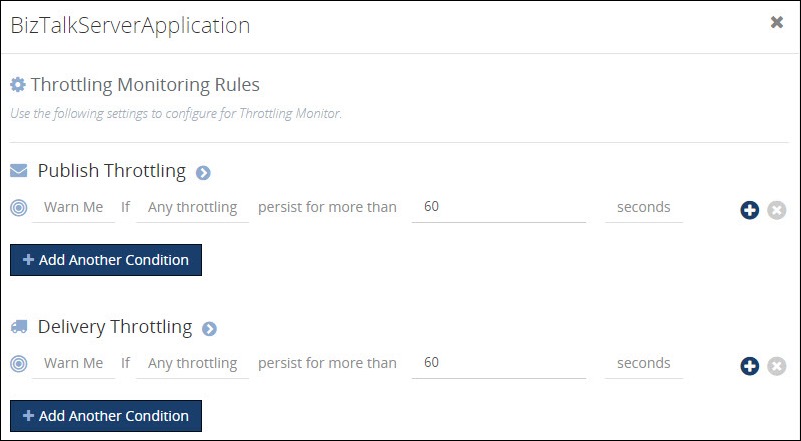
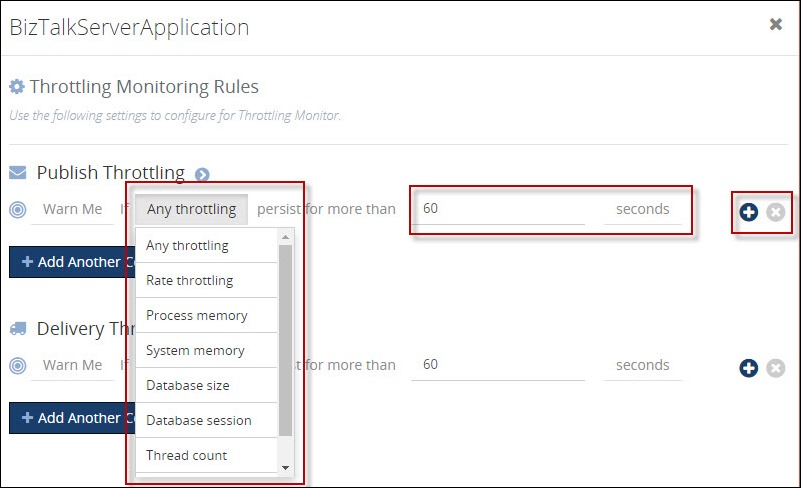
The BizTalk Administrator can easily tweak the default configuration by clicking on the “Edit” button and changing the parameters. As you can see from the below picture, you can choose to monitor specific throttling condition or you can have multiple conditions with different persist duration etc, you can also have different monitoring options for publish side and delivery side.
For Publish Throttling, the user can able to monitor the following metrics:
- Any throttling
- 2 – Rate Throttling
- 4 – Process memory
- 5 – System memory
- 6 – Database size
- 8 – Database session
- 9 – Thread count
- 11 – User override
For Delivery Throttling, the user can able to monitor the following metrics:
- Any throttling
- 1 – Rate Throttling
- 4 – Process memory
- 5 – System memory
- 9 – Thread count
- 10 – User override
Notification of Throttling violation
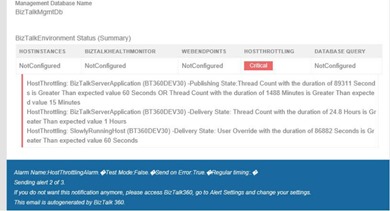
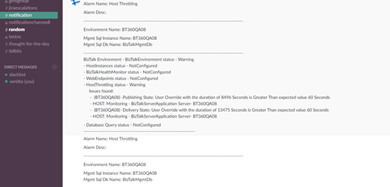
Once the settings are configured to look out for throttling conditions, BizTalk360 will keep monitoring the environment. If BizTalk360 detects any threshold conditions violation, it will notify the users via configured notification channels. In BizTalk360, there are various notification channels like Email, Slack, ServiceNow, SMS, Event Viewer, Web Hook etc
| Email Notification |
Slack Notification |
 |
 |
Summary
Threshold monitoring is one of the key features we have introduced and it address one of the important areas of BizTalk Server Operations and Monitoring. This will help customers to keep an eye on the capacity of their BizTalk Environments in near real time and take appropriate actions.
You can write to us at [email protected]. Have a try at our latest version by downloading a 14-day free trial of BizTalk360.
Author: Saravana Kumar
Saravana Kumar is the Founder and CTO of BizTalk360, an enterprise software that acts as an all-in-one solution for better administration, operation, support and monitoring of Microsoft BizTalk Server environments. View all posts by Saravana Kumar

by Senthil Palanisamy | Jun 20, 2017 | BizTalk Community Blogs via Syndication
Introduction
On a day to day basis, a BizTalk administrator must perform few monotonous activities such as terminating instances, enabling receive locations, ensuring the status of SQL jobs etc. BizTalk360 has few powerful features which help you to automate such monotonous tasks. These features are hidden gems and are overlooked by many BizTalk360’s users, despite the availability of a good documentation. That prompted me to start my new blog series called “Automating BizTalk administration tasks using BizTalk360”. In this blog series, I will be explaining these automation capabilities which BizTalk360 brings to its users.
To start off with in this first blog I am focusing on “Data Monitoring Actions”.
What is Data Monitoring in BizTalk360?
As we are aware, BizTalk collects a diverse set of data into message box database, tracking database, BAM primary import and ESB databases. BizTalk360 brings all these data into a single console and on top of that provides a powerful capability to set alerts based on various thresholds. This feature is called data monitoring. Below is a screenshot that shows all different data sets which can be used in data monitoring feature.
Below table briefly explains various types of data items which could be monitored.
|
Data monitoring category
|
Explanation |
| Process Monitoring |
With process monitoring you will be able to monitor the number of messages being processed by receive ports, send ports. This is popularly also called as “non-event monitoring”
Ex: if you want to alert when less than 50 messages received in an hourly window during business hours, then process monitoring is the best fit.
Refer the assist article Process Monitoring for more information.
|
| Message Box Data monitoring |
With this you will be able to set alerts on the number of suspended, running, dehydrated messaging instance.
Refer the assist article Message Box Data Monitoring for more information.
|
| Tracking Data Monitoring |
With this you can set alerts on tracked messaging events and tracked service instances.
Refer the assist article Tracking Data Monitoring for more information.
|
| BAM Data Monitoring |
With this you can set alerts on the data stored in BAM tables.
Refer the assist article BAM Data Monitoring for more information.
|
| EDI Data Monitoring |
With this you can set alerts on the EDI and AS2 reporting data stored in BAM tables.
Refer the assist article EDI Data Monitoring for more information.
|
| ESB Data Monitoring |
With this you can set alerts on the ESB data and exceptions stored in BAM and ESB tables.
Refer the assist article ESB Data Monitoring for more information
|
| Logic Apps Metrics Monitoring |
With this you can set alerts on metrics emitted by Logic apps.
Refer the assist article Logic Apps Metrics Monitoring for more information
|
Message Box Data Monitoring Actions
In Message Box Data Monitoring, the user can configure the queries to monitor service instances and messages. Monitoring service will send the notification to the users whenever the service instances/Messages count violates the threshold condition.
Message Box Data Schedule can be configured in Data Monitoring > Message Box Data. It can be scheduled at the different frequencies (Daily, Weekly, and Monthly) based on the volume and priority to take the action on service instances/messages.
Query Condition
BizTalk360 provides Highly advanced query builders for selecting the precise and expected suspended instances based data-result. While querying the suspended/All In-Progress Service Instances you can apply the filters like Error Code, Application, Service Class, Service Name etc.
Context Properties
A Message-Context based query is been provided by BizTalk360 for higher business-friendly scenarios. In Message payload, context/promoted properties can be selected to know the transactional message. In Data monitoring schedule the user can choose which context promoted properties to be in an email alert.
Action on Service Instances
The operational user must closely watch the suspended service instances to act on. It is a tedious process to look after all the time. Message Box data monitoring feature will take automatic action on service instances when the set actions are configured in our schedule. The monitoring service will Terminate/Resume the service instances based on either error or warning condition which doesn’t require any manual intervention.
Archiving & Downloading the Message Instances
Message content & context is required for auditing or other purposes of reconciliation. If you have not enabled the tracking option, it is not possible to get hold of the data again. Keeping this in mind, we have implemented archiving the message context when setting the action is taken on instances. In BizTalk360 Settings>System Settings, Archive and Download location of message instances must be configured to archive and download the message instances. Automatic actions with desired backup steps are been taken to make sure all the data are preserved before taking any action.
Note: In order take action on suspended service instances the monitoring service account has to be created as superuser in BizTalk360.
In Data Monitoring dashboard, every monitoring cycle status is shown. When the user clicks on the status tab, it will bring the details about the Query result, Task Action and Exception summary.
In Task Action tab, you can download each instance separately or by using “Click here” button you can download all the instances to the server location. Service Instances messages are download in server location as Zip file with activity ID for the monitoring run cycle.
Conclusion
Data Monitoring, an Auto-Monitoring feature of BizTalk Administration which can take corrective actions with all backup steps in the event of any threshold violations. With just a one-time setting we have our BizTalk360 to make sure all your routine tasks are addressed without a manual intervention. Also, BizTalk360 offers much more monitoring features which will enable all administrators to be pro-actively monitoring the BizTalk environment(s). Next article will see the Auto correction on BizTalk Artifacts and Logic Apps.
Author: Senthil Palanisamy
Senthil Palanisamy is the Technical Lead at BizTalk360 having 12 years of experience in Microsoft Technologies. Worked various products across domains like Health Care, Energy and Retail. View all posts by Senthil Palanisamy