This post was originally published here
What is BizTalk Host Throttling?
BizTalk Server being a Middleware product connected to various legacy backend systems it needs to make sure the entire ecosystem can work in an optimal way. If one of the legacy system connected to BizTalk is slow for any reason, then BizTalk Server need to act sensibly not to overload that system with messages more than what it can handle. In such scenarios, BizTalk Server will throttle itself (slow down itself) and make sure the messages are delivered to the backend in an optimal rate.
BizTalk Server achieves this capability by continuously monitoring various performance counters (memory footprint, thread count, message publishing rates, database size etc.) and self tuning itself. There are over 50 performance counters related to throttling in BizTalk Server which monitors both inbound and outbound traffic.
BizTalk360 Throttling Analyser
One of the challenges for BizTalk Server Administrators when it comes to BizTalk Throttling is, there is no out of the box tooling from Microsoft to understand whether your BizTalk Environment is working efficiently or under throttling condition. You only have raw performance counters to measure throttling. Typically the BizTalk Administrators open up Windows Perfmon tool and add all the performance counters related to Throttling record and analyse throttling conditions. This requires extensive knowledge about how BizTalk Server works, various throttling counters & conditions, whether it’s running on optimum level etc.
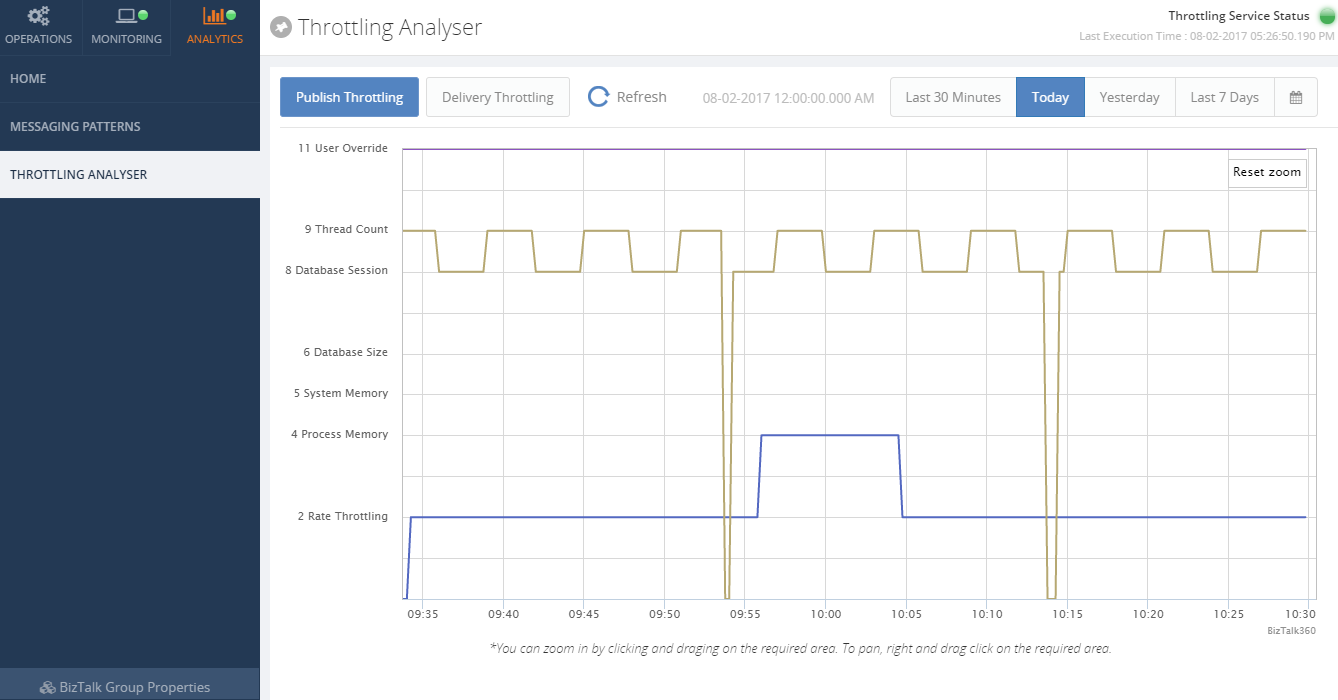
To address this issue, about 2 years ago we introduced “Throttling Analyser” in BizTalk360. Once enabled, BizTalk360 continuously collect all the throttling related performance counter data in our database and provide an intuitive user interface with highly interactive graphs to showcase whether the BizTalk Environment is working efficiently or under throttling condition. This saves a lot of time for BizTalk Administrators to understand environment throttling condition and the biggest advantage is you do not need to have in-depth knowledge about BizTalk Server internal architecture and throttling mechanism.
BizTalk360 Throttling Monitoring
The Throttling Analyser explained in the previous section only gives you the visual representation of the BizTalk Environment throttling condition. The BizTalk Administrator need to periodically log in to the system to see if the environment is healthy. However, we can clearly see a value in alerting the BizTalk Administrators if the environment is suffering from any critical throttling conditions for a perceived time.
That’s exactly what we have done with “Throttling Monitoring” in version 8.5 of BizTalk360. We wanted to make the experience super simple and intuitive.
How does it work?
Let’s take a close look at how this functionality is designed and how it works.
Under BizTalk Environment monitoring section we introduced a new category called “Host Throttling”, which by default will list out all the BizTalk Hosts that’s currently configured in the environment as shown in the below picture.
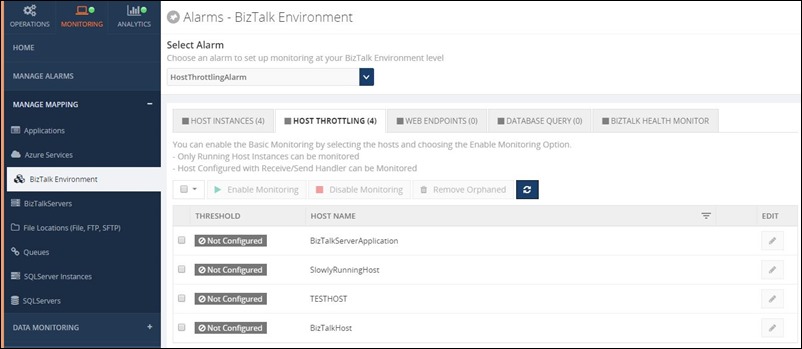
Enabling BizTalk Host Throttling monitoring in single click
You can enable default throttling for all the BizTalk Hosts in a single click, you simply select the hosts you wanted to monitor and click the button “Enable Throttling”, this will start monitoring the BizTalk Environment for any throttling violation that persist for 60 seconds.
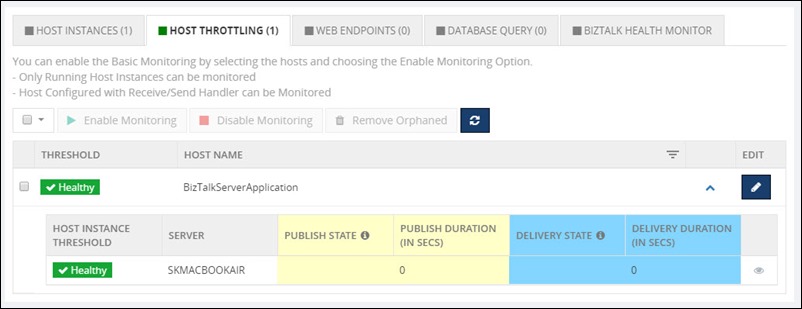
The whole idea for us is to make it as simple as possible to monitoring BizTalk Throttling condition, hence we provide the option to just enable the default monitoring with 60 seconds persistence in a single click.
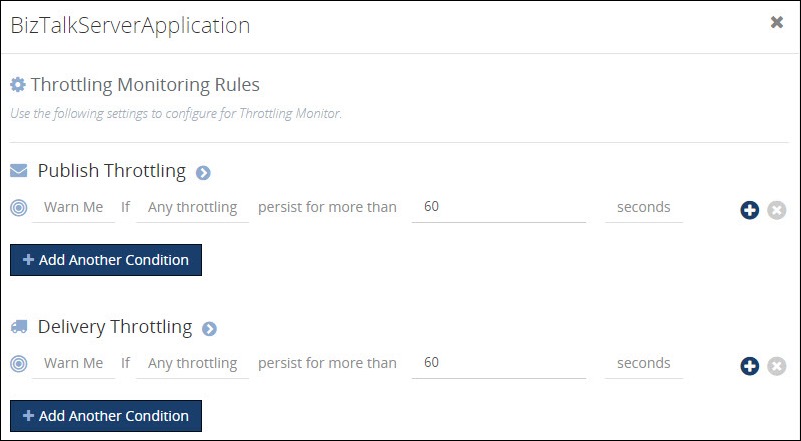
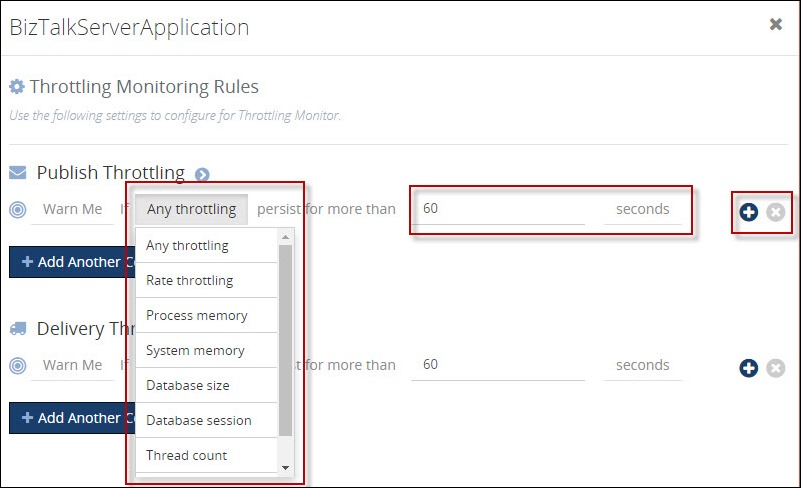
The BizTalk Administrator can easily tweak the default configuration by clicking on the “Edit” button and changing the parameters. As you can see from the below picture, you can choose to monitor specific throttling condition or you can have multiple conditions with different persist duration etc, you can also have different monitoring options for publish side and delivery side.
For Publish Throttling, the user can able to monitor the following metrics:
- Any throttling
- 2 – Rate Throttling
- 4 – Process memory
- 5 – System memory
- 6 – Database size
- 8 – Database session
- 9 – Thread count
- 11 – User override
For Delivery Throttling, the user can able to monitor the following metrics:
- Any throttling
- 1 – Rate Throttling
- 4 – Process memory
- 5 – System memory
- 9 – Thread count
- 10 – User override
Notification of Throttling violation
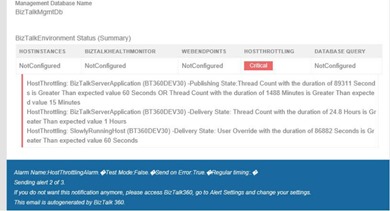
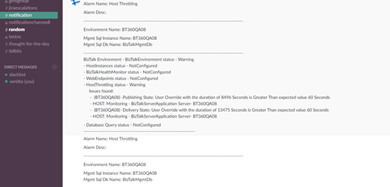
Once the settings are configured to look out for throttling conditions, BizTalk360 will keep monitoring the environment. If BizTalk360 detects any threshold conditions violation, it will notify the users via configured notification channels. In BizTalk360, there are various notification channels like Email, Slack, ServiceNow, SMS, Event Viewer, Web Hook etc
| Email Notification | Slack Notification |
 |
 |
Summary
Threshold monitoring is one of the key features we have introduced and it address one of the important areas of BizTalk Server Operations and Monitoring. This will help customers to keep an eye on the capacity of their BizTalk Environments in near real time and take appropriate actions.
You can write to us at support@biztalk360.com. Have a try at our latest version by downloading a 14-day free trial of BizTalk360.
