This post was originally published here
We, the product support team, often receive different types of support cases reported by the customers. Some of them may be functional, others may be related to installation and so on. Every support case is a new learning experience and we put in our best efforts to resolve the issues, thereby providing a better experience to the customers. As the below quotes say,
“Customer success is simply ensuring that our customers achieve their desired outcome through their interactions with our company” – Lincoln Murphy
We must make sure that we are taking the customers in the right direction when they raise an issue and must give them confidence about the product as well as service.
As already known, BizTalk360 is the one stop monitoring tool for BizTalk server. BizTalk360 not only contains the monitoring options for BizTalk server, in turn contains other in-built tools as well such as BAM, BRE etc. Whenever an issue is reported by the customer, we start our investigation from the basic troubleshooting steps. Hope it would be interesting to know what are the basic troubleshooting that we do. Yes, it would be. In this blog, I will share the information about the basic troubleshooting tools that we have in BizTalk360 that help us in resolving the customer issues.
Installer Log Information:
The first step in using BizTalk360 is the installation and configuration. The installation, as well as the upgrade process, is seamless with simple steps and some of the permission checks are done in the installer. But there may be some cases where the installer may fail with the below error.
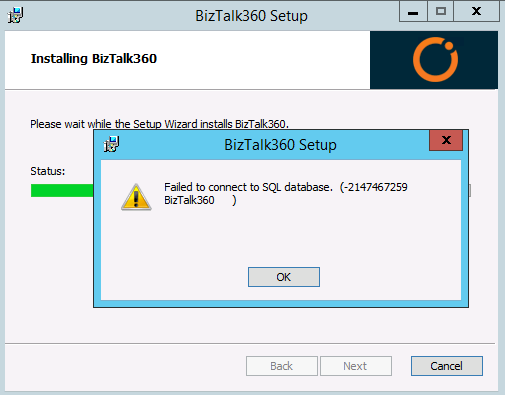
There is no much information about the error on the screen. So how do we check this error? Here comes the Installer logs for our help. Generally, when we install BizTalk360, we just give the name of the MSI in the admin command prompt and run it. But to enable installer logs we need to run the installer with the below command with the BizTalk360 version number.
msiexec /i “BizTalk360.Setup.Enterprise.msi” /l*v install.log
The installer log location can also be provided in the command, else the log will be created in the same folder where the MSI file is located. The steps performed during the installation will be logged in the installer log. The log will also contain information about any exception thrown. So, for the above error, the logged information was:
MSI (s) (E0:D4) [13:57:50:776]: PROPERTY CHANGE: Modifying CONNECTION_ERROR property. Its current value is ‘dummy’. Its new value: ‘Cannot open database “BizTalk360” requested by the login. The login failed.
Login failed for user ‘CORPsvcbiztalk360′.’.
The error clearly states that it is a permission issue. When BizTalk360 is installed, the BizTalk360 database gets created in the SQL server. BizTalk360 may be installed on the same machine where BizTalk server resides, or in a standalone machine and the SQL database may be on a separate server. As a prerequisite for BizTalk360, we recommend providing the SYSADMIN permission for the service account on the SQL server. Giving this permission to the service account resolves the above error. Hence, any installation related error information can be identified from the installer logs and can be resolved.
Troubleshooter:
This is an interesting tool which is integrated within BizTalk360 and available as a separate window-based tool. contains an extensive set of rules to verify all the prerequisite conditions in order to successfully run BizTalk360. As you can see in the below picture, the user just enters the password for IIS application pool identity and monitoring service account and clicks the “Troubleshoot BizTalk360” button. The rules will be verified and results will be indicated in the form of RED/GREEN/ORANGE.
This way, we can check the missing permissions for the BizTalk360 service account and provide the same.
Apart from the permissions, the other checks done by the troubleshooter are:
- IIS Check
- SQL Select Permission check
- Configuration File check
- Database report
If the customer faces any issue during the initial launch of the application, then they can run the troubleshooter and check for the permissions. Once the errors are resolved and everything is green, they can start BizTalk360 and it should work.
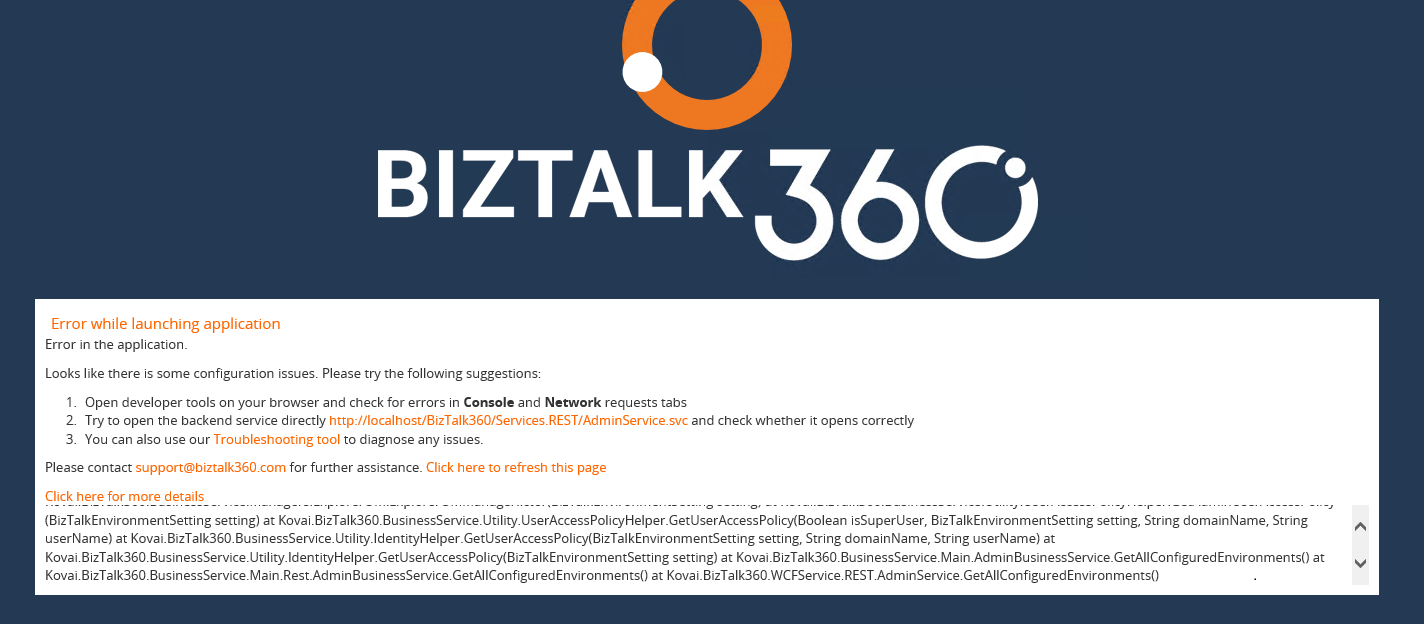
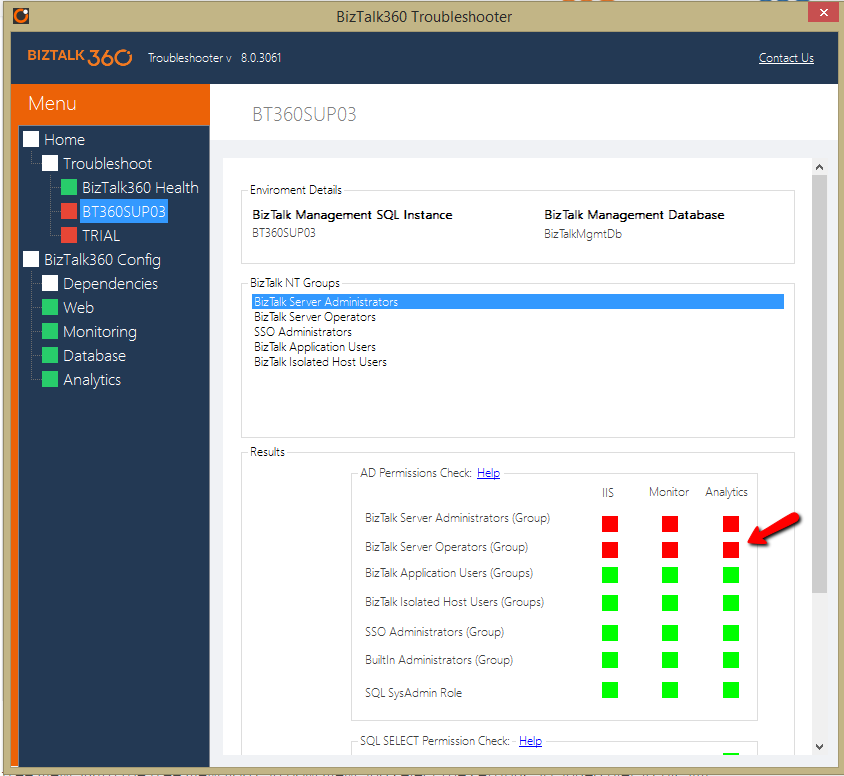
Hence all the information regarding the service account permissions, BizTalk360 configuration and database can be obtained with the help of troubleshooter. The integrated troubleshooter can be accessed from BizTalk360 itself as seen below.
BizTalk360 Service Logs:
The details of the exceptions that occur in BizTalk360 are captured in the log files that are generated in the BizTalk360 folder. The logs files not only contain the information of the exceptions, but they also contain the information about the alarm processing and the subservices statuses. There are different logs for each of them which are described below.
Monitoring Logs
Monitoring is one of the most important tasks performed in BizTalk360. There are new features getting added in every release of BizTalk360. The monitoring capability is also extended to File Locations, Host Throttling monitoring, BizTalk server high availability and much more. The BizTalk360 monitoring service is installed along with the BizTalk360 web application. Once the artefacts are configured for monitoring, the service runs every 60 seconds and triggers alert emails according to the conditions configured.
What happens if there occurs some exception during the monitoring and alerts are not triggered? Where can we find the information about these exceptions and take necessary actions? Here come the service logs that are located in BizTalk360 installation folder/Service/Log folder. There are about 25 different logs that get generated for each monitoring configuration separately and get updated whenever the monitoring service runs. Say for example, if the alerts are created, but not transmitted due to an exception, this information will be logged in the BizTalk360.SendMail.log file. So, when the customer raises an issue regarding the transmission of alerts, the support team starts the investigation from the logs. We ask the customers to share the logs from their environment and we check them. Let’s look at a customer scenario.
One of the issues came up such that:
- The customer has configured a receive port for process monitoring
- But they are getting Actual count = -1 even when there are messages processed via this port.
- They wanted to know the reason why the actual count was -1.
In BizTalk360, the negative value denotes that there has been some exception occurring. And, the exception would be logged in to the service logs. Hence, we asked them to share the logs.
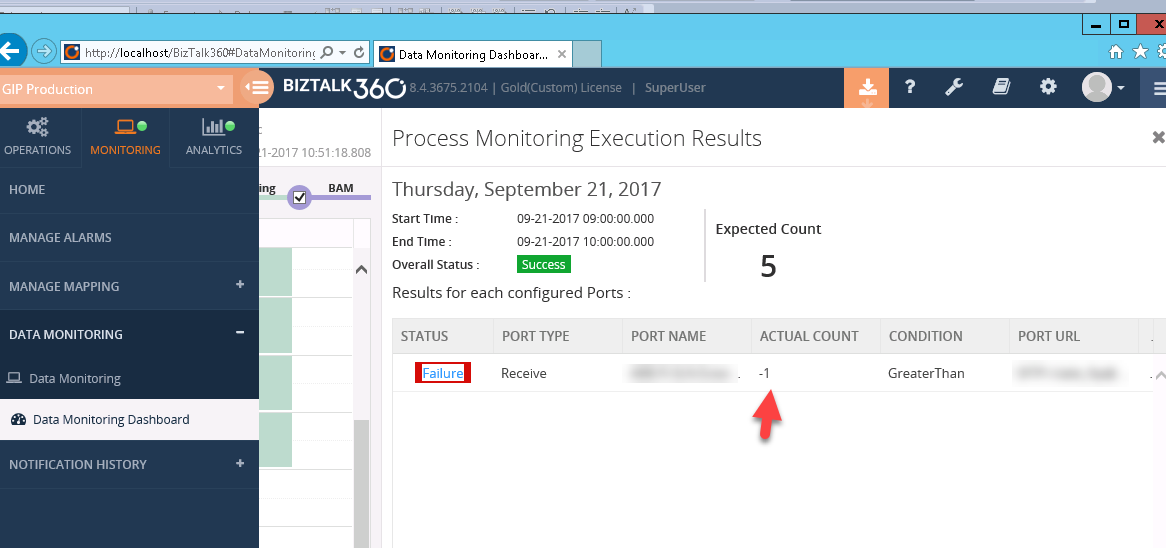
From the BizTalk360.ProcessMonitor.log, we could see the following exception:
2017-09-21 10:16:45 ERROR – ProcessMonitoringHelper:GetMonitoringStatus. Alarm Name:PROD_DataMonitor: Name: Application : Atleast 20 Messages from DHL per hour: Exception:System.Data.SqlClient.SqlException (0x80131904): Timeout expired. The timeout period elapsed prior to completion of the operation or the server is not responding. —> System.ComponentModel.Win32Exception (0x80004005): The wait operation timed out at System.Data.SqlClient.SqlConnection.OnError(SqlException exception, Boolean breakConnection, Action`1 wrapCloseInAction)
The timeout exception generally happens when there is a huge volume of data in the BizTalkDTADb database since for Process Monitoring, we retrieve the results from this database and display it in BizTalk360. The database size was checked at their end and found to be 15 GB which was greater than the expected size of 10 GB. For more information on the database size, you can refer here.
Similarly, we have different log files generated from which we can get the information about the different sub services running for BizTalk360 Monitor and BizTalk360 Analytics services.
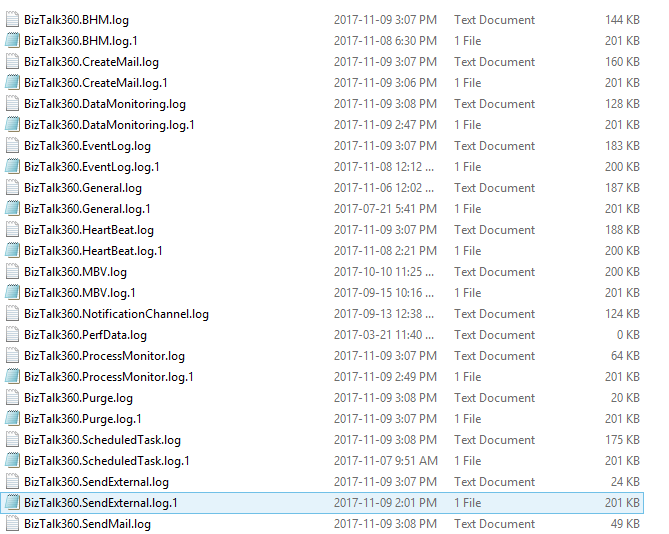

We can also check if all the subservices are started properly. The log information is captured along with the timestamp and this would make much easier for the support team to identify the cause and resolve the issues in time, thereby making the customer happy. In case of monitoring logs, the Alarm name and configurations are also captured. There are separate logs for Process Monitoring and other Data Monitoring alarms. We have separate logs for FTP and SFTP monitoring too for capturing the exceptions if any.
Analytics logs
Analytics is yet another important feature in BizTalk360 with help of which you can visualize a lot of interesting facts about your BizTalk environment like number of messages processed, failure rate at message type level, BizTalk server CPU/Memory performances, BizTalk process (host instances, SSO, rules engine, EDI etc) CPU/memory utilization and lots more. BizTalk360 Analytics service also contains different sub services run and any exception occurring for these services will be captured in the logs under C:Program Files (x86)Kovai LtdBizTalk360AnalyticsLog folder.
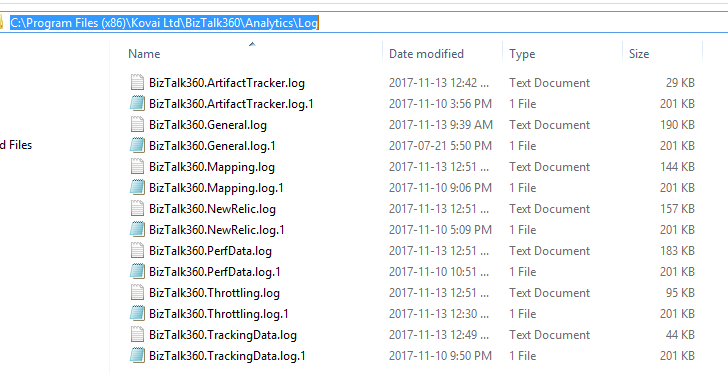
BizTalk360 Analytics is used to gather the information about the performance counters in the server and display them in the form of widgets. Also, BizTalk360 will display the information if the system is under throttling condition in a graphical format. There was a case from the customer that the Throttling Analyser was not displaying any formation when the system was under throttling condition. We then checked the logs and found the below error in the BizTalk360.Throttling.log.

From the logs, we could understand that the performance counters were corrupted and rebuilding the counters resolved the issue.
Web and Svc logs
At times, there are scenarios where a page in BizTalk360 may take some time to get loaded leading to performance issues. The time taken to load the page can be captured in the svc logs present in C:Program Files (x86)Kovai LtdBizTalk360Web folder.
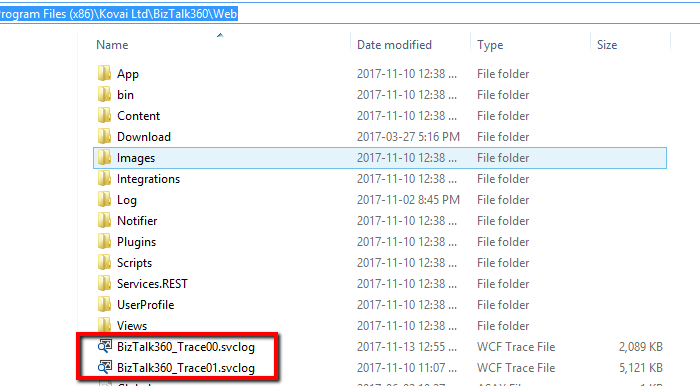
Once a customer reported that there was performance latency in some of the BizTalk360 pages. We checked these trace logs and found that the service calls GetUserAccessPolicy & GetProfileInfo methods were taking more than 30 seconds to get resolved.
GetUserAccessPolicy–>Groups/user assigned to provide access to the features of BizTalk360.
GetUserProfile –> Fetch the UserProfile of the group/user been configured.
These methods were then optimized for caching in the next BizTalk360 version release and hence the performance issue was resolved.
BizTalk360 subservices status
As mentioned before, we have different subservices running for BizTalk360 Monitor and Analytics services. In case, if there is any problem in receiving alerts or if the service is not running, the first step would be to check for the status of the monitoring subservices for any exceptions. This can be found in BizTalk360 Settings -> BizTalk360 Health -> Monitoring Service Status. The complete information will also be captured in the logs.
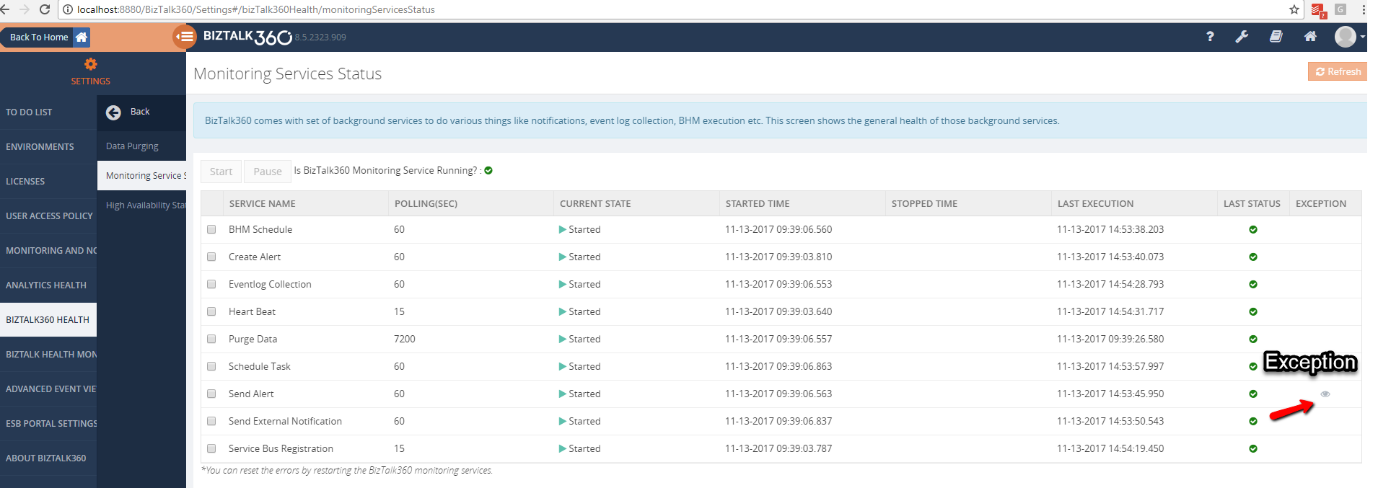
Similarly, we have the check for the Analytics sub services under Settings -> Analytics Health.
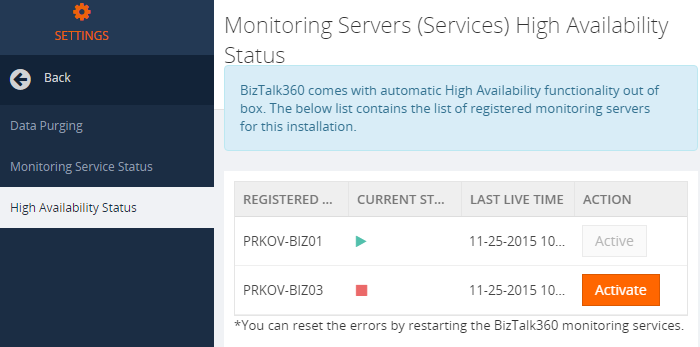
What if the customer has configured BizTalk360 under High Availability(HA)? High Availability is the scenario where BizTalk360 is installed on more than one servers pointing to the same database. The BizTalk360 Monitor and Analytics services can also be configured for HA. So, when there is an issue reported with these services, the logs from the active server must be investigated. The active server can be identified from BizTalk360 Settings -> BizTalk360 Health -> High Availability Status.
Conclusion:
These basic troubleshooting tools available in BizTalk360 make our support a little easier in resolving the customer issues. The first step analysis can be done with these tools which help us identify the root cause of the problem. We have our latest release BizTalk360 v8.6 coming up in a few weeks with more exciting features. In case of further queries, you can write to us at support@biztalk360.com.
