
by Lex Hegt | Apr 24, 2018 | BizTalk Community Blogs via Syndication
This blog is a part of the series of blog articles we are publishing on the topic “Why we built XYZ feature in BizTalk360”.

Why do we need this feature?
Being able to track messages and processes in middleware software like BizTalk Server can be used for few reasons, amongst them are:
- be sure all processes run like expected
- analysis of issues
- debugging during development/test phase
However, especially for live environments, the best practice is that only limited tracking should be turned on, to prevent a performance penalty. Therefore, there needs to be a balance between the amount of tracking which is turned on and the ability for the BizTalk administrator to be able to do his job when it comes to analysis of issues.
In general, when no message context/content tracking is turned on and only the default tracking is switched on, you should be good.
To prevent performance penalties, it is obvious that it helps to have a good overview of all the tracking settings of the BizTalk environment.
What are the current challenges?
All BizTalk Server related tracking settings can be maintained in the BizTalk Server Administration console. However, the tracking settings are found in different parts of the console. For example:
- the Group Level Tracking property is found in the BizTalk Group Settings Dashboard
- the BizTalk artifact settings are found at application/artifact level
- Each artifact like (receive ports, send ports, orchestrations, pipelines etc) all come with their own UI to manage tracking.
This results in not having a good overview and easy maintenance of the tracking settings with the standard BizTalk Server Administration console.
How BizTalk360 solves this problem?
At BizTalk360 we decided to design one screen, which can be used for all tracking settings, enabling to have a good overview of all the tracking settings, meanwhile working as a central hub to configure all these settings.
We came up with the Tracking Manager screen, which can be found in BizTalk360 under Operations / Infrastructure setting.
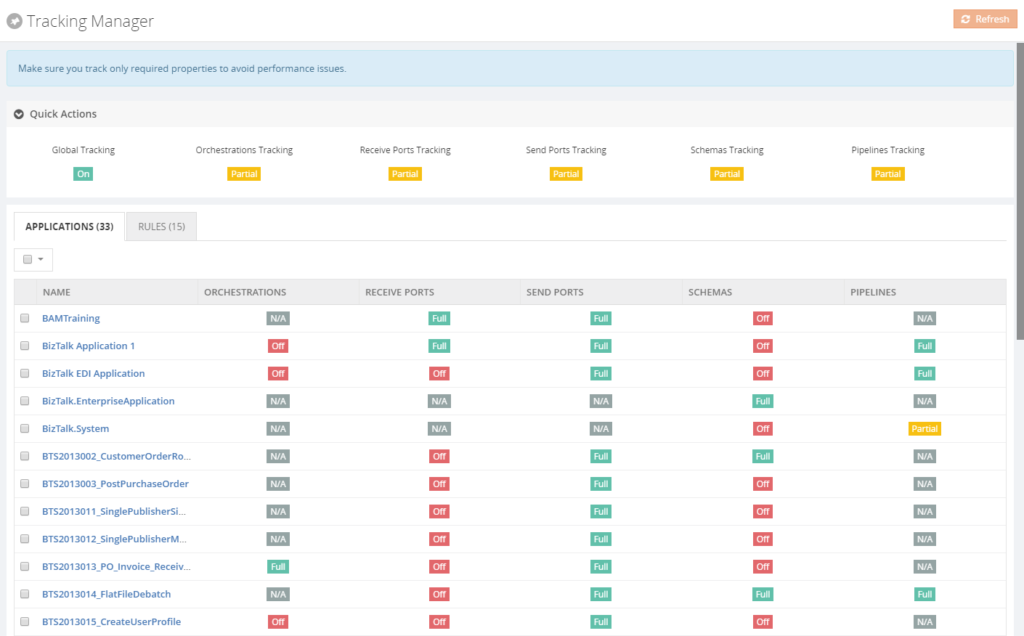
As you can see from the screen, it contains an overview of all tracking settings. On a high level, the screen is divided into two parts:
- Quick actions
- Applications and Rules
The Quick actions allow you to easily turn on/off tracking on a global level for the BizTalk artifact types, but also to turn on/off group level tracking.
The second part of the screen allows you to view/configure tracking until the application level. If a more fine-grained configuration is needed, you can simply click on the application and set the desired tracking for one or multiple artifacts at once. The overall result of the settings will be reflected in above screen.
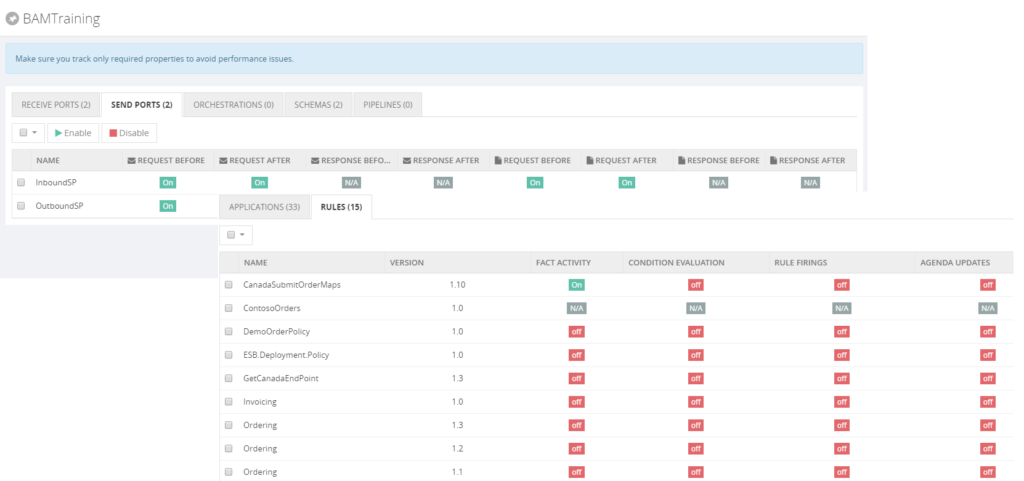
Also, maybe less familiar, Business Rules can be tracked. BizTalk360 enables you to easily configure these settings from the Rules tab page.
All in all, we can conclude that the Tracking Manager in BizTalk360 gives easy access and maintenance to all the tracking settings for BizTalk Administrators.
Get started with a Free Trial today!
Download and try BizTalk360 on your own environments free for 30 days. The installation will not take more than 5-10 minutes.
Author: Lex Hegt
Lex Hegt works in the IT sector for more than 25 years, mainly in roles as developer and administrator. He works with BizTalk since BizTalk Server 2004. Currently he is a Technical Lead at BizTalk360. View all posts by Lex Hegt
by Lex Hegt | Apr 18, 2018 | BizTalk Community Blogs via Syndication
This blog is a part of the series of blog articles we are publishing on the topic “Why we built XYZ feature in BizTalk360“.

Why do we need this feature?
Microsoft BizTalk Server is a powerful middleware product which allows integrating all kind of information systems, independent of whether these systems are on-premise or in the cloud. BizTalk Server uses Receive and Send ports to communicate with a broad set of on-premise/cloud systems, both on the technology level (FILE, FTP, POP3, SMTP, etc.) as on the business level (ERP, CRM, etc.).
Besides just receiving and transmitting messages, BizTalk solutions might also contain Orchestrations, which can process all kind of business logic, for example, Order processing, Credit card validation, Claims processing etc.
As BizTalk Server is very scalable, a BizTalk environment can contain many deployments for all kind of different integrations. All together a BizTalk environment may contain hundreds of ports and orchestrations. The well-being of these artifacts is of vital importance to have the integrations working properly. When not running properly, these interruptions may cause serious damage to the business processes they support.
What are the current challenges?
To be well aware of the state of the BizTalk artifacts, the BizTalk administrator needs to consult the BizTalk Administration console multiple times per day. However, there are few challenges when depending on the BizTalk Administration console for checking the state of these artifacts.
Access to the Administration console – Often, the BizTalk Administration console is only installed on the BizTalk servers. Besides that there is the risk of unintended damaging the BizTalk server while accessing the server, you need to be authorized to access the servers. Not to be forgotten, is the fact that it constantly takes time to setup Remote Desktop connections to access the BizTalk server and the Administration console. Time which can easily be used for something more tangible.
Not suited for less experienced administrators – The Administration console is such a powerful tool, which is great when you are an experienced BizTalk Administrator. However, in the hands of less experienced administrators, unintentionally a lot of damage can be done. Think of for example stopping ports or terminating processes!
Not an efficient way of monitoring – Checking the state of the ports and orchestrations manually, multiple times per day, is just not efficient. It can easily be forgotten in the rush of the day, thereby putting the wellbeing of your integrations at stake.
Too many artifacts to monitor efficiently – BizTalk environments can contain hundreds of ports and orchestrations. In most scenarios, the artifacts should be in the Enabled/Started state. But there can be several reasons why certain artifacts are not in the expected state. Just to mention a few:
- After the deployment of an update of a BizTalk application the artifacts are in a wrong state
- Due to a temporary maintenance window, some of the artifacts need not be in the Enabled/Started state, to prevent suspended instances
- Artifacts might be Disabled as a result of a temporary outage
- Certain artifacts need only be Enabled/Started as a fall back scenario
By the given examples, it must be clear, that it can be very challenging to constantly be aware of the desired state of all the artifacts. This makes it hard to manually monitor the state of the artifacts in an efficient way.
Instead of having to monitor BizTalk manually, it is much more efficient to have automated, state-bound, artifact monitoring. Automated BizTalk monitoring will prevent you of constantly having to check for the state manually, enabling you to spend your time on more important activities. In the next section, we’ll show which features BizTalk360 has, to allow you to automatically monitor your BizTalk artifacts.
How BizTalk360 solves this problem?
To give you that comforting feeling that you are in control over the state of your ports and orchestrations, BizTalk360 provides multiple features.
Threshold Monitoring – While using the concept of Threshold Monitoring, BizTalk360 allows you to setup state-bound monitoring. This means that you can easily setup monitoring to have the product check for the Expected state of your ports and orchestrations.
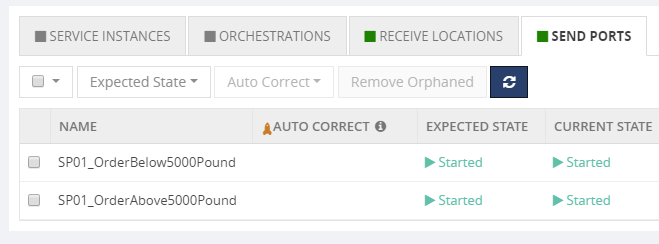
In above screenshot, you can see how some Send Ports are being monitored against their Expected State. Once, the Current State deviates from the Expected State, a threshold violation has occurred and BizTalk360 will notify you of that fact.
Positive and Negative monitoring – In most scenarios, the Expected State of your Ports and Orchestrations will be Enabled/Started; which is called Positive Monitoring. However, there might be valid reasons that certain ports/orchestrations need NOT be Enabled/Started. Setting up that kind of monitoring is called Negative Monitoring. BizTalk360 allows to setup for both Positive and negative Monitoring.
Receiving Notifications via multiple channels – Once a threshold violation has occurred, by default, you will receive notifications by email. Moving forward, BizTalk360 also allows you to receive notifications via multiple other channels.
We are constantly considering new ways to send notifications, but currently, the following Notification Channels are provided out-of-the-box: Email, SMS, Event Log, Slack, Microsoft Teams, ServiceNow, HP Operations Manager, Webhook. In addition, you can build your own custom notification channel like writing to a database, calling an internal system etc.
Auto Correct – BizTalk360 not just monitors your artifacts, it can also try to bring the artifacts back to their Expected state, once there is a mismatch between the Current State and the Expected State. Think of for example that FTP Receive Location which goes down at night or during the weekend.
The Auto-Correct feature works for the following artifacts:
- Receive Locations
- Orchestrations
- Send Ports
- BizTalk Host Instances
- Windows NT Services
- SQL Server Agent Jobs
- Azure Logic Apps
There is an extensive article on BizTalk360 Auto correct, which also explains in which kind of scenarios this feature comes at hand. You can that article here:
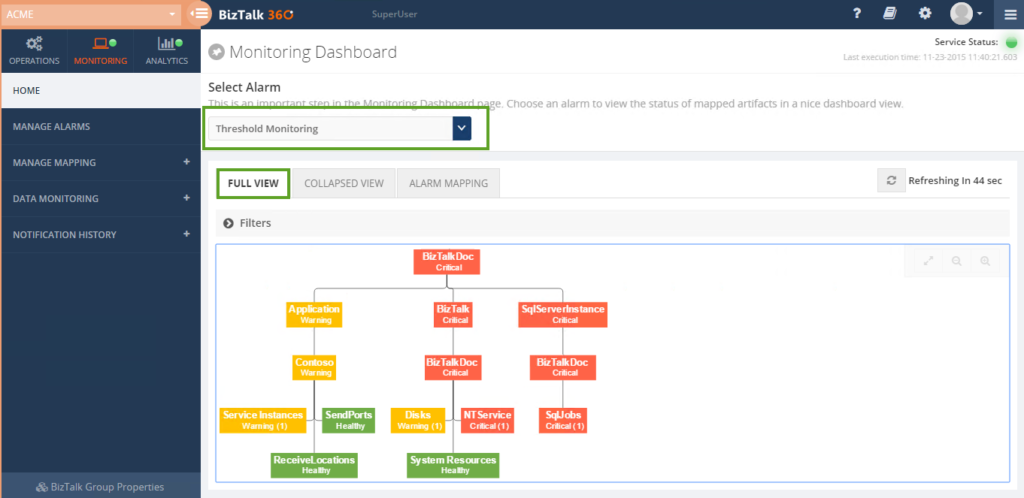
Monitoring Dashboard – Although receiving notifications of any mismatches between the Current State and the Expected State is very handy, it will equally be handy to have a large screen, at for example the Support Desk, which simply shows the current health of your artifacts. For this, we bring the Monitoring Dashboard, which does exactly that.
As you can see from below screenshot, it brings you a nice Expandable/Collapsible and filterable treeview, with automatic refresh, thereby constantly showing the current state of the artifacts.
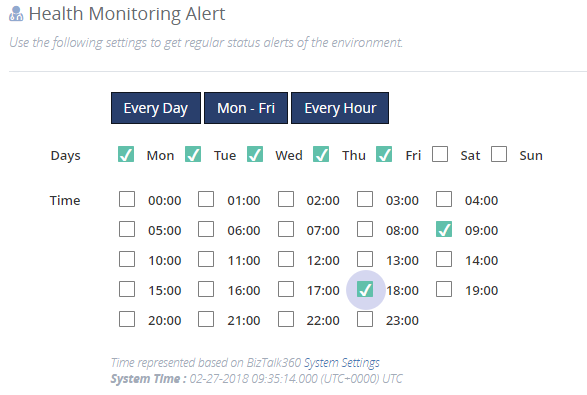
Health Check Reports – Last but not least, are the Health Check Reports you can receive at your convenient timing. These reports function as your daily health check, providing you with an overview of the state of all the artifacts from your alarm. Very handy to receive for example at the beginning of your working day!
Conclusion
In this article, we have seen why being aware of the state of your ports and orchestrations is important. We have also seen why manually monitoring that state is very inefficient and sometimes very complex. As a company which knows these challenges from our own experiences, we have brought multiple features which will help the BizTalk administrator being in control, without having to manually check the state.
Get started with a Free Trial today!
Download and try BizTalk360 on your own environments free for 30 days. The installation will not take more than 5-10 minutes.
Author: Lex Hegt
Lex Hegt works in the IT sector for more than 25 years, mainly in roles as developer and administrator. He works with BizTalk since BizTalk Server 2004. Currently he is a Technical Lead at BizTalk360. View all posts by Lex Hegt

by Lex Hegt | Apr 11, 2018 | BizTalk Community Blogs via Syndication
This blog is a part of the series of blog articles we are publishing on the topic “Why we built XYZ feature in BizTalk360”.
Why do we need this feature?
In the day to day activities of a BizTalk administrator, you might come across integrations where FTP sites are used for receiving and transmitting messages. FTP sites are often used for cross-platform integrations. For example, when you have an SAP system on Unix that has to be integrated, via BizTalk Server, with other systems, you might use FTP for receiving and transmitting of messages.
SFTP & FTPS are just the secured version of FTP with advanced transport encryption mechanisms, so your end-to-end data transmission is secure and safe.
To keep the business process going, it can be of vital importance that the FTP/SFTP sites are online and the messages are being picked up. So, when a BizTalk administrator needs to be constantly aware whether the FTP/SFTP sites are online and working properly, the administrator needs to monitor the sites and the activities which take place on these sites.
What are the current challenges?
BizTalk Server offers no monitoring capabilities, not for Receive Locations / Send Ports and also not for endpoints like FTP, SFTP and FTPS sites. So, using just the out-of-the-box features of BizTalk Server, a BizTalk administrator will have to manually check whether the FTP sites are online and whether all (appropriate) files are being picked up for further processing.
Manual monitoring
This kind of manual monitoring can be quite cumbersome and time-consuming. The administrator will probably use multiple pieces of software to be able to perform these tasks. Think of for example the BizTalk Administration console to check whether the Receive Locations/Send Ports are up and some FTP client to check whether files are being picked up.
It is obvious that this is not a very efficient scenario, which could easily be automated by setting up monitoring.
Maintaining scripts for monitoring FTP sites
To reduce their workload, we experience that BizTalk administrators are creating their own scripts to monitor FTP sites and all kind of other resources. Although this kind of scripts certainly can be of help, we still think this does not fully solve the problem.
For example, often these kinds of scripts need maintenance when FTP sites need to be added, changed or deleted from monitoring. This kind of tasks can be easily forgotten.
Also from a knowledge transfer perspective, it’s easy to forget to update new colleagues about the existence of this kind of scripts, as they will probably be installed on some (monitoring) server.
Another challenge with solving this kind of problems with scripts is that not each administrator is capable to write this kind of scripts, which makes knowledge transfer even harder.
To keep the overview, we think that it is easier to use software, like BizTalk360, to have everything in one easily accessible place, with good visibility of all the features/capabilities, fine-grained security/auditing and without the need to maintain custom scripts etc..
How BizTalk360 solves this problem?
With BizTalk360, we make monitoring of FTP/SFTP/FTPS sites a lot easier. For a very long time, the product offers monitoring of Receive Locations and Send Ports, but for some time now, BizTalk360 also offers to monitor of the physical FTP/SFTP/FTPS endpoints.
We wanted to make setting up this kind of endpoint monitoring as seamless as possible and therefore we simply show all the ports in the current BizTalk group which make use of the FTP/SFTP/FTPS adapter.
In BizTalk360, you can find FTP monitoring under Monitoring => Manage Mapping => File Locations (File, FTP, SFTP).
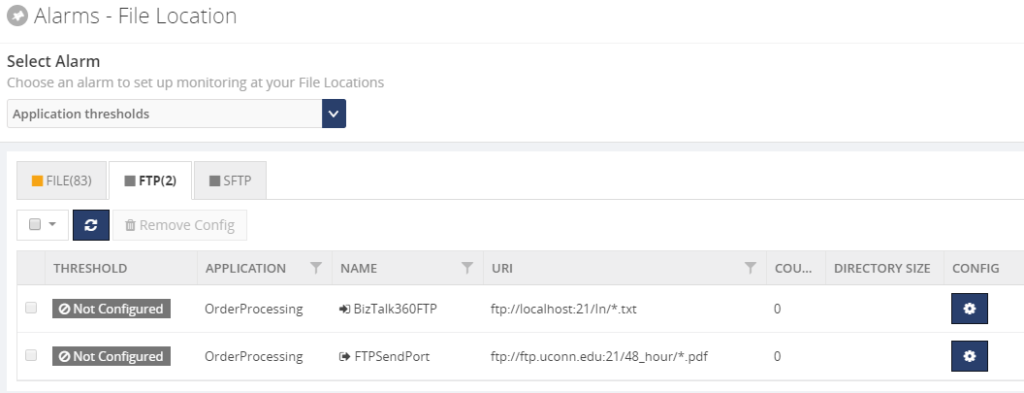 Next, you can set up monitoring rules based on File Count and Directory Size and have BizTalk360 send Warning or Error notifications through the notification channels which are configured on the associated alarm.
A fully monitored FTP endpoint might look like shown below.
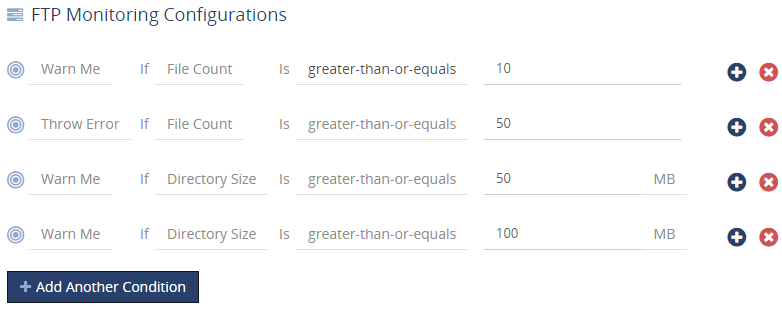
Of course, besides the greater-than-or-equals operator, also other common operators are available.
Conclusion
As a final point, we see from time to time that administration teams maintain a administrators handbook, which contains all the tasks a (BizTalk) administrator should take care of. We think that by using software like BizTalk360, we can reduce the number of pages in such handbooks, as the kind of scripts we mentioned no more have to be described in that kind of books.
This description could be replaced by, for example, a general guideline on how FTP sites should become monitored and the monitoring rules with BizTalk360.
As a result, we hope to make the work of BizTalk administrators a bit easier so the team can focus on the more exciting parts of the job of BizTalk administrators, instead of constantly having to update their handbooks.
So, we think that we make the day to day life of a BizTalk administrator, who needs to monitor the well-being of FTP sites, a little bit easier by bringing this feature.
If you want to read more on FTP/SFTP monitoring in much more detail, you can check the following article:
FTP, FTPS, SFTP Location monitoring
BizTalk360 also offers an advanced monitoring capability called “Data Monitoring” which allows monitoring the traffic/volume of messages going through the ports for a given period, ex: expected 50 PO orders from our partner via FTP/SFTP. Please check out this article. Introducing BizTalk Server Data Monitoring in BizTalk360
Get started with a Free Trial today!
Download and try BizTalk360 on your own environments free for 30 days. Installation will not take more than 5-10 minutes.
Author: Lex Hegt
Lex Hegt works in the IT sector for more than 25 years, mainly in roles as developer and administrator. He works with BizTalk since BizTalk Server 2004. Currently he is a Technical Lead at BizTalk360. View all posts by Lex Hegt

by Lex Hegt | Apr 4, 2018 | BizTalk Community Blogs via Syndication
This blog is a part of the series of blog articles we are publishing on the topic “Why we built XYZ feature in BizTalk360”. Read the main article here.

Why do we need this feature?
On a daily base, our customers use BizTalk360 for a lot of their activities related to BizTalk operations and monitoring. However, in a number of scenarios, BizTalk administrators are faced with activities which need to be automated, for example: during the deployment of BizTalk Applications. It is easy to forget some tasks and doing them manually can be error-prone. So, it may be better to address such challenges in an automated way.
Here are some example automation scenarios in that can happen in your BizTalk Server environment
BizTalk Server Operations
- You might want to automatically stop certain Ports over the weekend, because of regular or temporary maintenance of internal or external systems
- External systems, like portals, might need BizTalk data/metrics on a regular basis, like information around EDI transactions, BizTalk usage or BizTalk performance metrics
- You want particular users to have easy access to download links for the messages of suspended instances, without having to give them access to BizTalk Server and/or BizTalk360
- You may want to Deploy/Publish a Business Rule Policy at a particular moment (additional discounts for the holiday season or laws to which should be complied as of a particular moment)
BizTalk Applications Maintenance and Deployment
- Before or after deployment of BizTalk Applications, you may want to automatically stop and start Host Instances
- After a deployment, you may want to set certain ports/orchestrations to a particular state
- You want to bring BizTalk down at a given date and time, due to system maintenance
Identity and Access Management
- Your organisation uses tooling for Identity and Access Management and you want to automatically create User Access Policies for accessing BizTalk360 and BizTalk
- For auditing purposes, you need to provide user lists and profiles and audit information on a regular bases
Because of the nature of this kind of scenarios, the administrators would need programmatically access to BizTalk server and rely on command files or PowerShell scripts to be able to fulfil the requirements.
What are the current options and challenges?
BizTalk Server comes with different tooling for programmatic access to BizTalk Server. This tooling is described below.
WMI and ExplorerOM
Let’s briefly discuss the purpose of both WMI and ExplorerOM:
- WMI (Windows Management Instrumentation) – an infrastructure, which comes with Windows, and which allows you to automate administrative tasks on (remote) computers. BizTalk Server comes with its own WMI management pack to do preliminary management activities like starting/stopping host instances, restarting ports etc.
- ExplorerOM – a DLL used to perform all kind of BizTalk Application related tasks like exploring the schemas, maps, orchestrations, operating on them like starting/stopping etc.
BizTalk PowerShell Provider
There is also a community initiative to provide a BizTalk PowerShell provider so you can execute some of the management tasks using PowerShell (since PS has become the core of any automated administrative tasks). However, the project is not actively maintained anymore and it’s not advisable to rely on this for any critical usage.
BizTalk Server 2016 Feature Packs
Starting with BizTalk Server 2016, Microsoft started to release Feature Packs. With the first Feature Pack (BizTalk Server 2016 Feature Pack 1). a unified API became available for BizTalk Server 2016 (not for earlier versions).
This Management API enables you to perform some of the scenarios which we mentioned in the first paragraph but still lacks API’s to do extensive automation. For example, stop and start host instances.
So, although BizTalk Server comes with multiple capabilities for programmatic access to BizTalk Server, writing and testing all kind of scripts is time-consuming and not all scenarios can be covered.
Even when these custom scripts seem to work nicely, non-functional requirements, like security, auditing and logging, are not taken into account in these kinds of scripts. This would leave you in the dark when something unexpected happens. Definitely, not a scenario where you want to be.
How BizTalk360 solves this problem?
BizTalk360 consists of multiple components, a responsive user interface, few backend services and a rich API service layer.
The API service layer consists of over 400 REST API operations. The user interface of BizTalk360 uses these extremely rich API’s to perform all the tasks to manage the BizTalk environment.
A couple of years ago, we thought, exposing our API’s will hugely help BizTalk Server Administrators to automate most of their routine activities we mentioned in the beginning. Hence we documented all the BizTalk360 API’s (which are of course the management and monitoring API’s for your BizTalk Environment) using swagger and live test within the BizTalk360 application.
The API currently contains 14 services with more than 400 API operations, covering a breath of management activities you can do on your BizTalk Environment. To give you a better understanding of the capabilities, these services are:
- ActivityMonitoringService – BAM related services
- BizTalkQueryService – Execute all kind of MessageBox and Tracking oriented queries
- AlertService – All kind of Monitoring related API’s
- BizTalkGroupService – BizTalk Platform oriented API’s
- SchedulerService – Data Monitoring Scheduler related API’s
- ESBManagementService – Exception Management related API’s
- AdvancedEventViewerService – API’s to query the Eventlog entries which are collected by the Advanced Event Viewer feature
- BizTalkApplicationService – Search for and action on BizTalk Application artifacts
- AdminService – Get and maintain all kind of settings within BizTalk360
- EDIManagementService – Get/Set EDI configuration and get EDI statistics
- EnvironmentMgmtService – API’s mainly for Knowledge Base and Dashboard management
- RulesEngineService – API’s for maintenance of Business Rules
- AnalyticsDataService – Analytics, Message Patterns and Throttling related API’s
- AzureService – Get/Operate on Logic Apps and get Integration Account artifacts
With the API you cannot just retrieve information from BizTalk via GET operations, but you can also action on BizTalk Server, BizTalk360 and even certain Azure services via POST operations.
Each API can be tried from the API documentation, which comes with a Swagger definition file, by using the Try it out! feature. This helps you testing with the required parameters. All you need to do is to choose the needed API, provide the needed parameters for the API, click the Try it out! button and view the results.
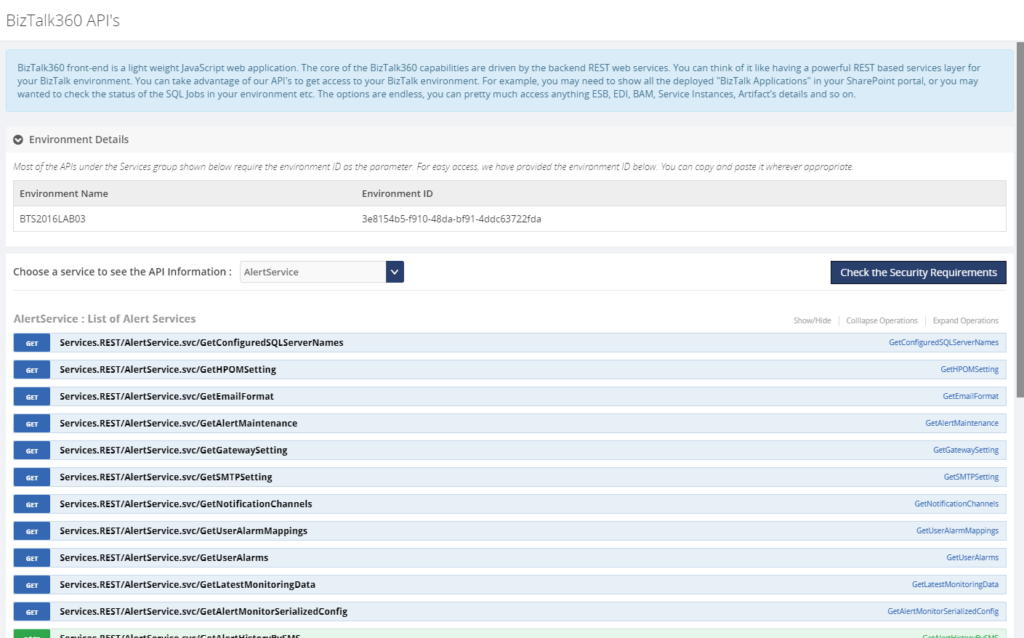
Let’s have a look at few examples of how you could make use of the API.
- Stop and start Host instances before and after deployment of BizTalk applications
- Disable/Enable Receive Locations and/or Stop/Start Orchestrations/Send Ports
- Get a list of currently deployed BizTalk Applications for Support purposes
- Get Event Log data of all the BizTalk servers in one go
- Get Throttling data from the BizTalk Hosts
- Get all kind of Performance metrics of your BizTalk system
- Test, Deploy, Undeploy and Publish Business Rules
- Disable/Enable BizTalk360 alarms during deployments
- Show data in an Operations Dashboard widget, for example, the state of your SQL jobs
- Automatically create BizTalk360 alarms during deployment of BizTalk applications
Conclusion
By using the BizTalk360 API and its documentation, the complexity from WMI and ExplorerOM is shielded from the user. Besides being able to act on BizTalk, the API also allows you to action on BizTalk360. You can even show the output of API calls in the Operations Dashboard!
Few examples of how the BizTalk360 API`s can be used in real-world scenarios: Automate Monitoring Alarm creation in BizTalk360
If you are using BTDF (BizTalk Deployment Framework) we have a wrapper console application called BT360Deploy that can be used to automate certain tasks like creating monitoring alerts during deployment. The project can be accessed here.
Get started with a Free Trial today
Why not give BizTalk360 a try. It takes about 10 minutes to install on your BizTalk environments and you can witness the benefits of auto-healing on your own BizTalk Environments. Get started with the free 30 days trial.
The post Why did we expose all of our BizTalk Operations and Management REST API’s? appeared first on BizTalk360.

by Lex Hegt | Feb 7, 2018 | BizTalk Community Blogs via Syndication

This blog is a part of the series of blog articles we are publishing on the topic “Why we built XYZ feature in BizTalk360”. Read the main article here.
Why do we need this feature?
Azure API Apps is a modern way of building web services hosted in Microsoft Azure. Out of the box it provides capabilities such as security, load balancing, auto-scaling, and automated management. You can also take advantage of its DevOps capabilities such as continuous deployment from VSTS, GitHub, Docker Hub, and other sources, package management, staging environments, custom domain, and SSL certificates.
In the context of Azure Logic Apps connectors, Azure API Apps plays a vital role. Sometimes there may not be an out of the box connector to an external system and you may need to wrap a web service on top of that external system to create a custom Azure Logic Apps connector. This article explains how you can easily Create a custom connector for a web API.
The Azure API App can contain multiple endpoints to be able to perform multiple actions like creating an order or requesting the status of an order.
The Azure API Apps are powerful building blocks for your hybrid integration scenarios. As these API Apps can be of critical importance, you should be well aware of the status of these API Apps.
What are the current challenges?
We have already seen why Azure API Apps are important building blocks and can be of vital importance for your integration scenarios. So, whether you are consuming the external Azure API Apps from other parties or you are exposing your own API Apps, depending on the importance of the Azure API App, it is equally important to constantly be aware of the state of the Azure API Apps and their endpoints.
The main challenge at the moment is the management and monitoring of Azure API Apps in isolation via the Azure Portal. You’ll miss the end to end context of the importance of the API App in your integration scenario.
For example, you might have an order processing system that uses few BizTalk Receive Locations, Orchestrations, Send Ports and few Azure API Apps connected via BizTalk WCF-REST/HTTP adapters and are part of the same end-to-end solution. If the Azure API App is down or returning errors, then your end-to-end purchase order solution is broken. It’s important to monitor the API Apps and understand the end to end context.
We address this challenge in BizTalk360 by providing a unified platform to monitor and manage both BizTalk artifacts and some of the key Azure artifacts which are important from the integration point of view.
How BizTalk360 solves this problem?
Depending on whether you want to monitor your own Azure API Apps or the API Apps which are exposed by others, BizTalk360 offers multiple methods to setup monitoring. This is due to the fact that to be able to monitor whether API Apps are enabled, you need access to the Azure subscription which contains these API Apps. In case of API Apps which are exposed by others, you won’t have access to that Azure subscription, so you’ll only be able to monitor the HTTP Endpoints of the API Apps.
To monitor API Apps from within BizTalk360, the product offers the following features:
- Azure API App of others – Web Endpoint monitoring
- Your own Azure API Apps – Azure API App monitoring
Web Endpoint Monitoring
If you are simply consuming the Azure API Apps from external parties, then they are not any different from a standard REST/HTTP web services. In this case, the BizTalk360 web endpoints monitoring solution will be sufficient. The features and capabilities of BizTalk360 Web Endpoint monitoring are described in the Why did we build Web Endpoints Monitoring in BizTalk360? article.
Azure API Apps Monitoring
If you are owning the Azure API Apps, then BizTalk360 provides a rich set of capabilities to monitor the Azure API Apps like auto-discovery of multiple endpoints and granular control on monitoring setup.
Monitoring API Apps from BizTalk360 consists of the following types of monitoring:
- State Monitoring – monitor whether the API Apps are Enabled/Disabled
- Endpoint Monitoring – monitor if the HTTP Endpoints of the API App are accessible
State Monitoring API Apps
From BizTalk360, you can monitor the state of API Apps. An API App can have the following 2 states:
- Enabled – the API App is active and can receive requests
- Disabled – the API App is disabled and cannot receive requests
With BizTalk360, you can monitor for both states and of course, we want to provide a monitoring experience which as seamless as possible. After you have selected the correct alarm and Azure subscription, it is just a matter of selecting the Azure API Apps and select the required expected state from the drop-down box. Once that’s done, BizTalk360 immediately starts to monitor the API App(s).
 Endpoint Monitoring
Azure API Apps basically are REST services which use JSON for data exchange. These REST services are the actual endpoints of the API Apps, which can be called by other systems. Each Azure API App has at least one endpoint but can contain many more endpoints.
BizTalk360 has a quite extended feature set for Web Endpoint Monitoring, and it comes with advanced capabilities like adding custom GET parameters and HTTP headers:
- Custom GET parameters – provide required/optional parameters
- HTTP headers – provide additional HTTP headers (for example for authorization)
When the Endpoint sends a response, you can perform multiple checks to find out whether the Endpoint is in good health. You can check, for example:
- HTTP Return codes – like HTTP 200 must exist, else throw warning/error
- Existing and Non Existing keywords – like ‘success’ must exist in the response message
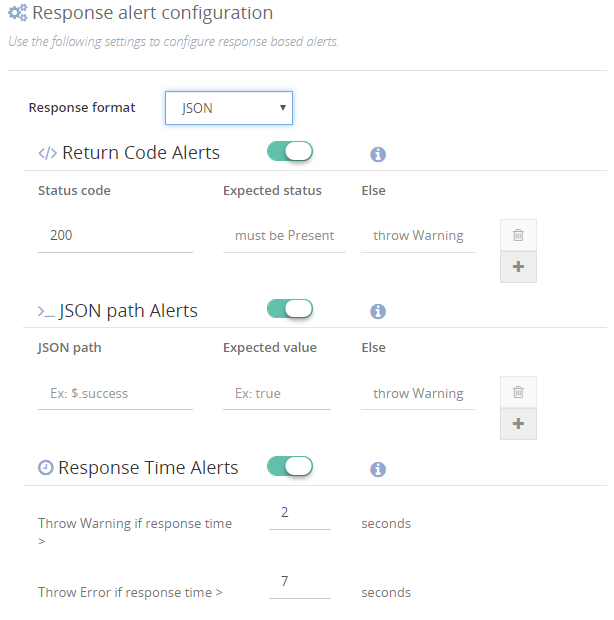
- Response times – if it takes longer than, say, 5 seconds before the response is received, something might be wrong
HTTP Return codes
You can add multiple monitoring rules for HTTP return codes. This allows you to check for the existence, but also the non-existence of certain HTTP return codes. Besides that, you can also determine whether a Warning or an Error will have to be thrown in case the monitoring rules have not been met.
Existing and Non-Existing keywords
This is a very strong capability, as it allows you to check whether certain keywords exist or do not exist. As the response message might be in different formats, BizTalk360 allows you to check for the following formats and throw a Warning/Error based on the outcome of the monitoring rule:
- Plain Text – search for keywords which should/should not exist
- XML – enter an XPath query and the expected value which should/should not exist
- JSON – enter an XPath query and the expected value which should/should not exist
For each format, you can search for just one keyword or multiple keywords to (not) exist.
Response times
Bad response times of endpoints might indicate that the endpoints (or the system/service behind it) are under stress. So monitoring on response times helps you to be aware of such situations.
As all of the above mentioned checks can be combined with each other, this provides very strong monitoring capabilities.
Multiple Azure Subscriptions
You might have multiple Azure subscriptions which contain different Azure API Apps. You can register all the relevant subscription and attach them to corresponding BizTalk Server environments within BizTalk360. This provides a seamless management/monitoring experience.
Conclusion
With Azure API Apps monitoring, we make it easy to constantly be aware of the well-being of your API Apps, without having to check that yourself manually. Besides monitoring whether the Azure API App is Enabled, we bring strong features for monitoring the actual HTTP endpoints.
You can read more about Azure API App monitoring and the other Azure services for which BizTalk360 provides support.
Get started with a Free Trial today!
If you want to monitor your Azure API Apps or have other BizTalk Monitoring related challenges, why not give BizTalk360 a try! It takes about 10 minutes to install on your BizTalk environments and you can witness and check the security and productivity of your own BizTalk Environments. Get started with the free 30 days trial.

Author: Lex Hegt
Lex Hegt works in the IT sector for more than 25 years, mainly in roles as developer and administrator. He works with BizTalk since BizTalk Server 2004. Currently he is a Technical Lead at BizTalk360. View all posts by Lex Hegt

by Lex Hegt | Feb 6, 2018 | BizTalk Community Blogs via Syndication

This blog is a part of the series of blog articles we are publishing on the topic “Why we built XYZ feature in BizTalk360”. Read the main article here.
Why do we need this feature?
Traditionally, a lot of system integration happened on-premise. When integration with partners or external systems was the need of the hour, this was achieved using SOAP/REST/HTTP/FTP/SFTP etc.
With the rise and adaption of cloud technologies like Amazon AWS and Microsoft Azure, cloud solutions became more and more capable to support scenarios where on-premise systems needed to interface to the on-premise systems of your partner(s) or with SaaS solutions like Office365 and SalesForce.
Microsoft is positioning Azure Logic Apps as the integration platform in the cloud mainly for connecting SaaS based solutions like Dynamics 365, Salesforce, ServiceNow, Workday etc.
Since the introduction of the Azure Logic Apps adapter for BizTalk Server 2016 and Azure Gateway, it is possible to integrate your on-premise systems via BizTalk Server with Azure Logic Apps seamlessly. This opens up great possibilities — it opens up some 300+ SaaS connectors that are available to Azure Logic Apps that can be utilized from BizTalk Server. Also, vice versa you can make the 100’s of external SaaS systems to talk to your on-premise BizTalk Server.
So it becomes very important to have a management/monitoring platform that’s capable of supporting both on-premise BizTalk Server and Azure Logic Apps from a single place.
What are the current challenges?
Azure Logic Apps provide a great way to extend your integration scenarios and capabilities to the cloud. However, from an operational and monitoring perspective, the Azure Portal is yet another portal the BizTalk Administrators need to be aware of and fit in their daily tasks.
So, besides their on-premises oriented BizTalk Server monitoring, organizations now also need to monitor their Hybrid solutions (which involve Azure Logic Apps) as events might occur they want to know about.
Think of, for example, somebody could have disabled your Azure Logic App (that’s part of your end-to-end integration scenario), which prevents the Azure Logic Apps from being executed. Also, executions of the Azure Logic Apps might fail or run very slow, indicating that some other system might be under stress.
As it would take too much time to regularly check this kind of scenarios to take place, an administrator just wants to be informed automatically when these kind of events occur. You can use some of the monitoring features of Azure Portal, but you’ll not get the end to end visibility and it will operate on silo without giving the full context.
How BizTalk360 solves this problem?
At BizTalk360, we are closely following the trends in the integration landscape. We can clearly spot the necessity of using Azure Logic Apps in enterprise integration scenario along with BizTalk Server.
Because of this, we brought the support for Azure Logic Apps with BizTalk360. In addition to Azure Logic Apps, we also support other relevant integration technologies in Azure like Azure Service Bus, Azure API Apps and Azure Integration Account with BizTalk360.
In this article, we will just focus on how you can monitor your Azure Logic Apps from BizTalk360. Azure Logic Apps Monitoring with BizTalk360 consists of the following two parts:
- State Monitoring – Monitor whether the Logic Apps are in the expected state
- Data Monitoring – Monitor whether the executions of Logic Apps take place as expected
State Monitoring of Logic Apps
A Logic App can have the following two states:
- Enabled – an instance of the Logic App can be started by means of a trigger
- Disabled – the Logic App cannot be instantiated by means of a trigger
Azure Logic Apps monitoring with BizTalk360 consists of checking whether the state of a Logic App reflects the Expected state. In most cases, a Logic App will have to be in the Enabled state, but there might be scenarios where you want to monitor for the Logic App to be in the Disabled state, which is often referred to as Negative Monitoring. BizTalk360 allows you to monitor for both states.

Auto Correct
BizTalk360 has developed the Auto Correct feature for state-bound artifact monitoring. The feature allows you to let BizTalk360 try to bring the state bound artifact back to the expected state, once the artifact gets into the undesired state. This feature exists for the following artifact types:
- Receive Locations, Orchestrations and Send Ports
- Host Instances
- Windows NT Services
- SQL Server jobs
- Logic Apps
As you can see from the list above, Azure Logic Apps monitoring can be decorated with Auto Correct. In case the Azure Logic App can’t be get back to the expected state, BizTalk360 will try to bring it to the desired state. You can also configure a maximum number of retries in the BizTalk360 portal. This is to prevent BizTalk360 to constantly keep on trying to bring the Azure Logic App back to the expected state, in case of some problem.
Multiple Azure Subscriptions
You might have multiple Azure subscriptions which contain different Azure Logic Apps. You can register all the relevant subscription and attach them to corresponding BizTalk Server environments within BizTalk360. This provides a seamless management/monitoring experience.
Data Monitoring of Logic Apps
With Data Monitoring of Azure Logic Apps, you can monitor for example whether:
- expected number of runs are met in a certain time frame
- a number of failures occur during a certain time frame
- number of billable trigger executions in a certain time frame
The above scenarios are just an example – there are many more combinations.
Data Monitoring of Logic Apps will be discussed in more detail in another article, but here we just wanted to reveal a bit of that feature.
Conclusion
With the rise of Hybrid integration solutions, the job of BizTalk administrators has extended to the (Azure) cloud. BizTalk360 helps these administrators by providing operational and monitoring support for a number of Azure services, thereby taking away the need to constantly have to check the Azure portal to be aware of the health of these services.
In this article, we discussed the state monitoring capability of Azure Logic Apps. If you want to read more about the other Azure services BizTalk360 supports, just follow the articles in the Why did we built series.
You can read more on setting up Azure Logic Apps monitoring on our Documentation portal.
Try BizTalk360 Free for 30 days today!
Download and try BizTalk360 on your own environments free for 30 days. Installation will not take more than 5-10 minutes.

Author: Lex Hegt
Lex Hegt works in the IT sector for more than 25 years, mainly in roles as developer and administrator. He works with BizTalk since BizTalk Server 2004. Currently he is a Technical Lead at BizTalk360. View all posts by Lex Hegt

by Lex Hegt | Feb 2, 2018 | BizTalk Community Blogs via Syndication

This blog is a part of the series of blog articles we are publishing on the topic “Why we built XYZ feature in BizTalk360”. Read the main article here.
Why do we need this feature?
SOAP & REST based Web Services are one of the most used technologies in integration scenarios. In the last few years, the need for HTTP based communication with external vendors/systems has increased significantly. Pretty much it became a norm to expose the API’s of the system for external consumption. Examples: Salesforce API, Microsoft Graph API for Office365 and so on. Also, the companies want to reuse their legacy system as much as possible internally and they expose them as internal web services.
BizTalk Server offers great support for HTTP(S) based web services, both on the Receive and the Send side of interfaces.
When you are integrating multiple endpoints via HTTP(s), it is important to know whether the web services are available, responsive, returning expected values etc., to be able to communicate with them and to support the business process.
What are the current challenges?
The use of web services (web endpoints) comes into play on both receive side and send side in BizTalk Server. Both comes with its own significance and it’s important to monitor them.
Receive Side web services
BizTalk Server allows you to publish schemas and orchestrations as WCF services, which are then published in the IIS web server on the BizTalk Server. In case, you have multiple BizTalk servers in the same BizTalk group, you can set up an NLB (Network Load Balancing) cluster to achieve Load Balancing and High Availability.
The published WCF services are associated with Receive Locations. As a result, if something is wrong with a particular WCF service, for example, the Application Pool in IIS is down, the Receive Location will automatically be set to Disabled.
If the Receive Location/Port is down, then it won’t accept any incoming messages via this channel. Therefore, it’s important to make sure it’s up and running all the time.
Send Side web services
On the outgoing side, you configure either HTTP, SOAP, REST, BizTalk Send port to connect to external web endpoints. If something is wrong with the external web endpoints, the state of the Send Port will remain the same inspite of the state of the external web endpoint.
So, to be able to know the actual state of the web endpoint, the well-being of the endpoint will have to be monitored and checked. This helps to be sure that when a real request to the web endpoint is made, that the actual endpoint can be accessed and the request is properly being processed.
When a web service is down and requests are being sent to that web service, the failing requests will lead to suspended messages in BizTalk, resulting in an interruption of the business process and some work for the BizTalk administrator to have the issue solved and to resume the suspended messages.
An external web service can be down for a variety of reasons.
- Internal web server/service issues – you might get for example the famous, though non-informative, HTTP 500 return codes
- Certificate issues – expired certificates, incorrectly configured or unaccepted client certificates
- Firewall issues – web server/service cannot be contacted at all due to wrongly configured firewall rules
- Flooding – there’s more work than the web server/service can handle
All this kind of errors will lead to unavailability of the web endpoint and interruptions of the business process. This is exactly what we want to prevent, and as it is impossible for a BizTalk administrator to manually monitor web endpoints 24/7, it is way more efficient to have monitoring in place.
How BizTalk360 solves this problem?
For monitoring the physical HTTP web endpoints, BizTalk360 offers Advanced Web Endpoint Monitoring. Once set up, this feature will periodically fire requests against the web service which is being monitored and report any issues identified.
The feature is quite rich and offers, amongst others, support of:
-
- HTTP and HTTPS web services (REST/SOAP)
- Using Gateway proxies
- Providing credentials
- GET and POST methods
- Multiple content types like
- providing custom
- HTTP headers
- GET parameters
- POST payload
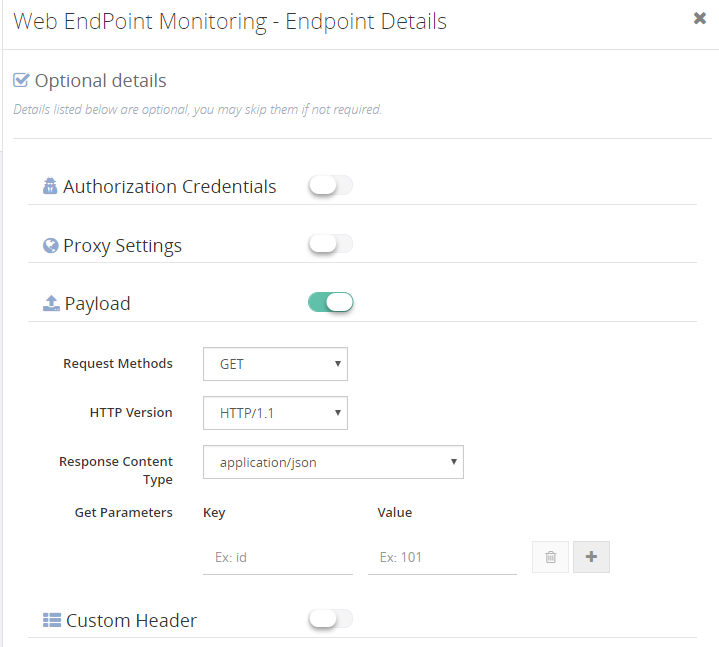
These features allow you to monitor for example HTTP return codes (200 is okay, 500 is warning/error). But you can also check for certain keywords to exist in the XML/JSON response message, by entering XPath/JSON queries.
You can even monitor for response times of the web service, as this might be an indication that the web service is under stress.
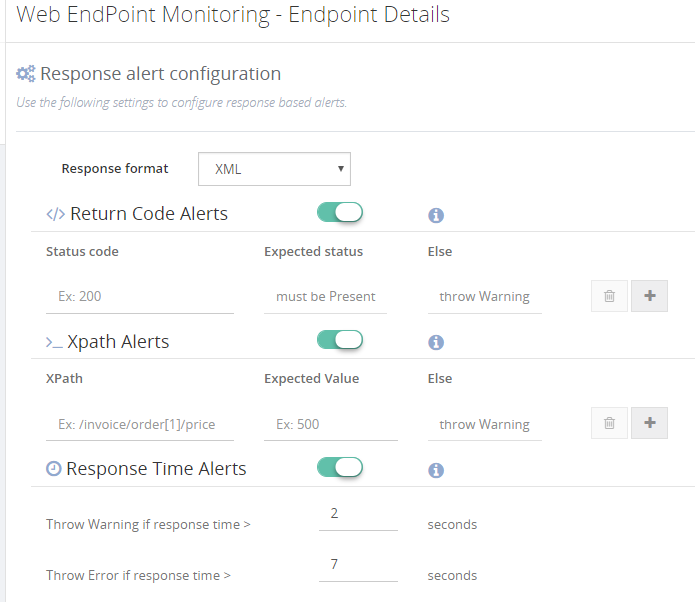
So with the Advanced Web Endpoint Monitoring feature of BizTalk360, you will be able to cover pretty much all the web endpoint monitoring scenarios, whether these web services reside inside your organization or outside and whether these services use XML or JSON.
Conclusion
To underline the importance of web endpoint monitoring, let’s shortly discuss the often forgotten concept of Chain Monitoring.
It is a bit of a human behavior, to just focus on your own work and systems, meanwhile forgetting the impact of your work on other systems.
A simple example: a Technical/Functional Application administrator is responsible for the administration of a CRM system. On a day to day basis, he is very busy with functional questions, which results in not always having the overview of the health of the web services of his CRM system, while these services received data on a regular base from an ERP system, via BizTalk Server.
It was with this kind of scenario where we have experienced that the BizTalk administrator who was using BizTalk360 and had set up Web Endpoint Monitoring, was notified by BizTalk360 of problems with a web endpoint. The administrator contacted the owner of the web endpoint, who was not yet aware of the issue! The issue was solved by the owner of the web service and no interruption of the business process took place.
The above example was based on a scenario which really took place in one of our customer and a very clear example of the purpose of Advanced Web Endpoint monitoring.
If you want to read more on the nitty/gritty of the Advanced Web Endpoint Monitoring feature in BizTalk360, please read this article.
Get started with a Free Trial today!
If you are struggling with the above mentioned challenges, why not give BizTalk360 a try. It takes about 10 minutes to install on your BizTalk environments and you can witness and check this feature on your own BizTalk Environments. Get started with the free 30 days trial.

Author: Lex Hegt
Lex Hegt works in the IT sector for more than 25 years, mainly in roles as developer and administrator. He works with BizTalk since BizTalk Server 2004. Currently he is a Technical Lead at BizTalk360. View all posts by Lex Hegt

by Saravana Kumar | Feb 1, 2018 | BizTalk Community Blogs via Syndication
This blog is a part of the series of blog articles we are publishing on the topic “Why we built XYZ feature in BizTalk360”. Read the main article here.
Why do we need this feature?
Microsoft shipped the ESB Toolkit back in 2007-2008 that extends the functionality of Microsoft BizTalk Server to provide a range of new capabilities for building SOA/ESB applications that incorporate things like itinerary based invocation for lightweight service composition without using Orchestrations, dynamic resolution of endpoints maps, Web services, exception management and reporting. They also provided a sample “ESB Exception Management” web application along with the toolkit.
The ESB Toolkit created a love/hate relationship with a lot of BizTalk Server customers even though it added a lot of value addition to BizTalk Server (as an add-on) while in some cases it simply complicated the solution.
The one thing that everyone loved about ESB Toolkit is the Exception Management framework and the sample web application that shipped with the Toolkit. Since the Exception Management part addressed two important challenges in an integration solution in an end-to-end Exception management framework, visualizing it in a web portal and ability to edit/resubmit failed messages, which were missing in BizTalk Server core.
What are the current challenges?
Sample Portal: The Exception Management Framework itself is a stable offering and fully supported by Microsoft. However, the portal that shipped with the ESB Toolkit is a “sample web application” built on top of the ESB Exception Database. It’s not fully supported by Microsoft and it’s kind of a half-baked solution with a lot of bugs.
Difficult to Install and Configure: Typically it takes few hours to one or two days to install and configure the ESB Exception management portal. It’s not maintained or updated as required over the years, and it uses certain components like older versions of “.NET Logging Application Blocks” that makes server level changes and affects your main BizTalk Solutions.
Missing Functionalities: As the ESB Exception Portal was shipped as a simple sample web application, it’s not matured and misses some important capabilities like “Bulk Edit/Resubmit” and functional alerting. Bulk edit/resubmit is very important since when there is a failure in your environment, you’ll typically have 10’s-100’s of failed messages for the same reason and you wanted to take bulk action.
The other important missing aspect is restricting users by permission and auditing, an example – you probably do not want all of your support people to have the ability to edit and resubmit messages. Even if they do, you need to have the traceability of who performed that action.
How BizTalk360 solves this problem?
We wanted to address the challenges highlighted above and also wanted to give a rich unified tooling experience for BizTalk Administrators. Hence we built the ESB Exception Management portal within BizTalk360 from the ground up. All you need to configure the ESB Exception management within BizTalk360 is to simply provide the connection string to your ESB exception database relevant to your BizTalk Environment. That’s it! You are set (takes about 3 minutes).
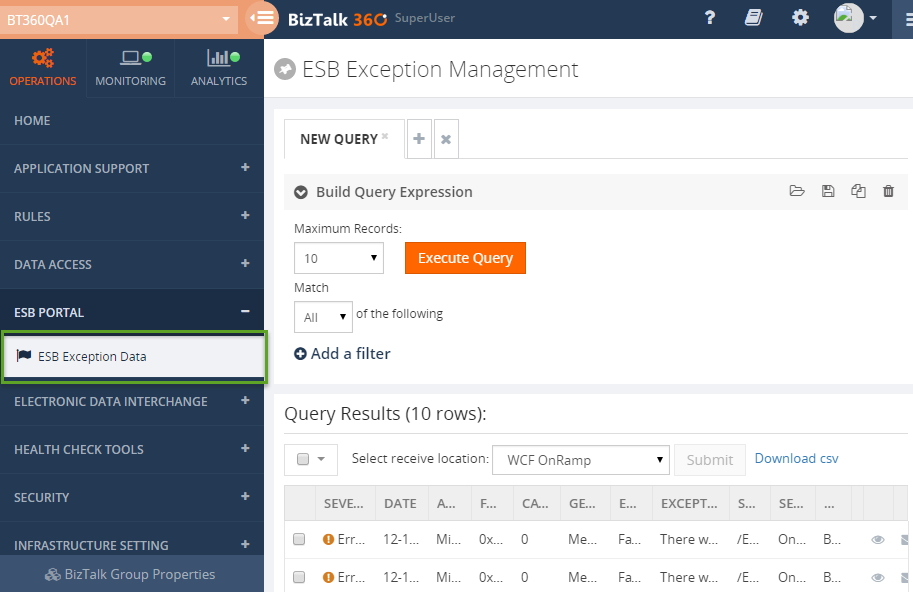
Since we built the ESB Exception Management portal from the ground up, we have thought through all the challenges in the sample portal and addressed them. It comes with the following set of features
- Rich ESB Exception Dashboard (utilizing our powerful customizable dashboard framework)
- Full Search/Filter/Display of exception details
- Edit Resubmit – both single and multiple records
- Download Messages – you can either download or email exception messages directly from the portal.
- Integrated Knowledgebase – you can associate a Knowledgebase article with known exceptions
- Security – ability to restrict user either to the full ESB portal section or allow them to do specific tasks like edit/resubmit
- Governance & Auditing – all the core activities like editing/resubmit by the users are audited.
- Rich Functional alerting – ex: if there are over 30 errors matching a specific error code in an application alert the administrator.
One of the other important objectives of BizTalk360 is to reduce the number of different tools the BizTalk Administrator has to use to support their BizTalk solution – tools such as Admin Console, BAM Portal, ESB Portal, SQL Management Studio, Perfmon and so on. This makes them totally unproductive and switch context between different applications. It is also difficult to on-board new people and bring them up to speed.
By bringing the ESB Exception Management portal within BizTalk360, we eliminate the need to use the sample ESB portal that comes with the toolkit.
Get started with a Free Trial today!
If you are struggling with all the above mentioned challenges, why not give BizTalk360 a try. It takes about 10 minutes to install on your BizTalk environments and you can witness and check the security and productivity on your own BizTalk Environments. Get started with the free 30 days trial.

Author: Saravana Kumar
Saravana Kumar is the Founder and CTO of BizTalk360, an enterprise software that acts as an all-in-one solution for better administration, operation, support and monitoring of Microsoft BizTalk Server environments. View all posts by Saravana Kumar

by Saravana Kumar | Jan 31, 2018 | BizTalk Community Blogs via Syndication

This blog is a part of the series of blog articles we are publishing on the topic “Why we built XYZ feature in BizTalk360”. Read the main article here.
Why do we need this feature?
Message Body and Message Context (properties) tracking is one of the key characteristics of BizTalk Server. A typical flow in BizTalk Server will involve a message that is received from the source system via the receive port, then transmitted to an orchestration (not always) for some business process, and then finally transmitted to the destination systems via the send ports. During this journey, the original message might have gone through various processing and transformations. It’s important to keep track of all the state changes by logging the message content and context at each change point. BizTalk Server provides this functionality out of the box through a very rich tracking mechanism at various points of the journey.
You can track the message body, properties and events at various points as shown below.
Receive Port & Send Port (One way)
- Message Bodies – before and after port processing
- Message Context – before and after port processing
Receive Port & Send Port (Two way)
- Message Bodies (Request) – before and after port processing
- Message Context (Request) – before and after port processing
- Message Bodies (Response) – before and after port processing
- Message Context (Response) – before and after port processing
Orchestration
- Message Bodies – before and after orchestration processing
- Message Properties – incoming and outgoing messages
- Track Events – Orchestration start and end
- Track Events – Message send and receive
- Track Events – Shape start and end
Pipeline
- Message Bodies – before and after pipeline processing
- Track Event – Port start and end
- Track Event – Message send and receive
Business Rule Policy
- Fast Activity – track instance data
- Condition Evaluation – true/false results of condition
- Rule Firing – actions started as result of policy
- Agenda updates
Schemas
As you can see, BizTalk Server provides a very rich tracking framework and mechanism to track pretty much anything that goes through the system. It also gives the end customer full control of what data/property/event needs to be tracked at precise points in the message flow.
What are the current challenges?
Even though BizTalk Server comes with a strong framework for Tracking, the management capabilities of tracking settings is not ideal in the standard BizTalk Admin Console.
Central Management: In the BizTalk Admin Console, there is no option for you to visualize the tracking configuration of all the entities (like receive port, pipeline, orchestration etc.) from a single place. If you wanted to view or change a tracking setting, you need to manually visit each entity and make required changes.
Bulk Actions: You cannot perform bulk actions like changing the tracking settings of all the entities with a single click.
Undesired Tracking Configuration: Often times when the BizTalk applications are migrated from development or QA environments to production, the tracking settings are also copied unwittingly (during export/import binding files). In the development and QA environment you typically have more tracking, but in production you’ll have only required minimum tracking due to performance reasons.
How BizTalk360 solves this problem?
BizTalk360 addresses all the above challenges with the “Advanced Tracking Manager” functionality.
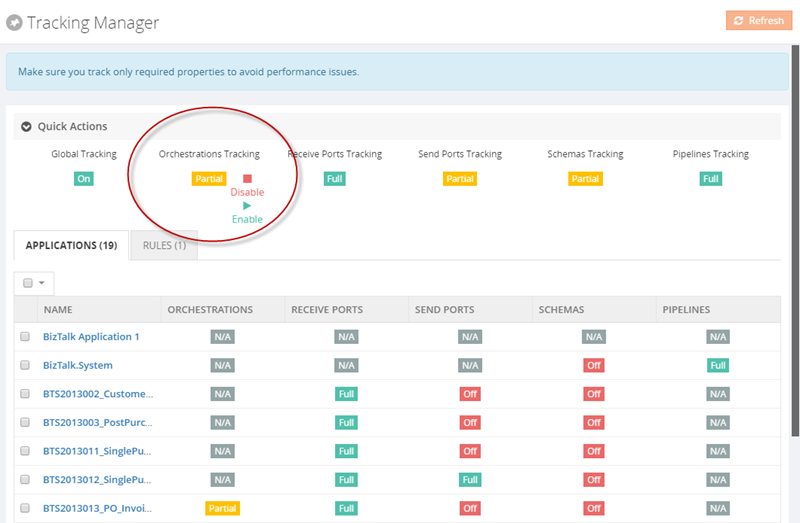
As you can see from the above screenshot, BizTalk360 provides a single unified view of the tracking configuration in a single place with easy to understand colour coding. You can easily make bulk changes with almost single click. You can visit the Advanced Tracking Manager at any time and see the level of tracking you have for the environment.
We have noticed interesting customer scenarios where they typically turn off all tracking for performance reasons and the moment they need to identify some problem, they enable required tracking via Advanced Tracking Manager and turn it off once the diagnosis is done.
In another customer scenario, as part of the deployment process check list, they check the tracking settings in the environment after each BizTalk Application deployment. This reduces the risk of having unwanted tracking settings in their production environment.
If you are interested, there is a more detailed article on all the capabilities of Advanced Tracking Manager.
Get started with a Free Trial today!
If you are struggling with all the above mentioned challenges, why not give BizTalk360 a try. It takes about 10 minutes to install on your BizTalk environments and you can witness and check the security and productivity on your own BizTalk Environments. Get started with the free 30 days trial.

Author: Saravana Kumar
Saravana Kumar is the Founder and CTO of BizTalk360, an enterprise software that acts as an all-in-one solution for better administration, operation, support and monitoring of Microsoft BizTalk Server environments. View all posts by Saravana Kumar

by Saravana Kumar | Jan 30, 2018 | BizTalk Community Blogs via Syndication

This blog is a part of the series of blog articles we are publishing on the topic “Why we built XYZ feature in BizTalk360”. Read the main article here.
Why do we need this feature?
When it comes to troubleshooting operational problems in BizTalk Server, the first place the BizTalk administrator or support person will look is the standard BizTalk Admin Console. Once if they can’t find anything obvious in the Admin Console, their next point of search will be the Event Viewer in the physical BizTalk Server machines and sometimes in the SQL Server machines.
Here are few challenges with this approach —
Correlating events across multiple BizTalk/SQL Servers: A typical BizTalk Enterprise production environment will have at least 2 BizTalk servers and 2 SQL servers to make the environment highly available. If there is a problem, you need to look into the Windows Event Viewer of each server and try to correlate and nail down the problem. This is time consuming.
Security Challenge – Administrator Access to BizTalk/SQL Servers: If you want to have access to Event Viewers in Windows Servers, then you need to have pretty much Administrator rights on the server(s). This is something that the organization needs to avoid.
Too much noise in the Event Viewer: Generally, every single problem or logging that happens in Windows Servers goes into the Event Viewer. Even though Event Viewer has the concept of Categories, it will still be noisy and the Administrator needs to have enough knowledge to understand what they are looking for in the Event Viewer. This could be a potential time loss exercise.
What is the current limitation in BizTalk Server?
BizTalk Server out of the box does not have any special tooling to address this challenge. It simply relies on Administrators to use the standard Windows Event Viewer MMC snap in. This will result in all the three challenges highlighted in the previous section. What this means is that people have gotten adapted to certain ways of solving the problems and Microsoft BizTalk Server lacks the proper tooling to address the challenge.
How does BizTalk360 solves this problem?
BizTalk360 comes with a key feature called “Centralized Advanced Event Viewer”. It periodically collects the events that are related to BizTalk (out of the box we collect certain Event Log Categories, Administrators can also add additional categories) from all the BizTalk and SQL servers in the environment and store them in a central database. The collected data is then searched and then made viewable in the BizTalk360 web based user interface.
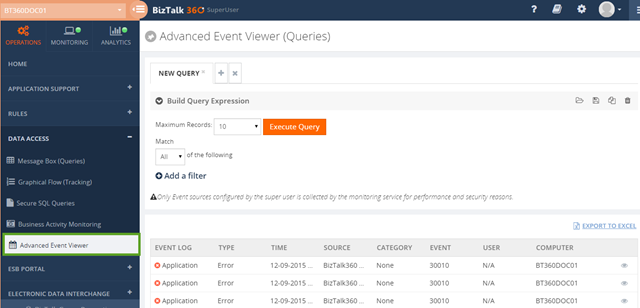
This approach seamlessly solves all the problems we highlighted previously. The BizTalk Administrators or support people need not physically access the servers via RDP (remote desktop) connection. They can easily correlate events in a single place and construct complex filters like for example: events related to Enterprise SSO across all the BizTalk Servers for a time range.
What is the business value?
Address Security Concerns: Businesses do not want too many people logging on/off into their production servers with highest privileges during business hours. This can be rectified using BizTalk360 Advanced Event Viewer.
Reduce time to diagnose issue: It’s much faster to look into the reason for errors in one place rather than looking at many places and try to correlate events. This dramatically reduces the time it takes to solve the problem. In a typical BizTalk Server troubleshooting exercise, this is how the operations/support person loses a ton of time.
Get started with a Free Trial today!
If you are struggling with all the above mentioned challenges, why not give BizTalk360 a try. It takes about 10 minutes to install on your BizTalk environments and you can witness and check the security and productivity on your own BizTalk Environments. Get started with the free 30 days trial.

Author: Saravana Kumar
Saravana Kumar is the Founder and CTO of BizTalk360, an enterprise software that acts as an all-in-one solution for better administration, operation, support and monitoring of Microsoft BizTalk Server environments. View all posts by Saravana Kumar