by Daniel probert | Aug 3, 2016 | BizTalk Community Blogs via Syndication
In case you missed it, Logic Apps moved to General Availability last week.
At the same time, pricing for Logic Apps gained a new option: Consumption charging i.e. pay by use.
I‘ve been talking to a number of clients about this new pricing model, and every single one has expressed concerns: it‘s these concerns that I wanted to touch upon in this post. Most of these concerns are based around the fact that these customers feel they can no longer accurately calculate the monthly cost for their Logic Apps in advance.
I also feel that the whole discussion might be a bit overblown, as once you remove the cost of having to pay for servers and server licenses for a traditional on-premises application (not to mention the run and maintain costs), Logic Apps can be significantly cheaper, regardless of which pricing model you use.
Old Pricing Model vs New
Prior to GA, Logic Apps were charged as part of the App Service Plan (ASP) to which they belong: An App Service Plan has a monthly charge (based on the number of compute units used in the plan), but also throttles a Logic App once a certain number of executions are exceeded in a month (the limit changes depending on the type of ASP the Logic App uses).
Effectively the old way was Pay Monthly, the new way is Pay As You Go.
This table outlines the changes:
|
|
App Service Plan Model
|
Consumption Model
|
|
Static Monthly Charge
|
TRUE
|
FALSE
|
|
Throttling
|
TRUE
|
FALSE
|
|
Limit on Number of Logic App Executions
|
TRUE
|
FALSE
|
|
Pay per Logic App Execution
|
FALSE
|
TRUE
|
I can understand why Microsoft are making the change: consumption pricing favours those that have either a small number of Logic App executions per month (as they only pay for what they use); or who have large numbers of executions per month (and were therefore being throttled as they exceeded the ASP limits).
I‘m not sure yet if the ASP-style pricing model will stay: there‘s no mention of it any more in the Logic Apps pricing page, but you can still (optionally) associate a Logic App with an ASP when you create it.
How to select either pricing model when creating or updating a Logic App
When you create a new Logic App, you used to be able to select an App Service Plan: now this option is no longer available, and all new Logic Apps use the Consumption pricing plan by default.
However, if you have an existing Logic App and you wish to switch the billing model, you can do so via PowerShell here. You can also follow the instructions at the bottom of this blog post here (I suspect this will get surfaced in the Portal if both billing models are kept).
Why the new model can be confusing
Consumption pricing makes sense: one of the benefits of Azure is that you pay for what you use. Instead of paying upfront for an expensive license fee (e.g. SQL Server and BizTalk Server licenses) you can instead pay a smaller amount every month. A lot of businesses prefer this as it helps with cash flow, and reduces capital expenditure.
The main issue with consumption pricing for Logic Apps is that instead of paying for each execution of the Logic App, you‘re paying for the execution of the actions within that Logic App. And this is the problem, as a Logic App is opaque: when you‘re designing a solution, you may know how many Logic Apps you‘ll have, but you may not know exactly how many actions each will contain (or how many pf those actions will be executed) and this makes it difficult to estimate the runtime cost.
Up to now, it‘s been easy to work out what a Logic App will cost to run. And that‘s usually one of the first questions from a client: how much will this cost me per month.
But now, it‘s harder: instead of knowing exactly you have to estimate, and this estimate has to be based not only on how many times a Logic App will execute, but also *what* the Logic App will be doing i.e. if it will be looping, or if actions in an IF branch will execute.
Effect of the consumption model on development and testing
The main concern I (and others) have with the Consumption billing model is the effect it will have on development and testing: developers (and testers) are used to executing their applications with little or no cost (other than maybe the cost of an dev/test server and dev/test licenses).
Take a BizTalk Developer: chances are the BizTalk and SQL Server Licenses they are using came from an MSDN subscription, or they bought the Dev edition. In either case, they will execute their code during the development process without paying any attention to cost.
The same applies to testers.
An argument can be made that the cost per action of a Logic App is so low that this wouldn‘t be an issue (e.g. a reasonably complex Logic App with 50 actions per execution would cost 2.5p (4c) per execution. But the pennies do add up: imagine a corporate customer with 100 developers: each time those developers execute a Logic App like this, it costs the company £2.50 (US $4.00) – and that‘s just executing it once.
Microsoft will likely point out that an MSDN Subscription comes with free Azure credit, and that therefore there is no extra cost to execute these Logic Apps as they‘re covered in this free credit. But this doesn‘t apply to most of my clients: although the developers have MSDN, the free credit applies only to their MSDN subscription not the corporate subscription where they perform dev and testing. The MSDN subscriptions are usually used for prototyping, as they‘re not shared amongst multiple developers, unlike the corporate subscriptions.
So to summarise:
Consumption pricing could lead to:
- A preference against Test Driven Development due to perceived cost of executing code frequently against tests
- Corporates hesitant to allow developers to execute code during development whenever they want due to perceived cost
- A hesitation on performing Load/Perf Testing on Logic Apps due to the cost of doing so e.g. with our sample 50 action Logic App, executing it a million times for load testing would cost £4500 (about US $6000) – consumption pricing gets cheaper once you get over a certain number of actions (so a million actions is £0.00009 per action) – this is retail pricing though, some large customers will benefit from a volume licensing discount e.g. for an Enterprise Agreement.
Note: There is questionable value in performing Load/Perf Testing on Logic Apps, as there is little you can do to tune the environment, which is the usual rationale behind Load Testing (especially in a BizTalk environment). However, some level of testing may be required if your Logic App is designed to process multiple messages and there is either a time limit or the messages are connected in some way (e.g. debatching a request and then collating responses).
The solution
The solution (in my view) is to keep both billing models:
- ASP pricing can be kept for development/testing, which will have the effect of putting a cap on the cost of development and testing (although will hamper Load Testing). ASP pricing also benefits customers who have a reasonable number of executions per month, but aren‘t hitting the throttling limits. ASP pricing also allows for customer to try out Logic Apps for free by using the Free pricing tier.
- Consumption pricing can then be used for Production workloads, or for those who find that consumption pricing is cheaper for them for dev/test than ASP pricing
In addition, it would help if Microsoft provided more examples on monthly cost; provided some way to help calculate the monthly cost under the consumption model; and highlighted the overall reduction in cost through using Logic Apps for most customers. For example, if your Logic App is under the ASP pricing model, and you execute it, then the portal could tell you what that execution would have cost you under the consumption model (using retail pricing). Just an idea!
Let me know if you have other opinions, or agree/disagree with this.
by mbrimble | Aug 2, 2016 | BizTalk Community Blogs via Syndication
August 2, 2016
My First Logic App
I really like this logic app pattern.
The NZ Post parcel events application (https://www.nzpost.co.nz/business/developer-centre/tracking-notification-api/watch-method) will not repeat an event. I decided to expose http endpoint in an azure Logic App and send these to a Azure Service Bus. I then I retrieve the message using a BizTalk SB-Messaging adapter, whenever I am ready and then do all the heavy lifting.
This was a brilliant experience with a customer in front of me. All done in less than 15 minutes!
No comments yet.
RSS feed for comments on this post. TrackBack URI
by michaelstephensonuk | Aug 1, 2016 | BizTalk Community Blogs via Syndication
At the university one of the cool features we have on the monitoring dashboard is to split it so services are monitored at 3 levels:
- Infrastructure
- Platform
- User Experience
If you imagine a table which looks something like this:
| Service |
User |
Platform |
Infrastructure |
| API |
|
|
|
| Public Website |
|
|
|
| Identity Synchronisation |
|
|
|
| BizTalk |
|
|
|
| Office 365 |
|
|
|
This dashboard is based off System Centre monitoring different aspects of the system we have and then relating them to the user, platform or infrastructure level things. The idea is that while you may have some issues with some levels of a service, it may not impact users. We want a good view of the health of systems across the board.
When we consider how to plug BizTalk into this dashboard we have a few things to consider:
- SCOM has a management pack for BizTalk which can be used
- We can monitor event logs and services and other such things
The challenge comes at the point when we consider the user side of things. In our other systems we treat “User” to mean is the service performing the way it should for the consumers of that service. As an example we can check that web pages are being served correctly. In our API stack we use a pattern that Elton Stoneman and I have blogged about in the past where we have a diagnostics service within the API and we will call that from our monitoring software to ensure the component is working correctly. We would then plug this into the monitoring dashboard or perhaps you would plug it into the web endpoint monitor for BizTalk 360.
When it comes to BizTalk what is the best thing to do?
Our Approach
The approach I decided to take was to use the Diagnostics API approach where we would host an API in the cloud which would use the RPC pattern using Service Bus queues to send a message to a queue. BizTalk would then collect this message and take it through the message box and use a send port which would send the message to a response queue which the API would be checking for a response message. The API would set the session ID, reply to session Id as properties on the brokered message and in BizTalk I would flow these message properties from the receive to the send so that the message went back to service bus with the right session details so that the API would pick it up.
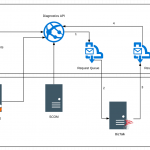
The below diagram shows how this would work.
- The Diagnostics API sends a message to the request queue
- BizTalk has a receive location pointing at the queue and collects the message
- A send port subscribes to the message and sends the message back to the response queue
- The API is listening on the response queue for the response message coming back
If the API gets a successful response then it will return an http 200 to indicate success
If the API gets an error of no message comes back then an http 500 error is returned
Limitations
The challenge for BizTalk is that the number of different interfaces you have means you have many dependencies and most often it is one of these dependencies breaks and it looks like BizTalk has problems when it doesn’t.
With this user level monitoring what we are saying is that BizTalk should and is capable of processing messages. This test ensures the message is going through BizTalk and flexes the message box database and other key resources. Obviously it doesn’t test every BizTalk host instance and any of the dependencies but it tells us that BizTalk should be capable of processing messages.
Implementation Specific Info
A little lower level detail on the implementation of this is provided below.
Service Bus
On the service bus side we have a request queue which is a basic queue where we have set permission for the API to send a message. The queue has all of the default settings except the following:
- The message time to live has been reduced to 1 day
- The queue size is set to 1GB
- Partitioning is disabled (this isn’t supported by BizTalk last time I checked)
The response queue has sessions enabled on it so that the API can use sessions to implement the RPC pattern. The settings are the default except for the following:
- The message time to live has been reduced to 1 day
- The queue size is set to 1GB
- Partitioning is disabled (this isn’t supported by BizTalk last time I checked)
BizTalk
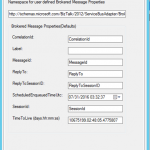
On the BizTalk side we have a receive location which is using the SB-Messaging adapter and is pointing to the request queue. It is using all of the default settings and also we have left the service bus adapter property promotion set to on leaving the default namespace for properties.
We copied the namespace though for use on the send side. We set the properties to be flown through to the message sent back to service bus.
The BizTalk side is very easy it is just pass through messaging from one queue to another so there is very little that can do wrong.
Diagnostics API
At this point you should be able to ping your API to see that it will send a message to the request queue and that it gets a response meaning BizTalk processed the message. Using a simple WebAPI component here we could do an HTTP GET to a controller and using a simple approach of 200 HTTP response means it works and 500 means it didn’t you now have a simple diagnostics test which can be easily used. You might consider things like caching the response for a minute or so to ensure loads of messages aren’t sent through BizTalk or also using an access key to protect the API.
We then hosted the API on Azure App Service so its easily deployed and managed.
Monitoring the Diagnostics API
Now that our API is out there and can be used to check BizTalk is working we can plug it into our monitoring software in a few different ways. Some examples include:
- Plug it into Application Insights as a Web Test
- Call it from SCOM with an HTTP Get
- Plug it into BizTalk 360 using the Web Endpoint Monitor
I have talked about using the BizTalk 360 endpoint monitor in previous posts so this time lets consider Application Insights. In the real world I have found that sometimes customers setup BizTalk 360 in a way that if the BizTalk system goes down then it can also take out BizTalk 360. An example of this could be running your BizTalk 360 database on the BizTalk database cluster. If the SQL Server goes down then your BizTalk 360 monitoring can be affected. In this case I also like to compliment BizTalk 360 with a test running from Application Insights so that I have double checked my really key resources.
To plug the web test into Application Insights you would setup an instance in Azure and then go to the Web Tests area. From here you would setup a web test pinging BizTalk from multiple locations and you could simply supply the url just as if you were testing the availability of a web page. The only difference is that your page will respond having checked BizTalk could process a message.
If the service responds with an error for a few mins then you will get alerts to indicate BizTalk may be down.
Also you can see below there is quite a rich dashboard of when your tests are running and their results as shown below.
by michaelstephensonuk | Aug 1, 2016 | BizTalk Community Blogs via Syndication
At the university one of the cool features we have on the monitoring dashboard is to split it so services are monitored at 3 levels:
- Infrastructure
- Platform
- User Experience
If you imagine a table which looks something like this:
| Service |
User |
Platform |
Infrastructure |
| API |
|
|
|
| Public Website |
|
|
|
| Identity Synchronisation |
|
|
|
| BizTalk |
|
|
|
| Office 365 |
|
|
|
This dashboard is based off System Centre monitoring different aspects of the system we have and then relating them to the user, platform or infrastructure level things. The idea is that while you may have some issues with some levels of a service, it may not impact users. We want a good view of the health of systems across the board.
When we consider how to plug BizTalk into this dashboard we have a few things to consider:
- SCOM has a management pack for BizTalk which can be used
- We can monitor event logs and services and other such things
The challenge comes at the point when we consider the user side of things. In our other systems we treat “User” to mean is the service performing the way it should for the consumers of that service. As an example we can check that web pages are being served correctly. In our API stack we use a pattern that Elton Stoneman and I have blogged about in the past where we have a diagnostics service within the API and we will call that from our monitoring software to ensure the component is working correctly. We would then plug this into the monitoring dashboard or perhaps you would plug it into the web endpoint monitor for BizTalk 360.
When it comes to BizTalk what is the best thing to do?
Our Approach
The approach I decided to take was to use the Diagnostics API approach where we would host an API in the cloud which would use the RPC pattern using Service Bus queues to send a message to a queue. BizTalk would then collect this message and take it through the message box and use a send port which would send the message to a response queue which the API would be checking for a response message. The API would set the session ID, reply to session Id as properties on the brokered message and in BizTalk I would flow these message properties from the receive to the send so that the message went back to service bus with the right session details so that the API would pick it up.
The below diagram shows how this would work.
- The Diagnostics API sends a message to the request queue
- BizTalk has a receive location pointing at the queue and collects the message
- A send port subscribes to the message and sends the message back to the response queue
- The API is listening on the response queue for the response message coming back
If the API gets a successful response then it will return an http 200 to indicate success
If the API gets an error of no message comes back then an http 500 error is returned
Limitations
The challenge for BizTalk is that the number of different interfaces you have means you have many dependencies and most often it is one of these dependencies breaks and it looks like BizTalk has problems when it doesn’t.
With this user level monitoring what we are saying is that BizTalk should and is capable of processing messages. This test ensures the message is going through BizTalk and flexes the message box database and other key resources. Obviously it doesn’t test every BizTalk host instance and any of the dependencies but it tells us that BizTalk should be capable of processing messages.
Implementation Specific Info
A little lower level detail on the implementation of this is provided below.
Service Bus
On the service bus side we have a request queue which is a basic queue where we have set permission for the API to send a message. The queue has all of the default settings except the following:
- The message time to live has been reduced to 1 day
- The queue size is set to 1GB
- Partitioning is disabled (this isn’t supported by BizTalk last time I checked)
The response queue has sessions enabled on it so that the API can use sessions to implement the RPC pattern. The settings are the default except for the following:
- The message time to live has been reduced to 1 day
- The queue size is set to 1GB
- Partitioning is disabled (this isn’t supported by BizTalk last time I checked)
BizTalk
On the BizTalk side we have a receive location which is using the SB-Messaging adapter and is pointing to the request queue. It is using all of the default settings and also we have left the service bus adapter property promotion set to on leaving the default namespace for properties.
We copied the namespace though for use on the send side. We set the properties to be flown through to the message sent back to service bus.
The BizTalk side is very easy it is just pass through messaging from one queue to another so there is very little that can do wrong.
Diagnostics API
At this point you should be able to ping your API to see that it will send a message to the request queue and that it gets a response meaning BizTalk processed the message. Using a simple WebAPI component here we could do an HTTP GET to a controller and using a simple approach of 200 HTTP response means it works and 500 means it didn’t you now have a simple diagnostics test which can be easily used. You might consider things like caching the response for a minute or so to ensure loads of messages aren’t sent through BizTalk or also using an access key to protect the API.
We then hosted the API on Azure App Service so its easily deployed and managed.
Monitoring the Diagnostics API
Now that our API is out there and can be used to check BizTalk is working we can plug it into our monitoring software in a few different ways. Some examples include:
- Plug it into Application Insights as a Web Test
- Call it from SCOM with an HTTP Get
- Plug it into BizTalk 360 using the Web Endpoint Monitor
I have talked about using the BizTalk 360 endpoint monitor in previous posts so this time lets consider Application Insights. In the real world I have found that sometimes customers setup BizTalk 360 in a way that if the BizTalk system goes down then it can also take out BizTalk 360. An example of this could be running your BizTalk 360 database on the BizTalk database cluster. If the SQL Server goes down then your BizTalk 360 monitoring can be affected. In this case I also like to compliment BizTalk 360 with a test running from Application Insights so that I have double checked my really key resources.
To plug the web test into Application Insights you would setup an instance in Azure and then go to the Web Tests area. From here you would setup a web test pinging BizTalk from multiple locations and you could simply supply the url just as if you were testing the availability of a web page. The only difference is that your page will respond having checked BizTalk could process a message.
If the service responds with an error for a few mins then you will get alerts to indicate BizTalk may be down.
Also you can see below there is quite a rich dashboard of when your tests are running and their results as shown below.
by community-syndication | Jul 29, 2016 | BizTalk Community Blogs via Syndication
Whilst I was scripting out some azure deployment stuff, I suddenly was getting this error whenever I tried to invoke
Blog Post by: Rene Brauwers
by Nick Hauenstein | Jul 27, 2016 | BizTalk Community Blogs via Syndication
Today the Logic Apps team has officially announced the general availability of Logic Apps! We’ve been following developments in the space since it was first unveiled back in December of 2014. The technology has certainly come a long way since then, and is certainly becoming capable of being a part of enterprise integration solutions in the cloud. A big congratulations is in order for the team that has carried it over the finish line (and that is already hard at work on the next batch of functionality that will be delivered)!
Along with hitting that ever important GA milestone, Logic Apps has recently added some new features that really improve the overall experience in using the product. The rest of this post will run through a few of those things.
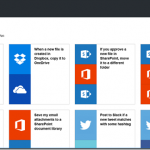
Starter Templates
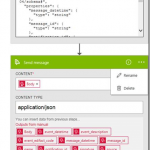
When you go and create a new Logic App today, rather than being given an empty slate and a dream, you are provided with some starter templates with which you can build some simple mash-ups that integrate different SaaS solutions with one another and automate common tasks. If you’d still rather roll up your sleeves and dig right into the code of a custom Logic App, there is nothing preventing you from starting from scratch.
Designer Support for Parallel Actions
Ever since the designer went vertical, it has been very difficult to visualize the flow of actions whenever there were actions that could execute in parallel. No longer! You can now visualize the flow exactly as it will execute – even if there are actions that will be executing in parallel!
Logic Apps Run Monitoring
Another handy improvement to the visualization of your Logic Apps is the new runtime monitoring visualization provided in the portal. Instead of seeing a listing of each action in your flow alongside their statuses – with tens of clicks involved in taking in the full state of the flow at any given time – a brand new visualizer can be used to see everything in one shot.
The visualization captures essentially the same thing that you see in the Logic App designer, but shows both the inputs and the outputs on each card along with a green check mark (Success), red X (Failure), or gray X (skipped) in the top-right corner of the cards.
Additionally if you have a for each loop within your flow, you can actually drill into each iteration of the loop and see the associated inputs/outputs for that row of data.
Visual Studio Designer
There is one feature that you won’t see in the Azure portal. In fact, it’s designed for offline use – the Visual Studio designer for Logic Apps. The designer can be used to edit those Logic App definitions that you’d rather manage in source control as part of an Azure Resource Group project – so that you can take advantage of things like TFS for automated build and deploy of your Logic Apps to multiple environments
Unfortunately, at the moment you will not experience feature parity with the Azure Portal (i.e., it doesn’t do scopes or loops), but it can handle most needs and sure is snappy!
That being said, do note that at the moment, the Visual Studio designer is still in preview and the functionality is subject to change, and might have a few bugsies still lingering.
Much More
These are just a few of the features that stick out immediately while using the GA version of the product. However, depending on when you last used the product, you will find that there are lots of runtime improvements and expanded capabilities as well (e.g., being able to control the parallelism of the for each loops so that they can be forced to execute sequentially).
Be Prepared
So how can you be prepared to take your integrations to the next level? Well, I’m actually in the middle of teaching all of these things right now in QuickLearn Training’s Cloud-based Integration using Logic Apps class, and in my humble and biased opinion, it is the best source for getting up to speed in the world of build cloud integrations. I highly recommend it. There’s still a few slots left in the September run of the class if you’re interested in keeping up with the cutting edge, but don’t delay too long as we expect to see these classes fill up through the end of the year.
As always, have fun and do great things!
by bchesnut | Jul 26, 2016 | BizTalk Community Blogs via Syndication
After you have setup a new BizTalk server and start deploying BAM Activities, in this case Microsoft.BizTalk.ESB.BAM.Exceptions.xml which has a Cube that needs to be deployed into the BAM OLAP Database, you can get this error:
To fix this error, you need to find the logon that was trying to access the BAMStarSchema database, in this case ‘NT SERVICEMSSQLServerOLAPService’ (this is the default account for OLAP in the SQL Install)
Add ‘NT ServiceMSSQLServerOLAPService’ as a SQL Logon
Give this account db_datareader for the BAMStarSchema database
Re-Run the BAM Deploy
Problem Fixed
Comments are closed.
by Bill Chesnut | Jul 24, 2016 | BizTalk Community Blogs via Syndication
*** Notice The Date has changed to August 9th, 2016 ***
I will be presenting a talk on API Management and Hybrid Integration at the Brisbane Azure Meetup Group on August 10th, 2016. Come along to learn about Azure API Management and how it can help with your Hybrid Integration projects.
The post Presenting API Management and Hybrid Integration at the Brisbane Azure Meetup Group on August 10th, 2016 appeared first on biztalkbill.

by community-syndication | Jul 22, 2016 | BizTalk Community Blogs via Syndication
On 12th May, during my session in the Integrate 2016 event about “A new set of BizTalk Server Tips and Tricks” (you can watch the full session online here) I announce that I had BizTalk Server 2016 stickers to offer (it was a way to buy the audience hehehe). I always felt a little “jealousy”, […]
Blog Post by: Sandro Pereira

by [email protected] Steef-Jan Wiggers | Jul 19, 2016 | BizTalk Community Blogs via Syndication
A few weeks ago I received an e-mail from Microsoft with exciting news that my MVP status has been renewed again. I am now an Azure MVP!
For me this is the seventh time to receive this award. The sixth year in the program has been again an awesome experience, which gave me the opportunity to do great things and meet inspiring, very skilled people. I have had some interesting speaking engagement, which were fun to do and were very fulfilling. I learned a lot through speaking thanks to the community and fellow MVP’s. I was able to share my experiences through these speaking gigs and other channels like this blog, MSDN Gallery, and above all the TechNet Wiki.
I would like to thank:
- My MVP old lead William Jansen, and new MVP lead Tina Stenderup-Larsen.
- The BizTalk Product Team, Jim Harrer, Ed Price, Mandi Ohlinger, Tord G. Nordahl, Dan Rosanova, Jon Fancey, Paolo Salvatori, and all other Microsoft employees involved.
- People at my former employers: Rene Brauwers, Eldert Grootenboer, fellow MVP Edward Bakker and many others.
- At my current company DutchWorkz : Rutger van Hagen and colleguaes.
- Fellow Microsoft Integration MVP’s: Richard Seroter, Kent Weare, Mikael Håkansson, Johan Hedberg, Saravana Kumar, Nino Crudele, Sandro Pereira, Stephen W. Thomas, Mick Badran (Azure), Micheal Stephenson, Tomasso Groenendijk, Nicholas Hauenstein, Salvatore Pellitteri,Sam VanHoutte, Glenn Colpeart, Bill Chesnut, Howard S. Edidin, Martin Abbott, Leonid Ganeline, and Ashwin Prabhu, who I got learn even better and supported me in this program.
- The BizTalk community: Mikael Sand, Lex Hegt, Colin Meade, Naushad Alam, Johann Cooper, Mark Brimble, Mitch VanHelden, Sven Van den Brande, Jérémy Ronk, Maxime Labelle, Jean-Paul Smit, Dean Robertson and the collegueaes at Mexia, and many others that make the BizTalk community strong!
- Andrew Slivker from Sentinet.
- Finally my wife Lian and children Stan, Ellis and Cato for their support.
I’m looking forward to another great year in the program.
Cheers,
Steef-Jan