by Sandro Pereira | Nov 20, 2018 | BizTalk Community Blogs via Syndication
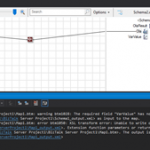
Back to Errors and Warnings, Causes and solutions, this time with a surprising error that I got while I was testing a custom Functoid that I had developer: Extension function parameters or return values which have Clr type ‘Char’ are not supported
The full error description was:
Invoking component…
C:DevelopmentBizTalk Server Project1BizTalk Server Project1Map1.btm: warning btm1028: The required field “VarValue” has no incoming link, constant value, or default value.
TestMap used the following file: <file:///C:DevelopmentBizTalk Server Project1Schema1_output.xml> as input to the map.
C:DevelopmentBizTalk Server Project1BizTalk Server Project1Map1.btm: error btm1050: XSL transform error: Unable to write output instance to the following <file:///C:UsersAdministratorAppDataLocalTemp2_MapDataBizTalkServerProject1Map1_output.xml>. Extension function parameters or return values which have Clr type ‘Char’ are not supported.
Test Map failure for map file <file:///C:DevelopmentBizTalk Server Project1BizTalk Server Project1Map1.btm>. The output is stored in the following file: <file:///C:UsersAdministratorAppDataLocalTemp2_MapDataBizTalkServerProject1Map1_output.xml>
Component invocation succeeded.

Again, I catch this error while I was trying to test my custom functoid inside Visual Studio.
The Custom Functoid was invoking the following code:
private string GetCSharpBuffer()
{
    StringBuilder builder = new StringBuilder();
    builder.Append("public string SplitText(string element, int pos, char splitter)n");
    builder.Append("{n");
    builder.Append("tstring[] listValues = element.Split(splitter);n");
    builder.Append("tif (listValues != null)n");
    builder.Append("ttif (listValues.Length > pos)n");
    builder.Append("tttreturn listValues[pos];n");
    builder.Append("treturn "";n");
    builder.Append("}n");
    return builder.ToString();
}
Or, to be easier to read in a clean C# code that would be like this:
public string SplitText(string element, int pos, char splitter)
{
   string[] listValues = element.Split(splitter);

   if (listValues != null)
      if (listValues.Length > pos)
         return listValues[pos];
   return "";
}
Cause
Unfortunately, this is a BizTalk mapper engine limitation. The type Char is not supported at least on built-in code inside the XSLT, in other words by using the Functoid SetScriptBuffer functionality:
SetScriptBuffer(ScriptType.CSharp, this.GetCSharpBuffer());
I didn’t test but it may work if you replace this functionality with the SetExternalFunctionName functionality:
SetExternalFunctionName(GetType().Assembly.FullName, GetType().FullName, "SplitText");
Note: This means that the code will not be inside the XSLT but instead you will be calling an external assembly that needs to be on GAC.
Solution
The simple solution, or let’s call I workaround, is to use strings instead, either on inputs as outputs parameters of the Functoid. For that we just need to replace the above code to this:
private string GetCSharpBuffer()
{
    StringBuilder builder = new StringBuilder();
    builder.Append("public string SplitText(string element, int pos, string splitter)n");
    builder.Append("{n");
    builder.Append("tstring[] listValues = element.Split(Convert.ToChar(splitter));n");
    builder.Append("tif (listValues != null)n");
    builder.Append("ttif (listValues.Length > pos)n");
    builder.Append("tttreturn listValues[pos];n");
    builder.Append("treturn "";n");
    builder.Append("}n");
    return builder.ToString();
}
Or again, in a simple C# form:
public string SplitText(string element, int pos, string splitter)
{
    string[] listValues = element.Split(Convert.ToChar(splitter));

    if (listValues != null)
       if (listValues.Length > pos)
          return listValues[pos];
    return "";
}
By doing that you will be able to successfully test the Functoid.
Author: Sandro Pereira
Sandro Pereira lives in Portugal and works as a consultant at DevScope. In the past years, he has been working on implementing Integration scenarios both on-premises and cloud for various clients, each with different scenarios from a technical point of view, size, and criticality, using Microsoft Azure, Microsoft BizTalk Server and different technologies like AS2, EDI, RosettaNet, SAP, TIBCO etc. He is a regular blogger, international speaker, and technical reviewer of several BizTalk books all focused on Integration. He is also the author of the book “BizTalk Mapping Patterns & Best Practices”. He has been awarded MVP since 2011 for his contributions to the integration community. View all posts by Sandro Pereira
by Sandro Pereira | Nov 20, 2018 | BizTalk Community Blogs via Syndication
A few days ago, I helped a fellow “BizTalker” on a PowerShell script implementation that would monitor all your BizTalk Server BRE Policies, highest versions, that aren’t in the deployed state. You can know more about this on my blog: BizTalk DevOps: Monitor your BizTalk environment using PowerShell – Monitoring BRE Policies Pending to be Deployed.
However, my monitor script is, in fact, a combination of:
- A piece of PowerShell that invokes a SQL Query and notifies by email if any non-compliance occurs
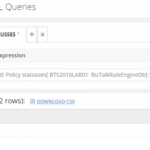
- A SQL Server query that will have the ability to check what rules are in a non-compliance state; this is where the magic happens
I did that because out-of-the-box BizTalk360 doesn’t have the capability to monitor BRE Policies that aren’t in the deployed state. Despite that BizTalk360 allows you to create “Secure SQL Queries” that will enable us to:
- Write optimized SQL queries and store them with friendly names in BizTalk360
- Assign who will have permissions to run the queries
- Run the queries, of course
This will allow us to quickly check if any policy is in a non-compliance state.

You can see and download the SQL script here: BizTalk360 Secure SQL Server Query to check BRE that are not in a Deployed state.
Nevertheless, you cannot implement monitoring capabilities on these Secure SQL Queries. This feature was made for allowing support persons to safely execute custom queries without impacting the environment.
So, I wanted to go a little further, and to do that I asked my great friend Lex Hegt (Technical Lead at BizTalk360) to help me to implement a monitoring mechanism for this strategy, using the existing features in BizTalk360 and… we did it!

How to monitor BRE using BizTalk360
The easy way for you is to download and import the BRE monitor alarm that I, along with Lex, developed here: BizTalk360 Monitor BRE Undeployed policies alarm.
To do that, after you download the zip file containing alarm information, you should:
- Access to BizTalk360 and click ‘Settings‘ button on the upper right corner

- Select the ‘Import and Export‘ option from the left tree menu and select ‘Import‘

- Import operation is a 5-step process, as shown below:
- Step 1 – Select configuration file (zip file containing alarm information): This is very straightforward, you just click on the ‘Select Files‘ button to choose the configuration file, or you can drag and drop the configuration file into the user interface as shown below.

-
- Step 2 – Choose the alarms you wanted to import: Once the configuration file is selected, the wizard will automatically move forward into step 2 and display all the alarms that are present in the configuration file. You can then either choose to import all of them or select only the specific alarms you wanted to import as shown below.
- As you will see in the picture below, we also include the Secure SQL Queries, you should also select them;

-
-
- Note that by default all the alarms are kept in disabled status to avoid sending unnecessary notification after import, you may want to review all the configuration before enabling it
- Step 3 – Map environment discrepancies: Once you have chosen the relevant alarms to import, the system will detect if there is any mapping required between the source system and destination system. The three common things that will require mapping are BizTalk Server, SQL Server, and SQL Server Instance names since they will, for sure, differ between environments. The third screen ‘Map Environment‘ will give the user the option to do this mapping as shown below.

-
- Step 4 – Review the summary: On the fourth screen, based on the selection and mapping so far, will give a final summary report. It will also give bit more detail on each alarm, for example which artifacts are configured in each one of them (you need to expand the down arrow to view it). Once you are happy, you can just click on the ‘Import‘ button

-
- Step 5 – Result summary and exception handling: Once the import button is clicked, all necessary backend calls will be made, and the result of the import process will be shown. You can view all the details like which artifacts are imported, what mapping applied etc. If there are any errors during the import process in specific alarms, those will be displayed as well
- Once you close the import wizard, you can navigate to the ‘Manage Alarms‘ screen in the Monitoring section, and you can view all the imported alarms.

Of course, you can always create your alarm manually by:
- Click ‘Monitoring‘ in the Navigation panel
- Click ‘Manage Alarms‘ tab
- Click ‘New Alarm‘
- Enter a descriptive name for the Alarm, Email id (you can enter multiple email ids as comma separated values), and Alarm Description
- Click ‘Next‘ to enter the Threshold Alarm page
- Select the ‘Alert on threshold violation’ check box if you want to be alerted upon a threshold violation.
- Click ‘Next‘ to enter the Health Monitoring Alert page
- This step is optional, if you want to use the alarm for regular health/status check, you can select day(s)/time when you want to receive the status alert
- Click ‘Next‘ to move to the screen to set up data monitoring alert.
- Select the checkbox ‘Use this alarm for data Monitor Alerts’ if you wish to associate the current alarm with the data monitors.
- Select the checkbox ‘Notify on Success as well’ to receive success email alerts for the configured data monitors. If you do not choose the second checkbox, you will not receive the success email alerts.
- Click ‘Next‘ to move to the last section of adding the Advanced Settings information
- All the settings in the Advanced settings page are optional. Set the phone number to receive the Notification SMS when the alert is triggered. As with the email ids, you can enter multiple phone numbers as comma separated values.
- Click ‘OK‘ to create the alarm
- The alarm will be created, and you will be redirected to the Manage Alarms page
But if you choose this approach you will them need to:
- Select the ‘Manage Mapping‘ in the Navigation pane under ‘Monitoring‘ and then:
- Select the alarm you just created above or that you already have in your environment
- Select the tab option ‘Database Query‘
- Finally, create two new queries, by selecting the button ‘New Query‘
- One for monitoring BRE on Published state
- Another for monitoring BRE on Saved state

-
- After you press the ‘New Query‘ button you need:
- Enter the Name for the Database Query
- Add the SQL Instance name
- And the SQL Database name
- This need to be “BizTalkRuleEngineDb“

-
- Click ‘Next‘ to add the Query and Threshold details
- This will define when BizTalk360 must return an alert and notify us if any non-compliance occurs


If you noticed, my queries have a red flag which means that I have non-compliance BRE and I will get an alert.
Now you have your favorite monitoring tool be able to monitor the state of your BRE!
Author: Sandro Pereira
Sandro Pereira is an Azure MVP and works as an Integration consultant at DevScope. In the past years, he has been working on implementing Integration scenarios both on-premises and cloud for various clients, each with different scenarios from a technical point of view, size, and criticality, using Microsoft Azure, Microsoft BizTalk Server and different technologies like AS2, EDI, RosettaNet, SAP, TIBCO etc. View all posts by Sandro Pereira
by Senthil Kumar Palanisamy | Nov 14, 2018 | BizTalk Community Blogs via Syndication
Introduction
BizTalk360 is a tool for operating, monitoring and getting analytical information for BizTalk environment(s). BizTalk360 comes with productivity tools like the Advanced Event Viewer, the Throttling Analyzer, the Backup/DR visualizer, the BizTalk Health Monitor etc. These tools are also designed to help support people to perform their activities in a seamless way. BizTalk Server, being middle-ware, high volumes of data passes through the Message Box. Based on the business requirements, Tracking is enabled for important BizTalk Integration transactions.
In similar fashion, BizTalk360 collects important information to perform various activities in operations, monitoring and analytics section. In this article, we show BizTalk360’s data collection features and how you can configure the settings to optimize the data collection.
Advanced Event Viewer
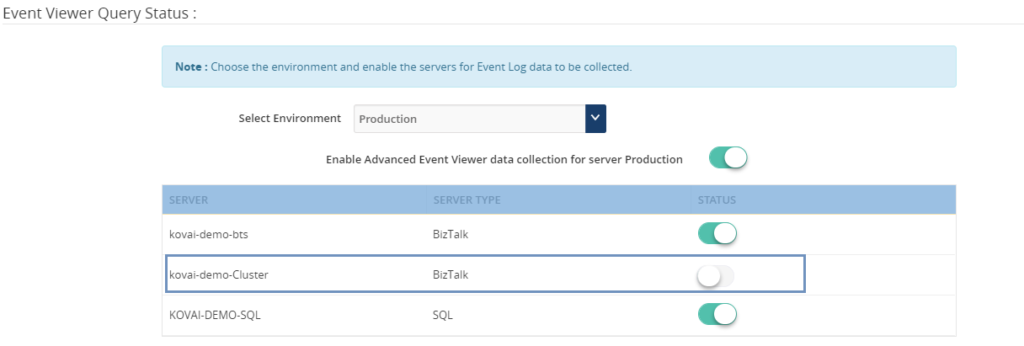
The Event Log is an important component which is used by BizTalk Administrators to investigate, if any configuration or transaction errors have happened in BizTalk Server. The Advanced Event Viewer is a powerful feature in BizTalk360 which in fact is a central repository for collecting the event logs from multiple BizTalk servers and SQL servers in BizTalk environment. It has the capability to filter the event logs by various parameters like Event Id, Event Type, Sources etc.
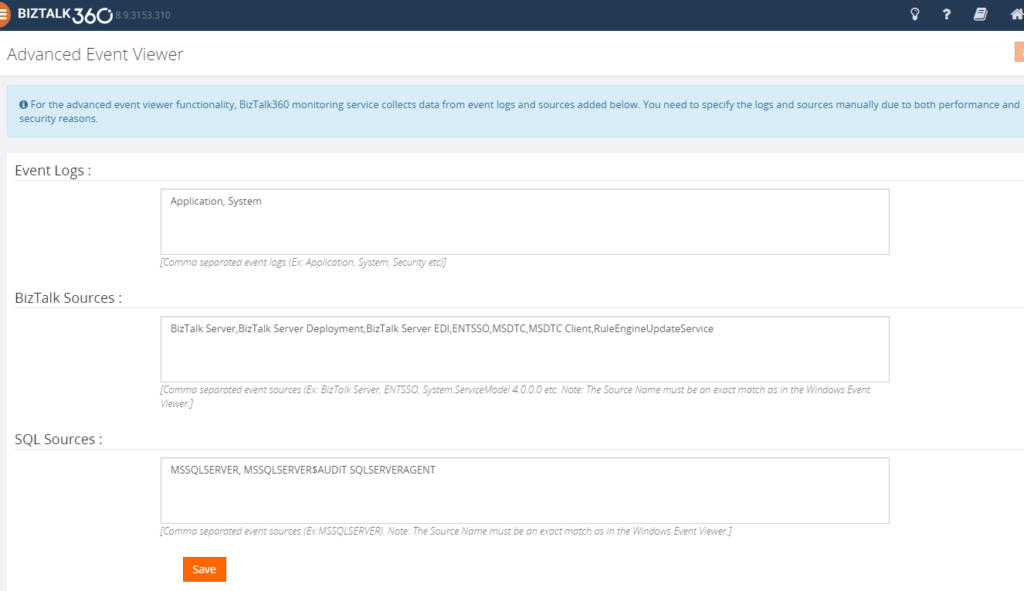
The BizTalk360 Monitoring service collects the event log information based on Event Logs and Event Sources which are configured in the BizTalk360 Advanced Event viewer settings.
BizTalk360 Monitoring IOPS
BizTalk360 uses Windows Management Instrument (WMI) queries to collect the event log details from BizTalk Servers and SQL Servers in an environment. In a multi-server BizTalk environment, few customers raised concern about BizTalk360 IOPS (input/output operations per second). In this set-up, there is change of high volume of IOPS in BizTalk360 Box (Monitoring Service).
BizTalk360 Recommendation
To avoid large volume of data collection or to improve the performance of the BizTalk360 monitoring services, following event log configuration are suggested
1. Enable the necessary servers to collect Event Logs and Event Sources
• Primary BizTalk Servers in Active – Passive scenario
• Multiple SQL server, enable the event log data collection for important nodes.
2. BizTalk360 provides a default set of Event Logs and Event Sources which are widely used in BizTalk and SQL servers. Configure the necessary Event Sources that are required as per the business requirement:
• BizTalk Event Log Sources(Default):
Bam Event Provider, BamManagementUtility,BAMWebServices,BizTalk DW Reporting, BizTalk Server, BizTalk Server Deployment, BizTalk Server EDI, BizTalk360 Monitor, BusinessRulesEngine, ENTSSO,MSDTC,MSDTC Client, RuleEngineUpdateService, System.ServiceModel 4.0.0.0, System.ServiceModel.Install 3.0.0.0,W3SVC-WP,XLANG/s
Configure required BizTalk Sources as
“BizTalk Server,BizTalk Server Deployment,BizTalk Server EDI,ENTSSO,MSDTC,MSDTC Client,RuleEngineUpdateService”
• SQL Sources(Default):
MSSQLSERVER, MSSQLSERVER$AUDIT, MSSQLServerOLAPService, SQLSERVERAGENT
Configure required SQL Sources as
“MSSQLSERVER, SQLSERVERAGENT”
Note: This configuration will reduce the BizTalk360 Input/Output operations. You can read this article to know more details about Event-Log Data collection configuration.
Analytics Performance Data
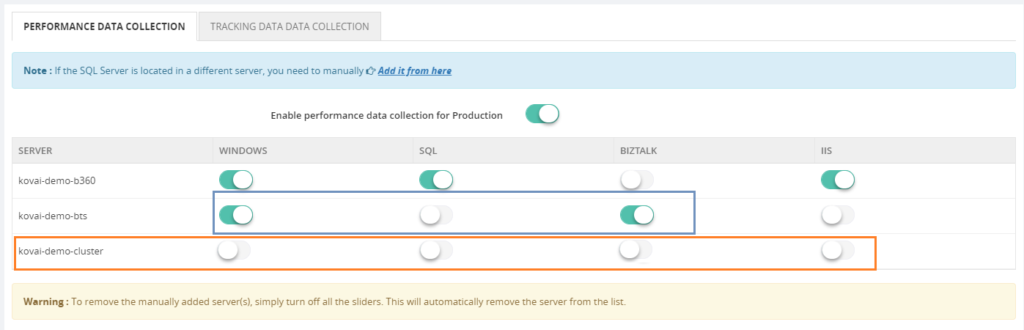
In a data-driven business setup, there will be scenarios where critical executive decisions are made based on the performance reports of various components of the listed servers in a BizTalk environment. BizTalk360 aims to offer an out of the box tool with similar capabilities as the Performance Monitor tool in Windows servers.
BizTalk360 Analytics offers visual display of the most important performance counters that are consolidated and arranged on a single screen so that the information can be monitored in a glance. Custom reports can be built in minutes with the metrics that really count for your business, and they are easy to share with other users. In addition, dashboards can give you a summary of many reports on a single page using drag-and-drop widgets for fast and easy customization.
Performance metrics data collection can be optimized by selecting the necessary metrics (Windows, SQL, BizTalk and IIS) based on the server type.
• BizTalk Server: Enable Windows, BizTalk by default. Web Application is configured in the server enable IIS and similarly to SQL.
• SQL Server: Enable Windows and SQL performance metrics
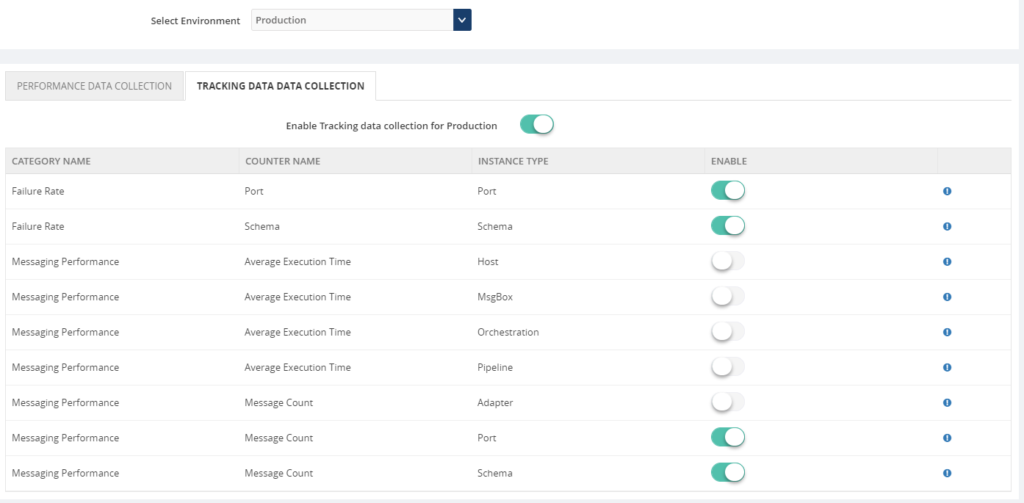
Tracking Data
Initial design of the tracking data widgets was simple; it ran the necessary queries directly against the Tracking database and displayed the results in a graphical form on the widget. A larger database degraded the performance of these queries and it had a direct impact on the user experience of the Analytics dashboard, causing slower widget loading and occasional time outs. Since Analytics widgets offered users the option to view data up to 30 days within the widget, an efficient approach was required to improve the performance and user experience.
In BizTalk360 v8.3 to overcome these challenges, we decided to create a service that runs in the background. This service collects the tracking data periodically in small chunks and thereby avoid running expensive queries on the Tracking database. Here, only the resulting metrics are collected rather than pulling all the tracking data to BizTalk360 database. This improves the overall performance of the Tracking widgets as they are not querying the Tracking database directly.
BizTalk360 Analytics needs the tracking data to represent data in custom widgets
• Failure Rate by Port and Schema
• Message Performance by Host, Orchestration, Pipeline, Adapter, Port and Schema
BizTalk360 suggests enabling the data collection for categories and counters needed in custom widgets. If you want custom widgets for Failure Rate and Message Performance of Port and schema, enable only those counters in Tracking data collection.
Data Purging
Collecting the necessary data is important to be able to represent the data in BizTalk360. However, you don’t want unlimited growth of your BizaTalk360 comes out of box with the “Data Purging” feature to able to manage the size of BizTalk360 database. If you want to know more about Data Purging please read this article.
Constantly manual monitoring the database size is a tedious process. You can utilize the Database Query monitoring when the database size is grown over the threshold limit.
SELECT total_size_mb = CAST(SUM(size) * 8. / 1024 AS INT)
FROM sys.master_files WITH(NOWAIT)
WHERE database_id = DB_ID()
Conclusion
We hope this article is useful to optimize and manage the data collection for various features in BizTalk360.
Get started with the free 30 days trial. For any queries/feedback please write to us [email protected].
Author: Senthil Kumar Palanisamy
Senthil Kumar Palanisamy is the Technical Lead at BizTalk360 having 14 years of experience in Microsoft Technologies. Worked various products across domains like Health Care, Energy and Retail. View all posts by Senthil Kumar Palanisamy
by Sandro Pereira | Nov 14, 2018 | BizTalk Community Blogs via Syndication
In the past, I release this PowerShell in order that any BizTalk Administrator to check and control which BizTalk Server Feature Pack was installed in your BizTalk environment. However, recently Niclas Öberg, another fellow “BizTalker” that I meet in London Integrate event warn me that my script didn’t recognize the existence of FP3… and he was correct
An alternative was to use BHM but the current version of BHM is also not checking for FP3 (only 1 or 2 – this limitation for sure will be fixed in next versions of BHM), you may get a warning messages saying that no CU or FP is installed, or you may get an FP2 warning messages like me:

Nevertheless, I have installed FP3 in my environment.
Of course, once again you can easily check this manually in the “Control PanelProgramsPrograms and Features” and then view the “View Installed Updates”, although this can be a very annoying task.
So, I decided to fix my PowerShell script and release a new version that will solve this problem. Now, if you run the script you will be able to receive the following output describing what FP was or is installed in your environment:
Microsoft BizTalk Server 2016 Feature Pack 1 is installed
Microsoft BizTalk Server 2016 Feature Update 2 with CU3 [KB4054819]LDR is installed
Microsoft BizTalk Server 2016 Feature Update 2 with CU4 [KB4077058]LDR is installed
Microsoft BizTalk Server 2016 Feature Update 3 [KB4103503]LDR is installed
The beauty of this script is that now it is prepared for detecting any other future PF that may be released by Microsoft, without the need for you to change the script.
...
    foreach ($Property in $key.Property)
    {
        if ($Property -like '*Microsoft BizTalk Server 2016 Feature Update *')
        {
            $findF2 = 1
            Write-Host "$($Property) is installed"
        }
    }
...
This script follows the sequence of scripts that I release in the past to check what Cumulative Updates where installed in the machines.
THIS POWERSHELL SCRIPT IS PROVIDED “AS IS”, WITHOUT WARRANTY OF ANY KIND.
 Check which BizTalk Server 2016 Feature Packs installed with PowerShell (2 KB)
Microsoft | TechNet Gallery
Author: Sandro Pereira
Sandro Pereira lives in Portugal and works as a consultant at DevScope. In the past years, he has been working on implementing Integration scenarios both on-premises and cloud for various clients, each with different scenarios from a technical point of view, size, and criticality, using Microsoft Azure, Microsoft BizTalk Server and different technologies like AS2, EDI, RosettaNet, SAP, TIBCO etc. He is a regular blogger, international speaker, and technical reviewer of several BizTalk books all focused on Integration. He is also the author of the book “BizTalk Mapping Patterns & Best Practices”. He has been awarded MVP since 2011 for his contributions to the integration community. View all posts by Sandro Pereira
by Sandro Pereira | Nov 13, 2018 | BizTalk Community Blogs via Syndication
After a tweet exchange with Mark Brimble a fellow “BizTalker” that I respect and admire, I realized that I had developed a PowerShell script some time ago to monitoring BRE Policies that could help him solve his problem. The initial question or need he was facing was:
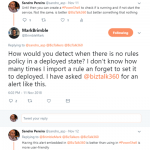
- How would you detect when there is no rules policy in a deployed state? I don’t know how many times I import a rule an forget to set it to deployed…

This is a common problem, and to be honest, I sometimes forget what is the correct state of a policy: Deployed or Published. (the correct answer is Deployed). And unfortunately, there isn’t a simple solution to solve this need and the solutions that I found was:
- Using BizTalkFactory PowerShell Provider that nowadays come with BizTalk Server (“SDKUtilitiesPowerShell” folder)
- Create my own monitor script – more work involved
Using BizTalkFactory PowerShell Provider is quite simple, but it has some limitations for what I would like to archive, for example, it only shows the policies that are bound to a particular BizTalk Application.

And I would like to know and have visibility to all of them because you don’t need to bind a policy to a BizTalk Application on the BizTalk Administration Console to use that policy.
And for that reason, I decide to create my own monitor script that I can easily change and optimize for my scenarios.
The problem I faced in the past was in fact quite similar to what Mark Brimble was describing, maybe with some small differences but the end goal is the same, so I decide to help him (at least try) and publish this PowerShell script.
The purpose of this PowerShell script is to:
- Monitor BRE Policies and check if the highest version of a given policy is on Deployed state
- If not notify someone (your BizTalk administration team);
So how can PowerShell help us?
With this script, you can be able to monitor your BizTalk Server BRE Policies, highest versions, that aren’t in the deployed state. Only if the script finds any non-compliance, an email notification will be sent.
Taking this sample:

The result will be a notification that includes two warnings:
- Policy1 is in a non-compliance state because version 1.2 is not deployed
- Policy2 is in a compliance state
- Policy3 is in a non-compliance state because version 1.2 is neither published nor deployed (this is optional, but I choose to include in my monitoring script)
This script is a combination of a PowerShell script and a SQL Server Script that allows you to set:
- Set your email notification settings:
#Set mail variables
[STRING]$PSEmailServer = "mySMTPServer" #SMTP Server.
[STRING]$SubjectPrefix = "MBV Notification Report -  "
[STRING]$From = "[email protected]"
[array]$EmailTo = ("[email protected]")
- And configure a SQL Server script, that in fact were the magic happens. The SQL Script will have the ability to check what rules are in a non-compliance state:
/****** Sandro Pereira & José Barbosa - DevScope  ******/
;with
cteHist as (
        select h.* from [BizTalkRuleEngineDb].[dbo].[re_deployment_history] h
join (select strname, max(dttimestamp) as dttimestamp from [BizTalkRuleEngineDb].[dbo].[re_deployment_history] group by strname) q on h.strName=q.strName and h.dtTimeStamp=q.dttimestamp
),
ctetDeployed as (
        SELECT StrName, nMajor, nMinor, nStatus
                                                FROM   (
                                                   SELECT StrName, nMajor, nMinor, nStatus
                                                                , row_number() OVER(PARTITION BY StrName ORDER BY nMajor, nMinor DESC) AS rn
                                                   FROM   [BizTalkRuleEngineDb].[dbo].[re_ruleset]
                                                   ) sub
                                                WHERE  rn = 1
)
select * from ctetDeployed d
where nStatus = 0
or exists (select 1 from cteHist h  where h.strName=d.strname and bDeployedInd=0)
The following Windows PowerShell script is a fragment that will help us demonstrate the monitoring capabilities:
$mydata = invoke-sqlcmd -inputfile $sqlQuery -serverinstance $server

Foreach ($log in $mydata)
{
    #Create mail body content
    $mailBody += "..."
}
Here is example expected report output from running the Windows PowerShell script sample, if any of the BRE Policies are in an unwanted state.

Note: This type of script must be viewed as a complement to the tools mentioned above or used in the absence of them. The script should also be adjusted to your needs.
THIS POWERSHELL & SQL SCRIPT ARE PROVIDED “AS IS”, WITHOUT WARRANTY OF ANY KIND.
Special thanks to my coworker José Barbosa for helping me optimize the SQL Server script!
The script can be found and download on Microsoft TechNet Gallery:
Monitoring BRE Policies in your BizTalk environment with PowerShell (18.0 KB)
Microsoft TechNet Gallery
Author: Sandro Pereira
Sandro Pereira lives in Portugal and works as a consultant at DevScope. In the past years, he has been working on implementing Integration scenarios both on-premises and cloud for various clients, each with different scenarios from a technical point of view, size, and criticality, using Microsoft Azure, Microsoft BizTalk Server and different technologies like AS2, EDI, RosettaNet, SAP, TIBCO etc. He is a regular blogger, international speaker, and technical reviewer of several BizTalk books all focused on Integration. He is also the author of the book “BizTalk Mapping Patterns & Best Practices”. He has been awarded MVP since 2011 for his contributions to the integration community. View all posts by Sandro Pereira
by Praveena Jayanarayanan | Nov 13, 2018 | BizTalk Community Blogs via Syndication
Introduction
In a data-driven business setup, there will be scenarios where critical executive decisions are made based on the performance reports of various components of the listed servers in their environment. BizTalk360 aims to offer an out of the box tool with similar capabilities as the Performance Monitor tool in Windows servers.
BizTalk360 Analytics offers visual display of the most important performance counters that are consolidated and arranged on a single screen, so that the information can be monitored in a glance. Custom reports can be built in minutes with the metrics that really count for your business, and they’re easy to share with other users in the system. In addition, dashboards can give you a summary of many reports on a single page, using drag-and-drop widgets for fast, easy customization.
The Analytics feature is available only to the Platinum licensed BizTalk360 environments. By default, the Analytics service is installed with BizTalk360 and in non-Platinum environments, users can only view sample analytics data.
The Analytics Widgets
It is with the Dashboard widgets that all the performance related information can be seen in a nice graphical display. In the Analytics section, there is also the reporting capability added, where the reports can be sent as attachment in emails.
In this blog I am going to explain a few scenarios where the Analytics widgets are more helpful. Let’s move on.
Customer Scenarios
The Analytics Dashboard contains lot of widgets that provide you detailed information of the performance of your BizTalk environment.
For example, the BizTalk Host Performance widget will help you to get the information of the top performing hosts in the BizTalk environment. The BizTalk messaging performance gives you the picture of the message count and average execution time of the total messages transferred during the configured datetime range.
Date Range – Select the date range for chart. The options are Last 24 hrs, Last 7 days, Last 30 days and Custom:
- Last 24 Hrs – Displays the data from last 24 hours
- Last 7 days – Displays the data from last 7 days
- Last 30 days – Displays the data from last 30 days
- Custom – To add a specific number of days, use the scroller to select the day
Based on the selected date range, the performance data gets collected from the BizTalk servers.
The other basic widgets include the Message volume and the Transmission failure rate widgets.
Lot more to do with Custom widgets
Don’t just stop with the basic widgets in the Analytics section; there is lot more to do with the Custom widgets.
Once the Analytics components, for which the data needs to be collected, are enabled, the different artifacts for the Custom widgets will get enabled. With the Custom widgets you can chose different metrics for which you want to view the data.
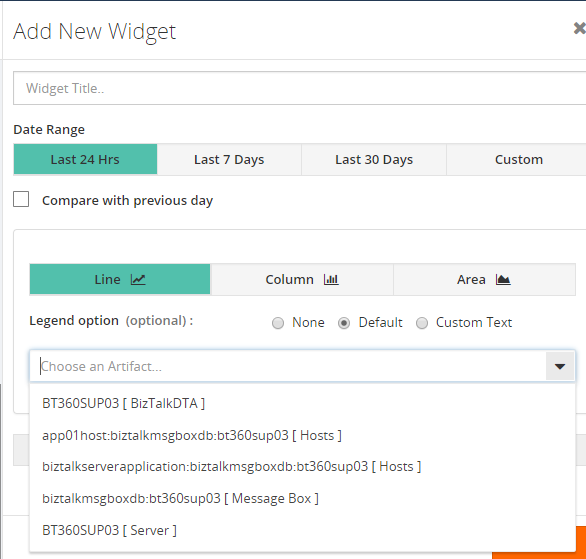
Let’s take a few scenarios to understand what we can achieve with the Custom widgets.
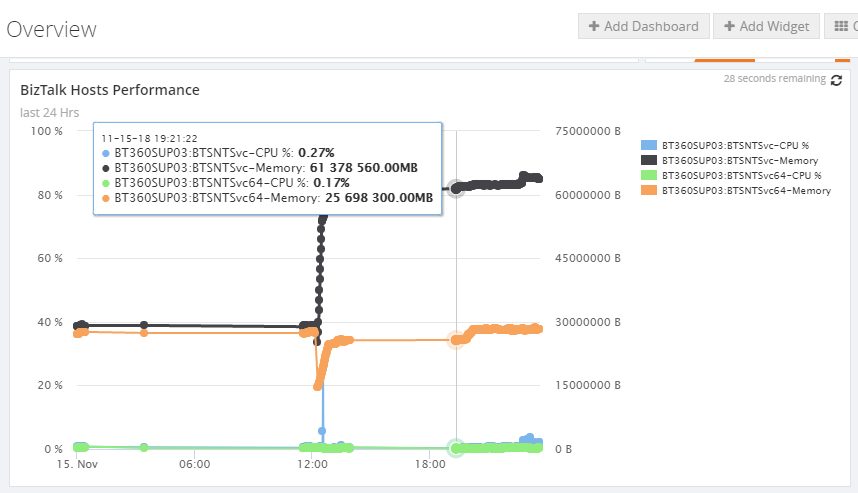
Comparing two BizTalk servers’ performances
There is a scenario where you would like to compare the performance of two BizTalk servers and see which one consumes more memory and CPU. This can be done by selecting the servers in the artifact section and corresponding metrics.
Get the message count for specific port
Of course, the count of messages passing through the port can be determined through process monitoring. But it will be checked with specific time intervals either in hours or minutes. But, what if you want to see the count instantly within the specific datetime range. Here comes the Custom widget, with which you can get the count of specific ports.
But to get these data, Tracking needs to be enabled for the ports. Based on the enabled tracking data collection counters, the data gets collected by the BizTalk360 Analytics service using the performance counters.
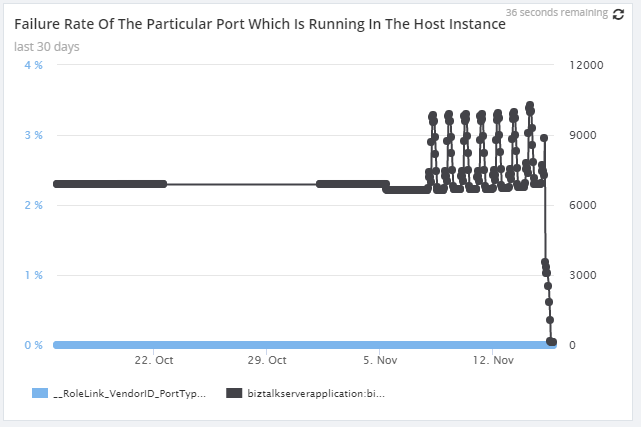
Failure rate of a port
Also, the failure rate of a particular port, running a specific host instance, can be determined with the help of a Custom widget. This would include the failure rate for the port and the number of instances running for that particular host. With the combination of these two metrics, the failure rate of a port can be determined and displayed in a nice graphical view.
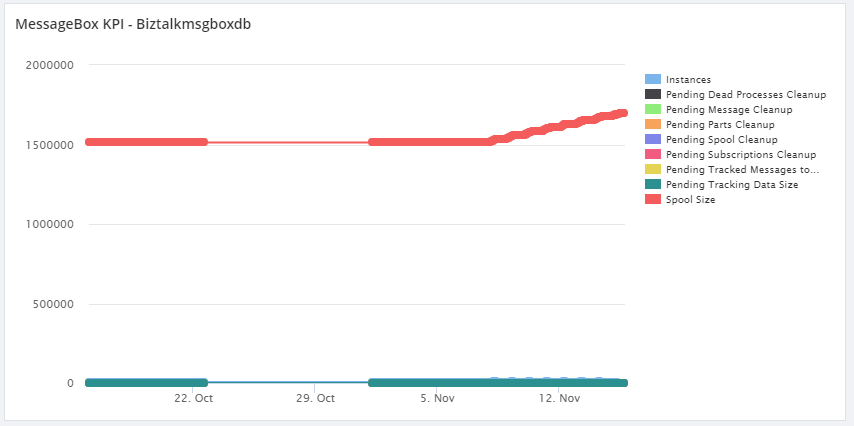
Checking the MessageBoxDb
There are also counters for checking the MessageBoxDB. The key performance indicators of the message box database which includes the spool size and the status of the pending jobs, can be visualised with the widgets.
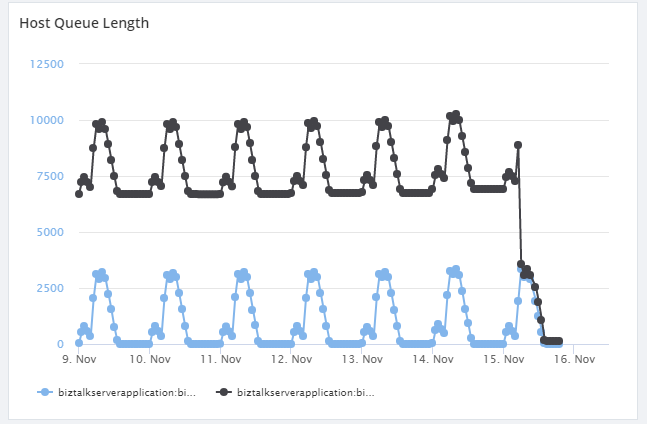
BizTalk Host Details
We do have certain metrics like Host Queue Length, number of instances and suspended instances for the particular hosts, which can be obtained from the custom widgets.
Above mentioned are the very few scenarios that can be achieved using the widgets. With the different combinations of the metrics, all performance related information can be obtained through the Analytics widgets.
Conclusion
Do you wish to see more information on the widgets or from the product itself, please put in your suggestions and feedback in our user voice portal https://feedback.biztalk360.com/. The existing ideas can also be voted for. We at BizTalk360 aim at providing the features that fulfill the customer requirements. It is from this feedback portal that the features get picked up for every release.
For more information about how these widgets work, check our Documentation portal.
Happy monitoring with BizTalk360 😊
Author: Praveena Jayanarayanan
I am working as Senior Support Engineer at BizTalk360. I always believe in team work leading to success because “We all cannot do everything or solve every issue. ‘It’s impossible’. However, if we each simply do our part, make our own contribution, regardless of how small we may think it is…. together it adds up and great things get accomplished.” View all posts by Praveena Jayanarayanan
by Sandro Pereira | Nov 12, 2018 | BizTalk Community Blogs via Syndication
I love this project! I have much fun doing it, and I use it a lot in my clients. So for me is what I call a win-win situation. So today I update BizTalk Mapper Extensions UtilityPack project with one new Functoid that you can use on your BizTalk Server maps Functoid: String Splitter Functoid.
Last week I had the needed to use a particular mapping functionality several times in different maps:
- Extract one specific subset of a concatenated string;
- For example “AA.123.SANDRO.312” and I need to extract the third position: “SANDRO”
My first strategy was to create a Scripting Functoid, but because I have to use it in different maps, I quickly change my approach and created this new Functoid that now you can use inside your BizTalk Server maps.
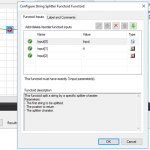
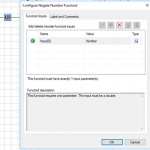
String Splitter Functoid
This functoid allows you to convert a string to a number (integer)
Parameters
This functoid split a string by a specific splitter character, and it accepts 3 inputs:
- The first parameter is the input value to be split;
- AA.123.SANDRO.312
- AA-123-SANDRO-3122.
- The second parameter is the position to be returned (the subset of the string to be retrieved);
- The third parameter is the splitter character;
The output of the functoid will be a string present in the split array, example: SANDRO

In this In sample described in the above picture, we are receiving a string: “AA.123.SANDRO.312.1” and we want to retrieve the fourth subset of the concatenated string delimited by “.” character. So, in this case, the functoid will return: “1”.
BizTalk Mapper Extensions UtilityPack: Project Description
BizTalk Mapper Extensions UtilityPack is a set of libraries with several useful functoids to include and use it in a map, which will provide an extension of BizTalk Mapper capabilities.
Where to download?
You can download this functoid along with all the existing one on the BizTalk Mapper Extensions UtilityPack here:
BizTalk Mapper Extensions UtilityPack
GitHub
Author: Sandro Pereira
Sandro Pereira lives in Portugal and works as a consultant at DevScope. In the past years, he has been working on implementing Integration scenarios both on-premises and cloud for various clients, each with different scenarios from a technical point of view, size, and criticality, using Microsoft Azure, Microsoft BizTalk Server and different technologies like AS2, EDI, RosettaNet, SAP, TIBCO etc. He is a regular blogger, international speaker, and technical reviewer of several BizTalk books all focused on Integration. He is also the author of the book “BizTalk Mapping Patterns & Best Practices”. He has been awarded MVP since 2011 for his contributions to the integration community. View all posts by Sandro Pereira
by Raja Sreenivasan | Nov 8, 2018 | BizTalk Community Blogs via Syndication
Introduction
In this article, we will provide an introduction of IBM MQ, how BizTalk Server can connect to IBM MQ and how to setup monitoring of IBM MQ Queues with BizTalk360.
IBM® MQ, formerly known as WebSphere MQ, is messaging-oriented middleware, which simplifies and accelerates the integration of different applications and data across multiple platforms. It uses message queues to exchange information for independent and non-concurrent applications in distributed systems. IBM MQ is available for large number of platforms, being:
- z/OS (mainframe)
- OS/400 (IBM System I or AS/400)
- UNIX (AIX, HP-UX. Solaris)
- HP Nonstop
- Linux
- OS 2000
- Microsoft Windows
Microsoft Windows Platform
IBM MQ is messaging and queueing middleware, with several modes of operation:
-
- Point-to-point
- Publish/Subscribe
- File Transfer
For the Microsoft platform, users can create and manage IBM MQ with two options:
- MQ Explorer GUI
- Running commands from command window or application.
For installing the MQ Explorer GUI, you can refer to this link and for installing the server using msiexec you can go to this link.
BizTalk Server and IBM MQ
As a middleware product, BizTalk Server can also connect to IBM MQ. For using IBM MQ with BizTalk Server, there are two adapters available.
- MQSeries Client (MQSC) Adapter
- MQSeries Adapter
MQSeries Client (MQSC) Adapter
The MQSC Adapter is available in the BizTalk Adapter for Host Systems installation that is part of Host Integration Server(HIS). This adapter is a light weight component of MQ that doesn’t require the MQSeries Queue Manager run-time code to reside on a client system. This adapter helps to connect IBM MQ queue manager on Windows and non-Windows platform. Using the MQSeries Client Adapter can do the following actions:
- Send and receive messages from local Queue, MQSeries Remote Queue, Transmission Queue, and Alias queue from BizTalk Server
- Connect Remote queue manager that reside on Windows platform or another platform directly from BizTalk server
- It Support Clustered MQSeries Queue Manager and clustered BizTalk servers
- It provides support Secure Socket Layer(SSL) for secure communication with MQSeries Queue Manager
MQSC Adapter Configuration
In a real-time scenario, the setup would be the following when using two servers
|
Server 1 (Windows)
|
Server 2 (Windows/Non-Windows)
|
|
BizTalk Server
|
WebSphere MQ
|
|
MQSC Adapter
|
|
|
WebSphere MQ Client (available from IBM)
|
|
If you want to use the WebSphere MQ Extended transactional client, you can use WebSphere MQ Client in Server 1.
MQSeries Adapter
MQSeries adapter requires IBM MQSeries Server for Windows to reside on the client system to communicate with an IBM WebSphere Queue Manager running on Windows or non-Windows. MQSeries comes with BizTalk Server installation. This adapter uses the MQSAgent2 COM+ application to put/get messages into the IBM MQ Queue Manager. Using the MQSeries Adapter can do the following actions:
- Send and Receive messages from local Queues, MQSeries Remote Queues, Transmission Queues, and Alias queues from BizTalk Server
- Send and Receive messages from MQSeries Server for Windows. You need to deploy one copy of MQSAgent (COM+ of the adapter) to support BizTalk server installation
- Dynamically create queues at runtime
- Request for Delivery of transactional and non-transactional messages for send and receive
- Dynamically receive messages from queues based on MQSeries MatchOptions
MQSeries Adapter Configuration
IBM MQ can be installed in multiple different configurations. Below you find an overview of which components need to be installed in case IBM MQ will be installed on one, two or three servers.
For configuring the MQSeries Adapter on a single Server:
|
Server 1 (Windows)
|
|
BizTalk Server
|
|
MQSeries Adapter
|
|
MQSAgent2 COM+ Application
|
|
WebSphere MQ
|
And for the configuring it in two servers:
Case 1 – Installation while combining Windows and Non-Windows servers
|
Server 1 (Windows)
|
Server 2 (Windows/Non-Windows)
|
|
BizTalk Server
|
WebSphere MQ
|
|
MQSeries Adapter
|
|
|
MQSAgent2 COM+ application
|
|
|
MQSeries Server for windows
|
|
Case 2 – Installation on 2 Windows servers
|
Server 1 (Windows)
|
Server 2 (Windows)
|
|
BizTalk server
|
MQSAgent2 COM+ application
|
|
MQSeries adapter
|
WebSphere MQ
|
If you want to configure MQSeries Adapter on three servers, the configuration would be as follows:
|
Server 1 (Windows)
|
Server 2 (Windows)
|
Server 3 (Windows/Non-Windows)
|
|
BizTalk Server
|
MQSAgent2 COM+ Application
|
WebSphere MQ
|
|
MQSeries Adapter
|
MQSeries Server for windows (Available from IBM)
|
|
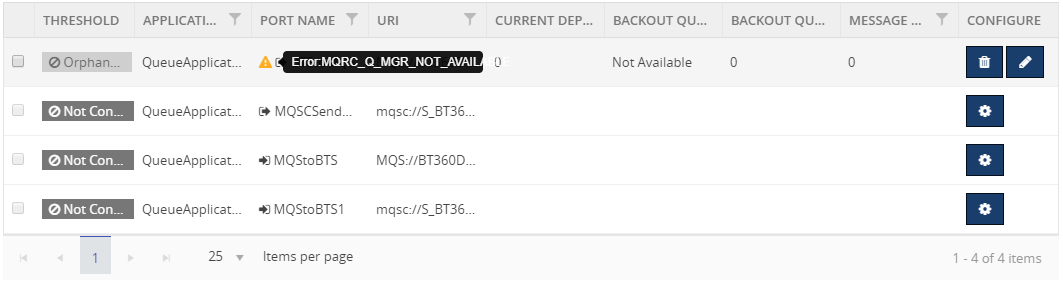
Monitoring IBM MQ with BizTalk360
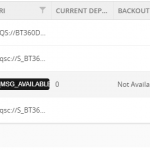
BizTalk360 has the capability to monitor the IBM MQ Queues that are configured with the receive location and send ports mapped with either MQSeries Client Adapter or MQSeries Adapter. BizTalk360 has the following requirements:
- Monitor the accessibility of the queue manager and queues
- Monitor the growth of queues and corresponding backout queue
- Identify the backout queues automatically and start monitoring them
You can refer to this link for an article about how to configure an IMB MQ queue for monitoring with BizTalk360.
Errors while connecting from BizTalk360 to IBM MQ
Customer might face errors or technical challenges while configuring BizTalk360 to monitor IBM MQ queues. Some of the error codes are:
- 2033 – MQRC_NO_MSG_AVAILABLE
- 2035 – MQRC_NOT_AUTHORIZED
- 2059 – MQRC_Q_MGR_NOT_AVAILABLE
- 2538 – MQRC_HOST_NOT_AVAILABLE
We can see the details about the errors and resolution:
MQRC_NO_MSG_AVAILABLE – 2033
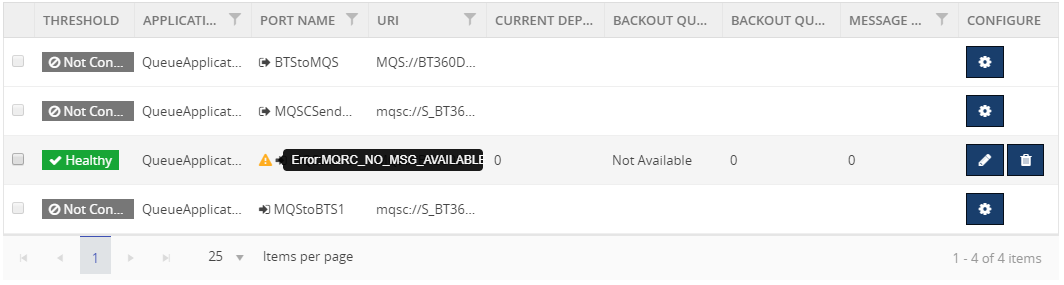
Reason: There is no message on the queue
Resolution: This is an expected condition; no corrective action is required.
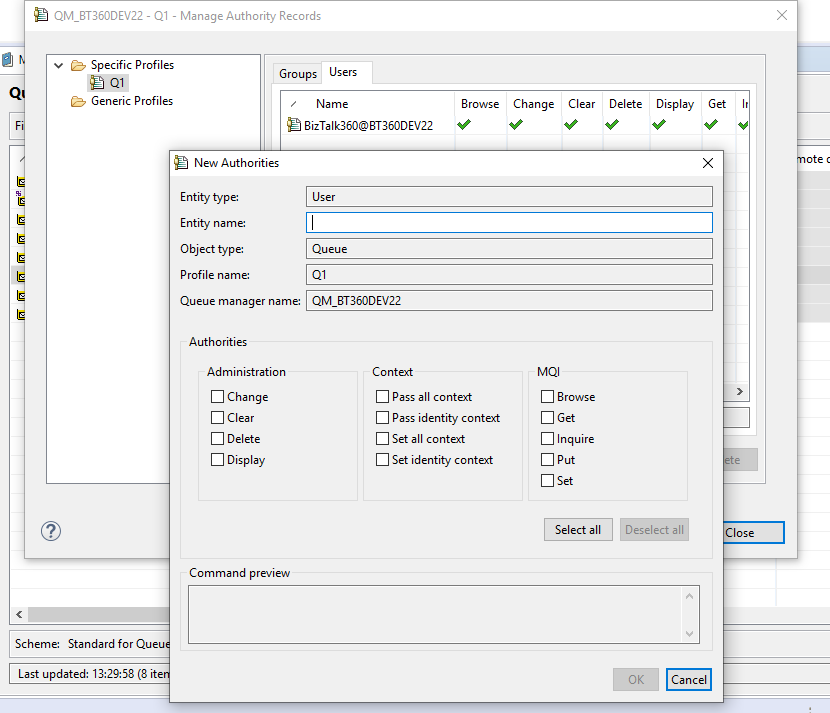
MQRC_NOT_AUTHORIZED – 2035
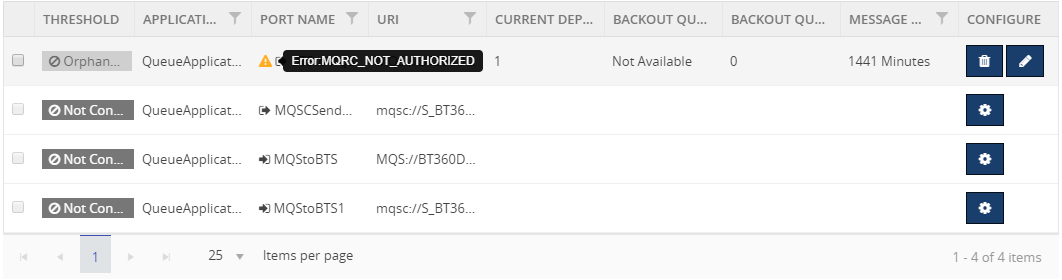
Reason: Trying to open a queue in a cluster
Resolution: create a local alias to the cluster queue, or authorize all users to have access to the transmission queue
Provide object authorities in the queue level or queue manager level to the user in the MQ Explorer.
MQRC_Q_MGR_NOT_AVAILABLE – 2059
Reason:
- The default queue manager is not running
- The MQ listener program associated with the default queue manager is not running
- The default queue manager is not defined on the local system
Resolution:
- Determine the name of the queue manager
- Verify that the queue manager exists on the local machine, and that it is running
- Verify that the listener program is running
- Verify that queue manager trying to connect is the default queue manager
- If necessary, make queue manager as the default queue manager
MQRC_HOST_NOT_AVAILABLE – 2538
Connect to a queue manager but the attempt to allocate a conversation to the remote system failed.

Reason:
- The listener has not been started on the remote system
- The connection name in the client channel definition is incorrect
- The network is currently unavailable
- A firewall blocking the port, or protocol-specific traffic
- The security call initializing the IBM MQ client is blocked by a security exit on the SVRCONN channel at the server
Resolution: Examine the client error log for messages explaining the cause of the problem
Here is the link of list of error codes while using IBM MQ.
Hope you found this article helpful. If you have any feedback or suggestions, please add it in our feedback portal. You can get started with monitoring IBM MQ by downloading the 30-day free trial of BizTalk360.
by Sandro Pereira | Nov 7, 2018 | BizTalk Community Blogs via Syndication
And once again I decide to publish another release on my Mapper Extensions UtilityPack project adding new functionalities to this toolset. This time I decided to release 2 new BizTalk Math Functoids:
- Negate Number Functoid: You can use the Negate Number functoid to return the input number (double) in its negated form.
- If it’s positive, it will return as negative and vice-versa.
- If zero, of course, will return zero.
- SmartRound Functoid: You can use the SmartRound Functoid to return any number (int or double) rounded up or down to any decimal place, specified by the second parameter of this functoid.
Negate Number Functoid
Use the Negate Number functoid to return the input number (double) in its negated form.
Parameters
The functoid takes one mandatory input parameter:
- Parameter 1: Number to be negated (double or int).
The output of the functoid will be the input number in is negative form. For example:
- Input 1 –> Output = -1
- Input -23,09 –> Output = 23,09
- Input 0 –> Output = 0

SmartRound Functoid
Use the SmartRound Functoid to return any number (int or double) rounded up or down to any decimal place, specified by the second parameter of this functoid.
Parameters
The functoid takes two mandatory input parameters:
- Parameter 1: Number to be rounded (double or int)
- Parameter 2: Number to decimals places
The output of the functoid will be the input number rounded up or down to the specified decimal places. For example:
- Input 23 rounded to 2 –> Output = 23,00
- Input 24,005900 rounded to 3 –> Output = 24,006

BizTalk Mapper Extensions UtilityPack: Project Description
BizTalk Mapper Extensions UtilityPack is a set of libraries with several useful functoids to include and use it in a map, which will provide an extension of BizTalk Mapper capabilities.
Where to download?
You can download this functoid along with all the existing one on the BizTalk Mapper Extensions UtilityPack here:
BizTalk Mapper Extensions UtilityPack
GitHub
Author: Sandro Pereira
Sandro Pereira lives in Portugal and works as a consultant at DevScope. In the past years, he has been working on implementing Integration scenarios both on-premises and cloud for various clients, each with different scenarios from a technical point of view, size, and criticality, using Microsoft Azure, Microsoft BizTalk Server and different technologies like AS2, EDI, RosettaNet, SAP, TIBCO etc. He is a regular blogger, international speaker, and technical reviewer of several BizTalk books all focused on Integration. He is also the author of the book “BizTalk Mapping Patterns & Best Practices”. He has been awarded MVP since 2011 for his contributions to the integration community. View all posts by Sandro Pereira
by Rochelle Saldanha | Nov 6, 2018 | BizTalk Community Blogs via Syndication
Continuing in our series of blogs, Customer feedback getting Answered, where we will be trying to address and answer some of the issues, where a workaround is possible, rather than awaiting a new feature release.
Today we will address an issue relating to BizTalk Health Monitor (BHM) integration in BizTalk360.
Issue at hand
One of our existing customers posted the following feedback request: http://feedback.biztalk360.com/forums/331695-biztalk360-operations/suggestions/20567692-bhm-bt360-profile-use-monitoring-profile
He wanted to specify or change the BHM Monitoring Profile that BizTalk360 should use.
Monitoring Profile in BHM
The BizTalk snap-in, “BizTalk Health Monitor” (aka “BHM”), has so been created to help you easily monitor the health of your BizTalk environment. BHM is based on the same engine as MBV. This snap-in can be added to the existing BizTalk Administration Console or can be run individually in its own MMC window.
A Monitoring profile is in fact a BHM profile, but configured specifically to execute a short selection of critical BHM queries/rules and custom rules checking the state of given ports, orchestrations, host instances, queues and BizTalk databases sizes and raise critical warnings detected in a log.
Current Working of BizTalk360 integrated BHM
The BizTalk360 product integrates with BHM, but currently has the limitation that you cannot specify a profile, that is stored in BHM, which should be scheduled and run at those specific times.
Solution Workaround
If you wish for BizTalk360 to run a certain BHM profile – Follow the below workaround.
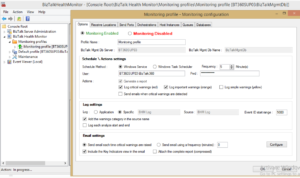
- Save the Profile. This will automatically save a copy in the folder – C:ProgramDataMicrosoftBizTalkHealthMonitor with the name MBVSETTINGS_.xml
- Now you need to copy this XML file and paste it in the BizTalk360 folder – C:Program Files (x86)Kovai LtdBizTalk360Service.
- Delete the existing MBVSETTINGS.xml and rename the copied file to MBVSETTINGS.xml
Now BizTalk360 has been setup to pick that Profile to execute in it’s scheduled runs. Then, the next time you hit -> ‘Run BHM now‘, or BizTalk360 scheduled runs for BHM start, BizTalk360 will pick that profile and run the rules for it.
Hope you found this workaround helpful.
Thanks to our customer Joost for his help in the investigation.
Author: Rochelle Saldanha
Rochelle Saldanha is currently working in the Customer Support & Client Relationship Teams at BizTalk360. She loves travelling and watching movies. View all posts by Rochelle Saldanha


