by Sandro Pereira | Aug 20, 2019 | BizTalk Community Blogs via Syndication
Following my commitment with the attendees at Integrate 2019 London and US that shared with me the same headaches and concerns, and following my series of posts about “BizTalk Bindings Exportation” published on BizTalk360 blog. I’m happy to announce the birth of a new BizTalk Server tool: BizTalk Bindings Exporter Tool.
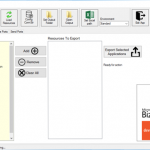
“BizTalk Binding Exporter Tool” is a simple tool which will suppress the absence of advanced binding file generation capabilities in the BizTalk Server Administration Console allowing you to generate and export a binding file from BizTalk Applications in an intuitive and easy way.
Exporting a BizTalk Server Application binding is, at first sight, a simple and quick task that can be done using the BizTalk Server Administration Console:
- Click Start, click All Programs, click Microsoft BizTalk Server 20xx, and then click BizTalk Server Administration
- In the console tree, expand BizTalk Server Administration, expand the BizTalk Group, and then expand Applications
- Right-click the application whose bindings you want to export, point to Export, and then click Bindings…
- On the Export Bindings page, in Export to file, type the absolute path of the .xml file to which to export the bindings
- Ensure that Export all bindings from the current application option is selected, and then click OK
But even in simple tasks, we may encounter challenges that require us to perform some monotonous and boring manual operations that consume some of our precious time and are always subject to failures. Because out-of-the-box BizTalk Administration Console doesn’t allow you to:
- Export a Binding file of a specif Receive Port or list of Receive Ports;
- Export a Binding file of a specif Send Port or list of Send Ports;
- Export a Binding file of a specif Assembly or list of Assemblies;
And these are just a few scenarios. You can only fully Export the binding files of an entire application which will lead you sometimes an extensive and fallible manual work to clean the binding files.
Normally the binding exportation starts in development, but we also will need to generate the same bindings for other environments like production and for that we normally need to open the binding file and replace/fix the differences for each different environment… which is normally a tedious operation. What we need to replace is mainly:
- the URI’s: it should be fixed, but it is not mandatory. If you know what you are doing, you can fix them directly on the environment after you import the Binding.
- the host instances: not mandatory, if you have the same host and host instances names across all your different environments (as best practices will tell you to do).
- the NT Group Name associated in the Services (Orchestrations): according to securities best practices you shouldn’t use the same BizTalk Groups in different environments, so in this case, if you follow this best practices, you need to change these parameters in your binding file.
Normally, everyone changes the URI’s but neglecting the other parameters may be causing problems during the Binding import.
Once again, this tool will extend default BizTalk Server capabilities transforming the tedious and sometimes complicate binding generation a little simple and easy.

You just need to specify the connection string to the BizTalk Management database (BizTalkMgmtDb)

And this tool allows you to generate and export binding files with the following capabilities:
- Export binding(s) file(s) for an entire Application or a list of Applications;
- Export binding(s) file(s) from a specify Assembly or list of Assemblies;
- Export binding(s) file(s) from a Receive Port or list of Receive Ports;
- Export binding(s) file(s) from a Send Port or list of Send Ports;
- Or Generate different binding files for each environment if you create an Excel File with the mapping for each environment ;
Credits also to my team member at DevScope, Pedro Almeida that collaborated in the development of this tool.
You can download BizTalk Bindings Exporter Tool from:
 BizTalk Bindings Exporter Tool
GitHub
Or from:
BizTalk Bindings Exporter Tool
Microsoft | Code Gallery
The post BizTalk Bindings Exporter Tool appeared first on SANDRO PEREIRA BIZTALK BLOG.
by Saranya Ramakrishnan | Aug 14, 2019 | BizTalk Community Blogs via Syndication
BizTalk360 is a one-stop tool for operations, monitoring and application performance management (APM) of BizTalk environments.
We get to see a few of our customers utilizing modern SaaS-based Application Monitoring/Analytics platforms like New Relic, AppDynamics, Dynatrace, etc., for their global enterprise analytics/monitoring requirements. In earlier releases, we have already integrated New Relic and AppDynamics in BizTalk360.
In BizTalk360 version 9.0 Phase 2, we have integrated Dynatrace in BizTalk360; with this, you can see the BizTalk Server related performance metrics in Dynatrace.
Why did we integrate Dynatrace in BizTalk360
Dynatrace is an APM tool which has a generic capability to monitor operating systems, network protocols, system metrics, network infrastructure, applications, etc. However, there is no out of the box Dynatrace plugin or agent for BizTalk Server. This means that the user needs to install an open-source plugin Fastpack (which has been updated a couple of years back and it is not up to date with the latest BizTalk release) on all the BizTalk Servers running in the environment, along with some configuration changes at BizTalk host instances config file btsntsvc.exe.config. BizTalk360 is an agentless, non-intrusive software product which requires zero configuration on BizTalk servers.
Here you can see the BizTalk360 and Dynatrace comparison in detail.
As mentioned, few of our customers are using SaaS-based analytics platforms and they would like to see the BizTalk360 Analytical data (collected for BizTalk Server environment) over there. So we thought of integrating APM tools in BizTalk360.
How does BizTalk360 collect performance metrics
Unlike other tools, BizTalk360 doesn’t need an agent to be installed in the BizTalk Servers to collect performance data and it does not require any configuration changes at the server level.
Just follow the below simple steps:
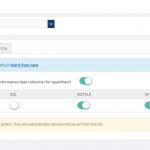
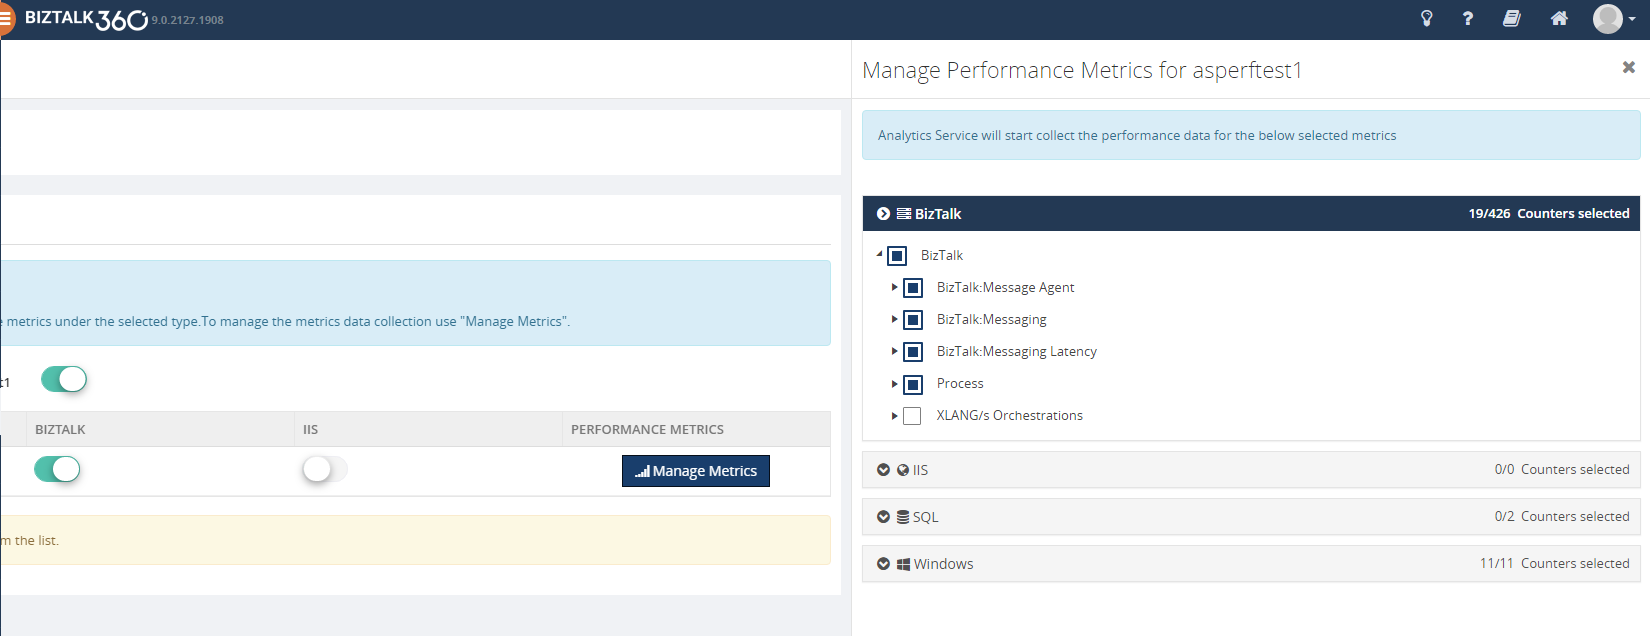
- In the BizTalk360 Analytics configuration section, choose the various performance counters that you want to collect data
- Enable the Performance data collection for the respective BizTalk/SQL servers of your BizTalk environment
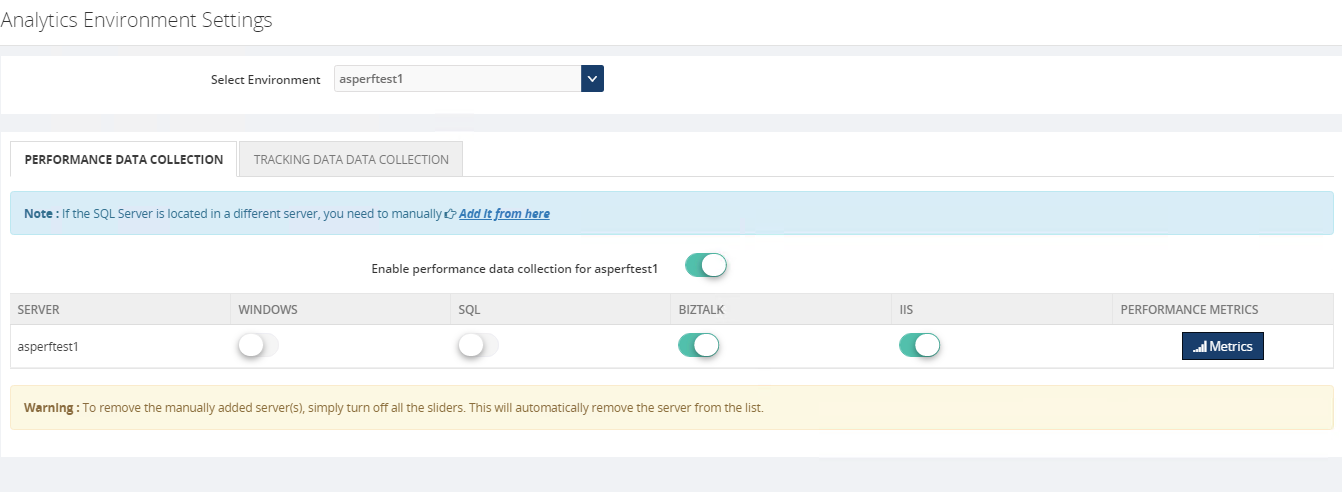
That’s it! Now the BizTalk360 Analytics Service will start collecting the performance data for the selected performance counters in the respective servers.
The cool thing here in BizTalk360 is, it’s not required that the BizTalk360 Analytics Service should run on all the BizTalk (and/or SQL) servers in your BizTalk environment.
BizTalk360 has a purging policy with which you can easily maintain the collected performance data and, to avoid performance issues, purge it after the configured period.
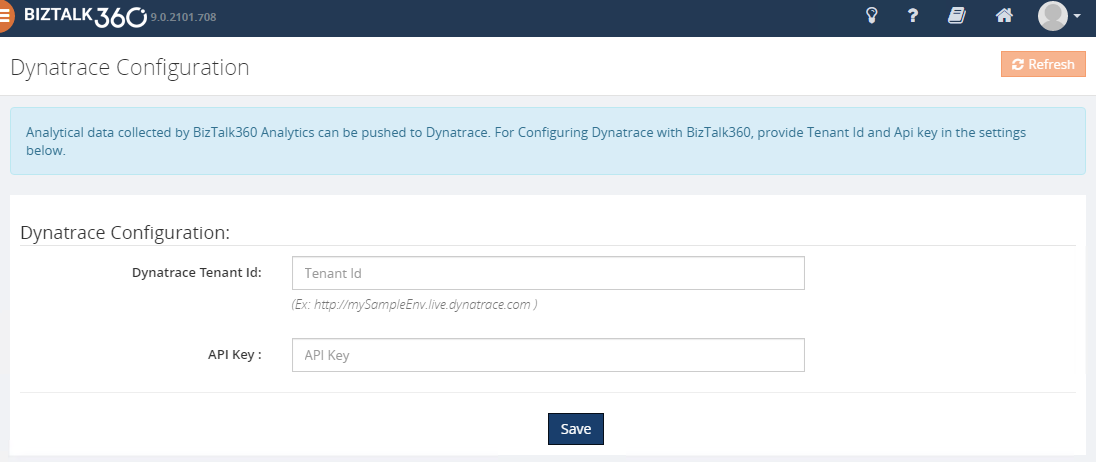
How to Configure Dynatrace in BizTalk360
You can easily configure your Dynatrace environment in BizTalk360, by providing your Dynatrace environment details such as tenant id and API key in the Dynatrace configuration section under (BizTalk360 Setting -> Analytics Configuration).
Ok, let’s see how BizTalk360 pushes the collected performance metrics to Dynatrace.
BizTalk360 Analytics Service holds a sub-service for Dynatrace which creates custom metrics in your Dynatrace environment for all the counters which you have enabled in the BizTalk360 Analytics configuration section. Each minute the sub-service will start pushing the collected BizTalk Server performance data to the respective custom metrics. These custom metrics data can be mapped to a custom chart and viewed in your Dynatrace dashboard.
To push performance data to Dynatrace, BizTalk360 uses the Dynatrace exposed TimeSeries API’s – “Custom Metrics” and “Post data point of a metrics”.
Note: In Dynatrace you have only 100 custom metrics available for free per environment. If you want to view more than 100 performance counters, then you need to purchase the custom metrics for the same from Dynatrace.
However from BizTalk360 V9.2, we provide an option to manage the performance metric data collection in Manage Analytics section (BizTalk360 settings->Manage Analytics ->Choose the Environment->Select the Server->Manage Metrics ), you can choose the required metrics for data collection as below. With this, you can limit the number of counters to be created in Dynatrace.
To be able to use the integration with Dynatrace from BizTalk360, you must have :
- A Dynatrace environment details (tenant id and API key )
- Enough custom metrics in your Dynatrace environment
- BizTalk360 v9.2 or later. Download the latest version of BizTalk360 from – http://www.biztalk360.com/free-trial/
- BizTalk360 Platinum license
- You must be a Super User in your BizTalk360 application to configure the Dynatrace environment in BizTalk360
How to view BizTalk360 Analytics data in Dynatrace
- Log into your Dynatrace Environment
- Create a custom chart widget in the dashboard
- Configure the custom chart by selecting performance categories, say BizTalk Messaging Performance, Failure Rate, Processor, etc. and select the respective custom metrics
You will start seeing the analytical data of the mapped custom metrics in the dashboard.
Below are some of the important performance metrics you can see in your Dynatrace dashboard.
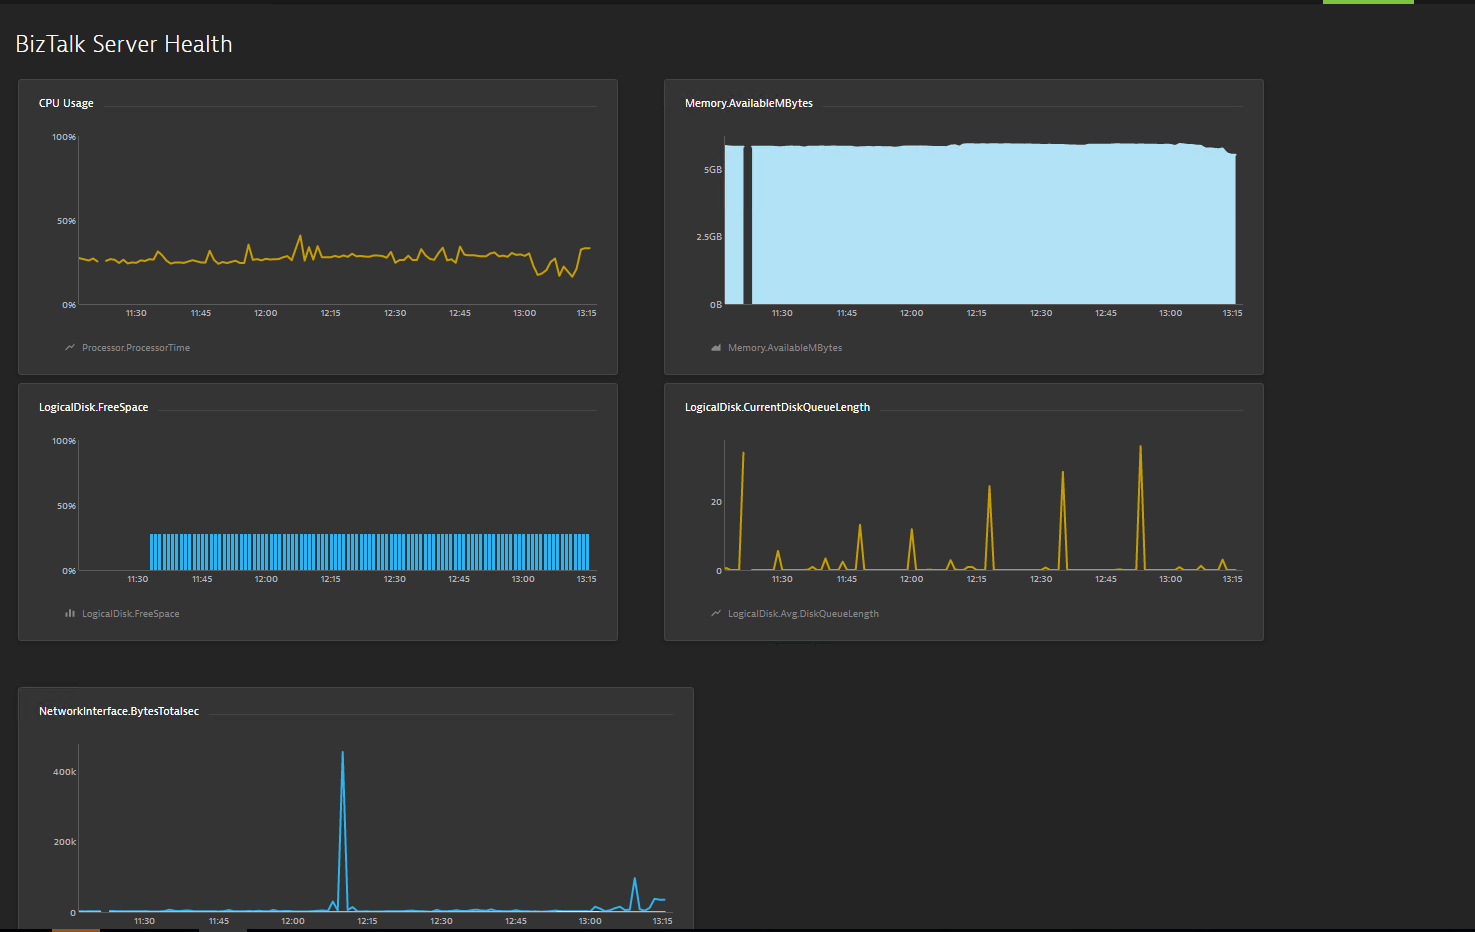
BizTalk and SQL Server Health
- CPU Usage
- Memory Usage
- Disk Free Space
- Average Disk Queue Length
- Network Performance
- IIS Request Per Sec
- IIS Worker Process: CPU Usage
- IIS Worker Process: Memory Usage
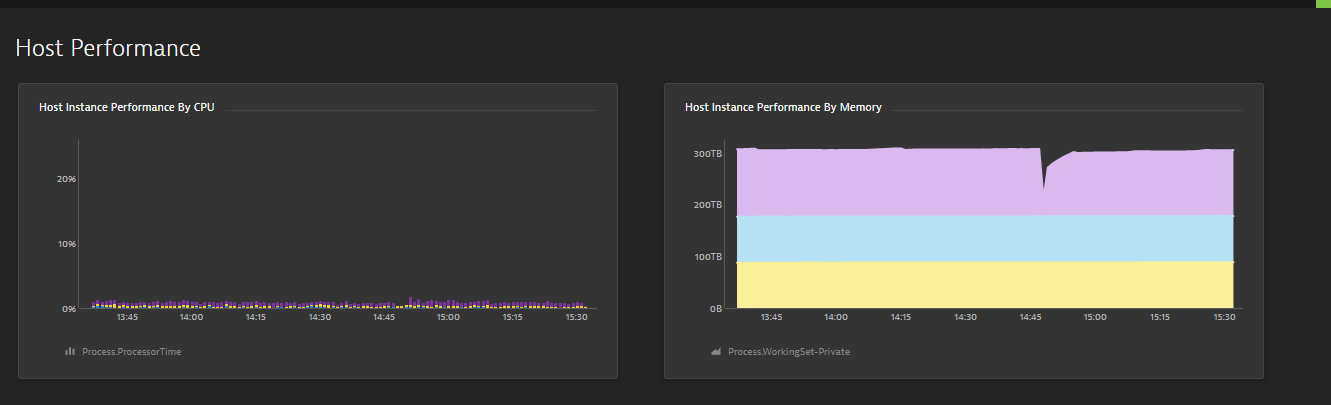
Host Performance
- Host Instance performance by CPU
- Host Instance Performance by Memory
- CPU Consuming Host Instances
- Top 10 Memory Consuming Host Instances
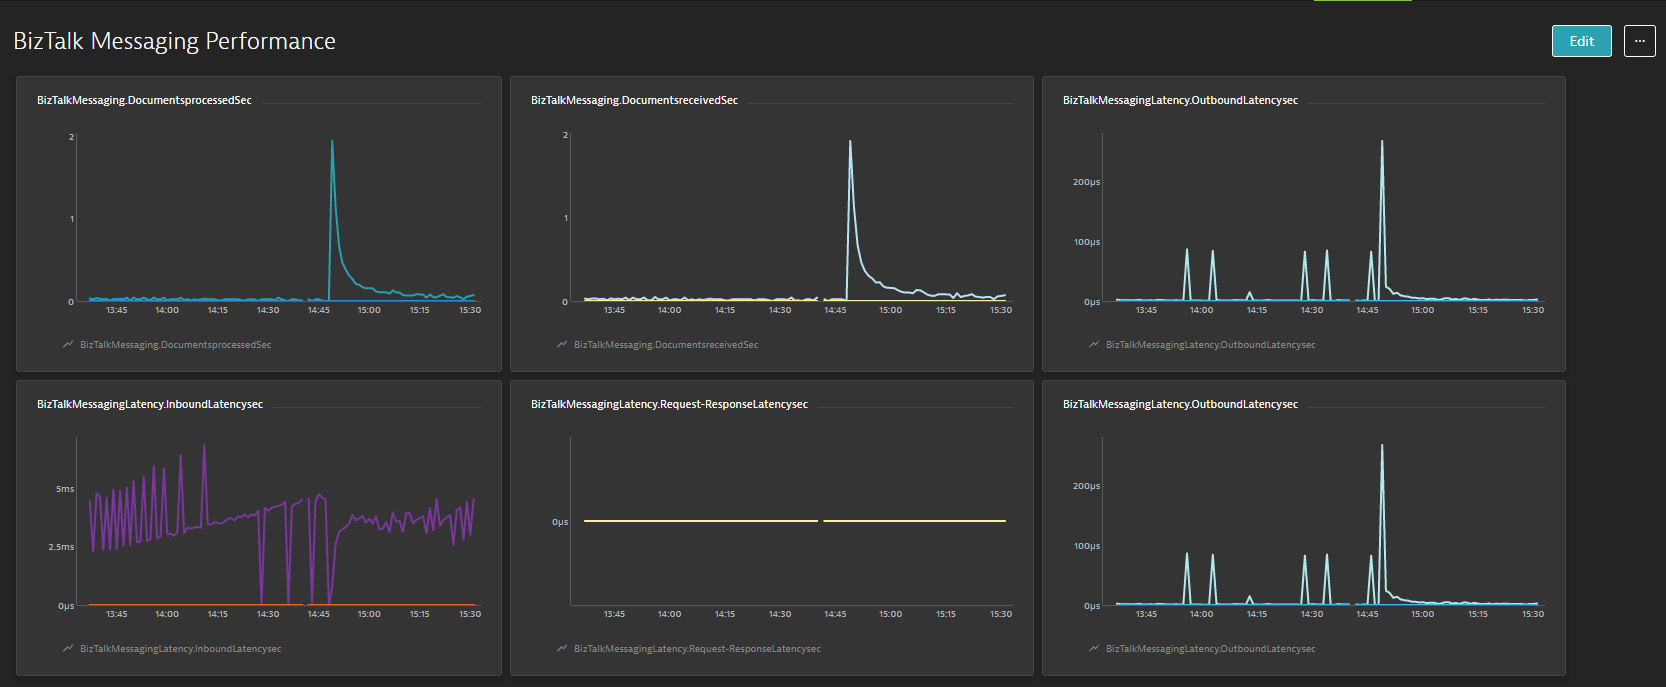
BizTalk Messaging Performance
- BizTalk Host Performance
- Documents Receive/Second
- Documents Processed/Second
- Inbound Latency (Sec)
- Outbound Latency (Sec)
- Outbound Adapter Latency (Sec)
- Request -Response Latency
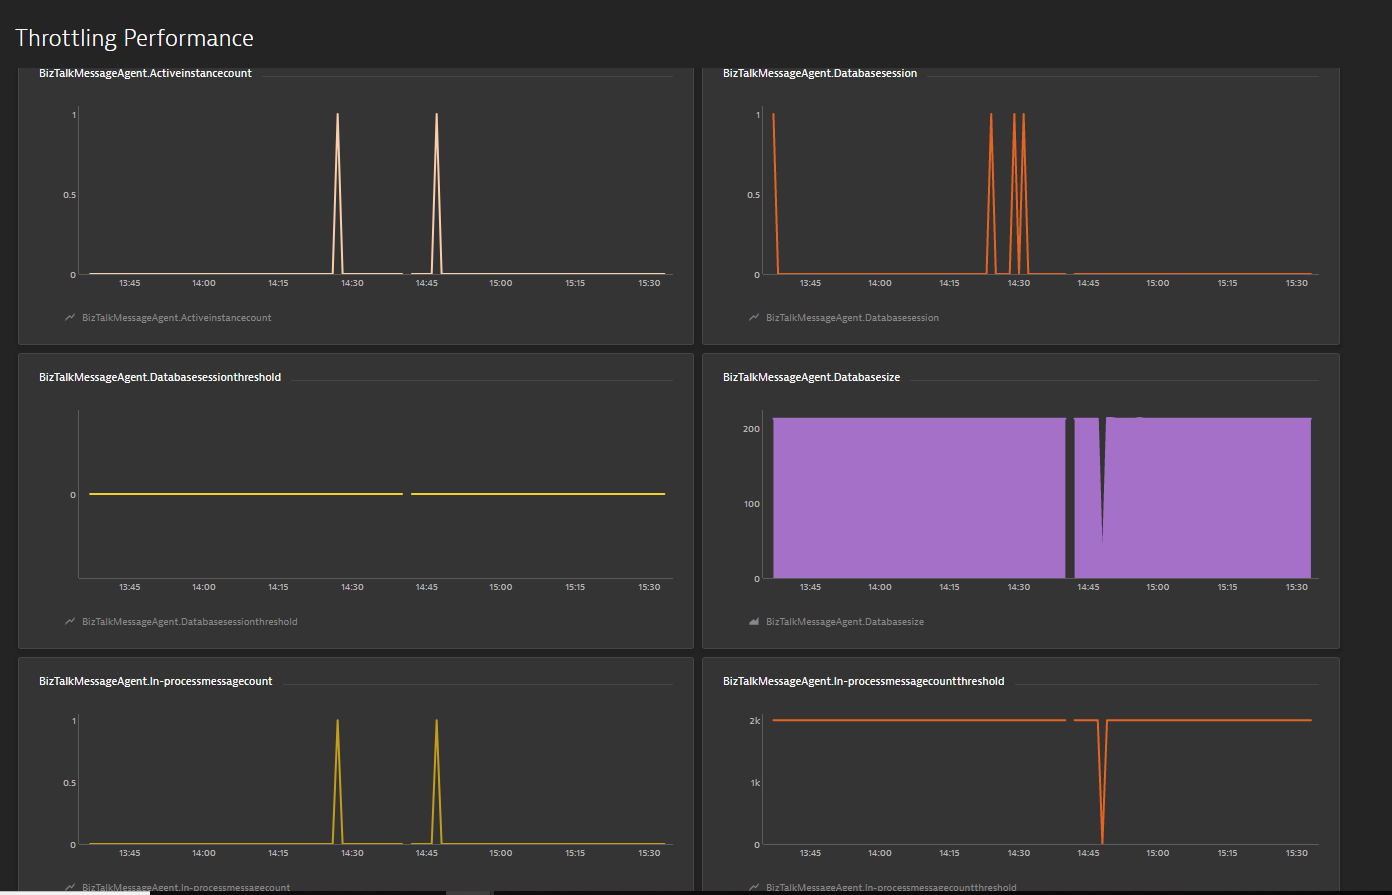
Throttling Performance
- Message delivery Throttling State
- Message Publishing Throttling State
- Message Delivery Outgoing Rate
- Message Delivery Incoming Rate
- Active Instance Count
- Database Size
- Database Session
- Database Session Threshold
- In-Process message Count
- In-Process Message Count threshold
- Message publishing incoming Rate
- Message Publishing Outgoing Rate
Conclusion
Considering the feedback from our customers, BizTalk360 will continue to provide more useful features in every release. Why not give BizTalk360 a try! It takes about 10 minutes to install on your BizTalk environments and you can witness and check the security and productivity of your own BizTalk environments.
The post Integrate BizTalk Performance data with Dynatrace from BizTalk360 appeared first on BizTalk360.
by Praveena Jayanarayanan | Aug 8, 2019 | BizTalk Community Blogs via Syndication
BizTalk360 is one-stop monitoring tool for monitoring your BizTalk environment. The BizTalk360 installation is a very quick process and does not take much time when all the prerequisites are met. For any software product, there would be some basic requirements that should be satisfied for its successful installation. BizTalk360 also has its own hardware and software requirements. In addition to these requirements, there are also some permissions and rules that need to be provided.
We have different documents that contain this information. But I thought it would be even more helpful for our customers if we have all this information in a single place. In this blog article, I would like to give a consolidation of all the requirements that one should make sure of before installing BizTalk360.
There are many considerations that need to be taken care of before installing BizTalk360, like where do you want to install BizTalk360, the service account permissions, the database creation, etc. Let’s look at each of them.
Installing guide for BizTalk360
BizTalk360, being a separate integration tool, always arises a query from the customers as to where we must install it. What is the best practice to install BizTalk360? It can be either installed on the same server where BizTalk is installed or in a standalone server.
The recommendation would be to install BizTalk360 on a separate server, rather than in the BizTalk server.
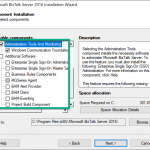
This will be useful in the performance perspective. The BizTalk server performance would not be hindered and BizTalk360 will notify the users when the BizTalk server is down. The important prerequisite for installing in a standalone server is that the BizTalk Admin Components must be installed beforehand in the standalone server.
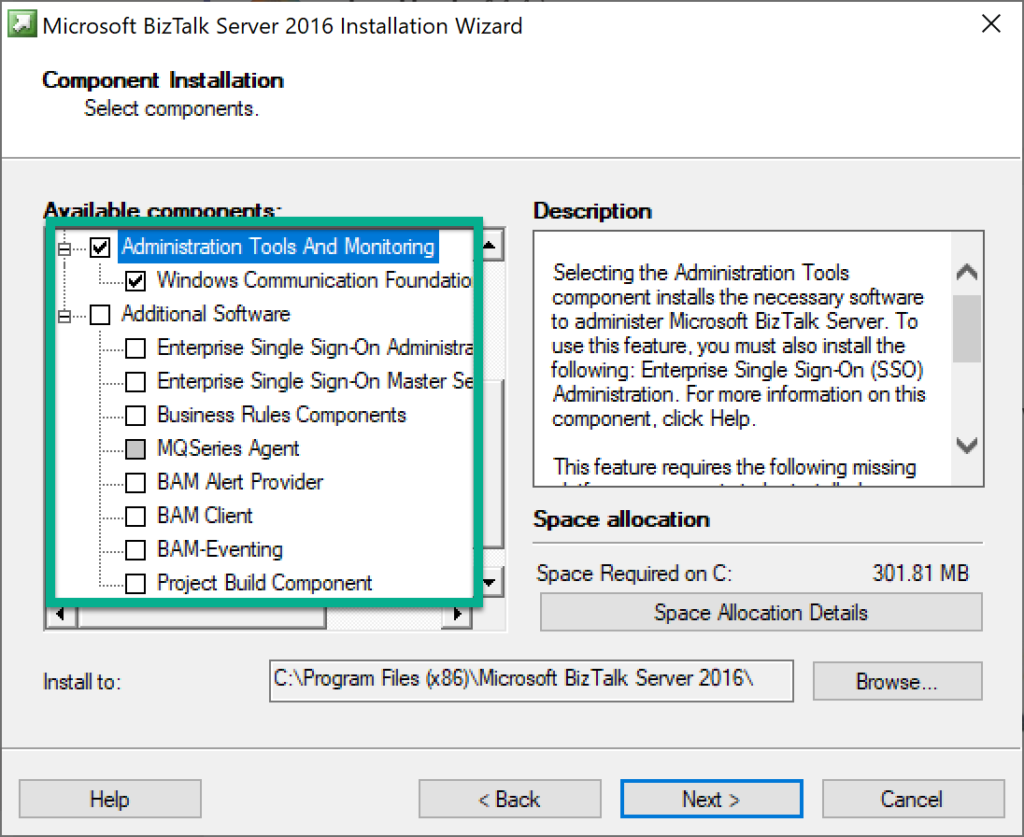
If these components are not installed, then the BizTalk360 installer will fail with the following error.
The role of the service account in BizTalk360
One of the most important prerequisites for BizTalk360 is to configure a separate service account. The service account will be one that is used for the IIS App pool that will be created during the installation and also for running the BizTalk360 Monitor and Analytics service.
The recommendation is to create a dedicated service account, the reason being there are some permissions that need to be provided for this account.
The permissions would be:
- Local administrator permission in the BizTalk360 server for starting the Monitor and Analytics service
- Local administrator in the BizTalk and SQL server(s) for collecting the event log data and for disk and system resource monitoring
- Sysadmin permission to the SQL Server for creating and updating the BizTalk360 database
- Sysadmin permission for the BizTalk databases for monitoring and autocorrecting the SQL jobs. In case if you do not prefer to provide Sysadmin permission, you can provide SQLAgentOperator role for the service account for monitoring the SQL jobs and performing the autocorrect functionality
- Member of all the BizTalk groups
Once you have created the service account, you will have to log in to the BizTalk360 server with this service account to install BizTalk360. Logging in with other users may result in other permissions related to the database as other users may not have the expected permissions as the service account.
Firewall ports and protocols to be checked
When you plan to install BizTalk360 in a separate standalone server, there are some configurations that need to be taken care in the security perspective. For example, there may be firewall rules that may restrict access to the server. For BizTalk 360 to be able to contact BizTalk Server, the MSDTC connection needs to be enabled in all the servers. BizTalk360 should be enabled with certain ports/protocols for communicating with the external servers.
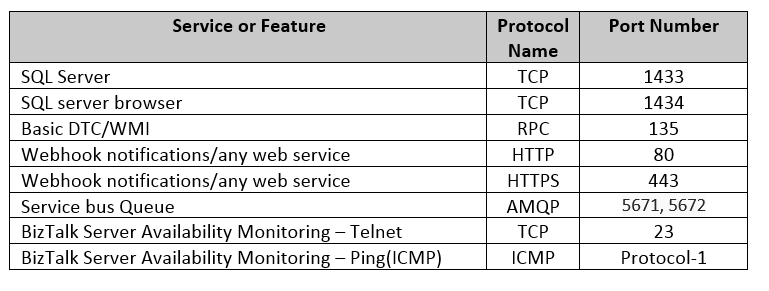
Next, make sure the below services are running in the server:

Also, make sure if custom ports are utilized for any service, unblock them as well from the firewall for the seamless working.
Ready to install BizTalk360
Once all the prerequisites are in place, you are now ready to install BizTalk360. The installation is a seamless process which would roughly take about 10-15 minutes when all permissions are in place.
You will have to make sure that you have logged into the server with the BizTalk360 service account. The reason for this is that when BizTalk360 is installed, the logged-in user will be created as a Super User in BizTalk360.
This Super User permission is required for the service account to perform certain automated processes like terminating/resuming service instances through Data Monitoring alarms and also for Analytics operations.
If for some reason, the installation fails, the first thing to be looked for the error, would be the installation logs.
Important configurations for BizTalk360
For BizTalk360 to be up and running, there are some configurations that need to be done. For example, the SMTP setting would be required for triggering the alert emails. You will need to create different users for accessing BizTalk360.
You can refer to the implementation of best practices here.
Best practices on a performance perspective
For any software product, the performance would be the foremost priority. Some of the performance measures that can be taken up for enhancing BizTalk360 would be:
- Configuring only the required sources in the Advanced Event Viewer so that the database growth is controlled
- Maintaining the appropriate purge duration to remove the historical data based on the business needs
- Enabling only the relevant performance counters for Analytics performance data collection
Upgrade and Migration Scenarios
- What happens when you upgrade BizTalk360 to a new version?
- What happens when you migrate your BizTalk server?
- Let’s have a look!
Upgrading BizTalk360
A new version of BizTalk360 is released every quarter with new features and enhancements picked up based on customer feedback. The release would also include certain bug fixes as well.
It is important that customers upgrade their BizTalk360 to the latest version to be in line with the release and enjoy the new features.
Things to be taken care while upgrading BizTalk360:
- You should log in with the BizTalk360 service account to the BizTalk360 server
- The license needs to be deactivated
- The database should be backed up so that in case of any errors, the old database can be restored
- Once after the successful upgrade, it is important to clear the browser cache and then launch BizTalk360
In a scenario where there might be some problems during the upgrade, the customer could have uninstalled and reinstalled BizTalk360. In this case, they would have restored the old database and the following error would occur.
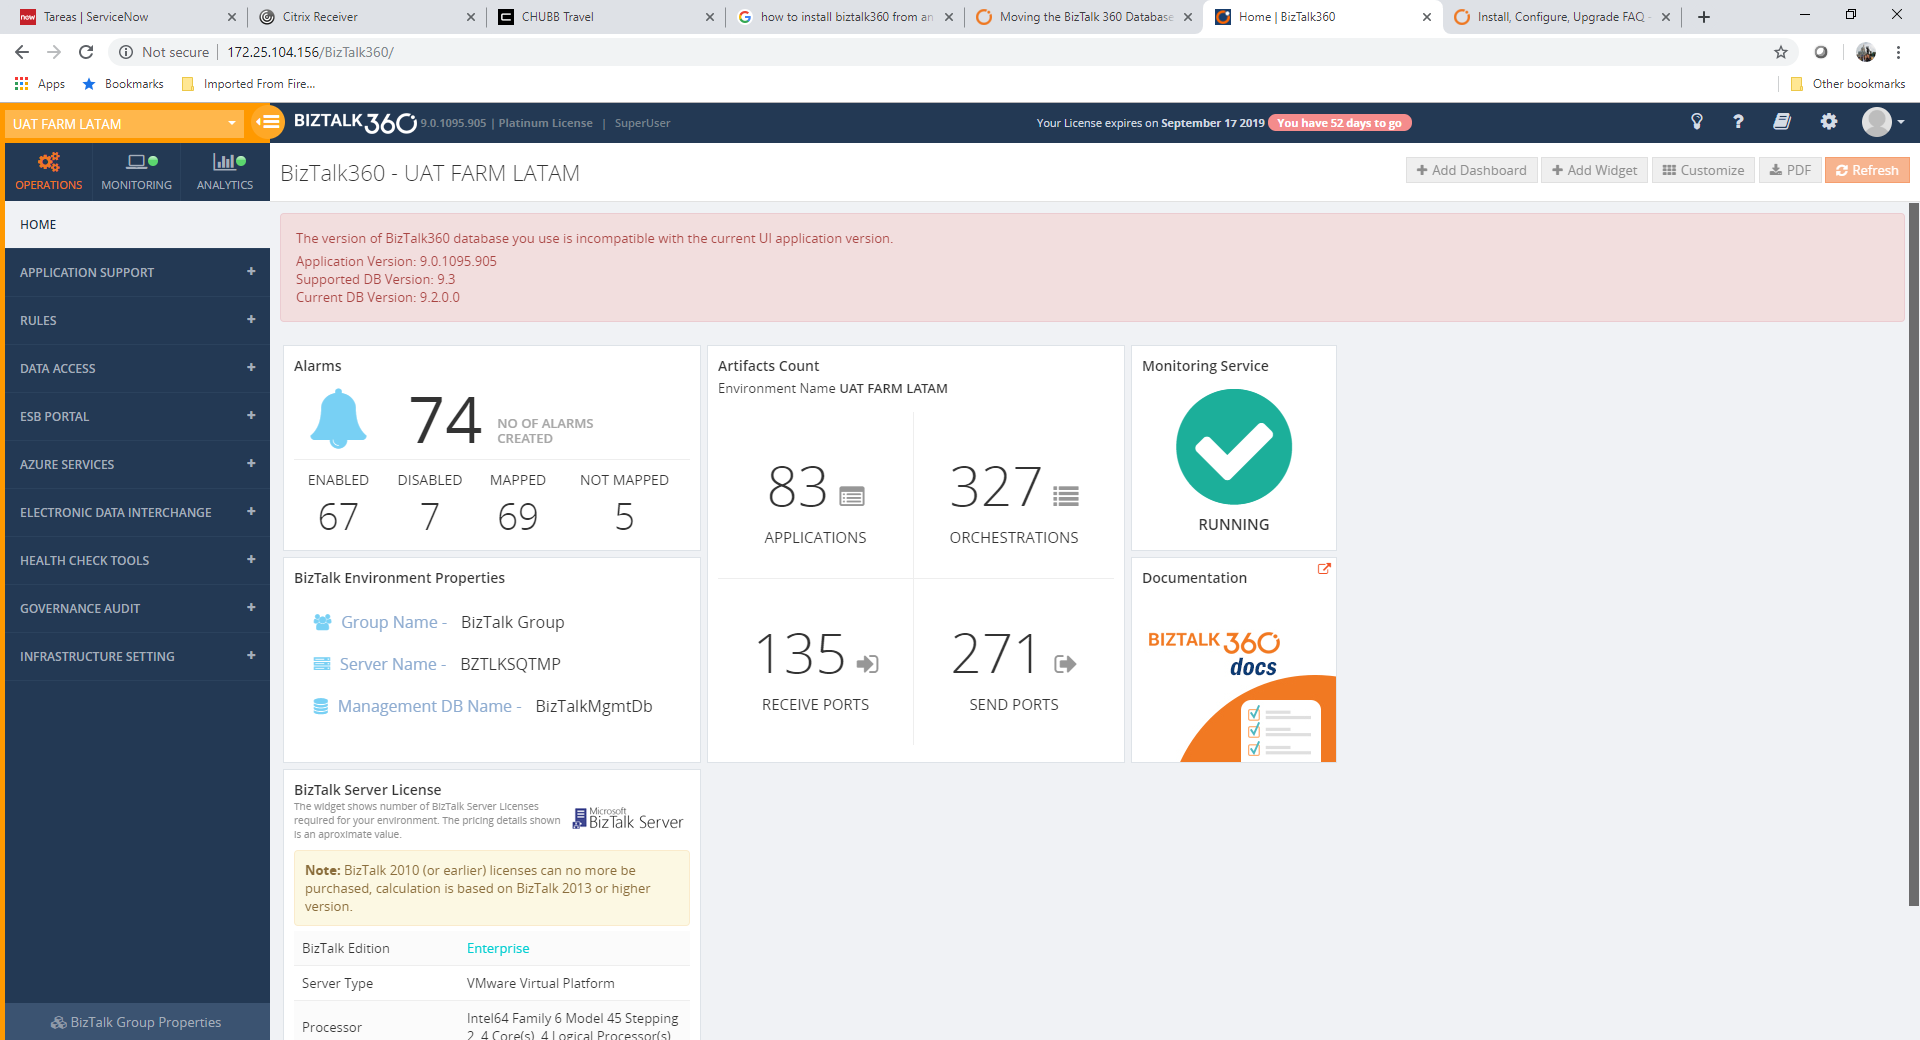
Here, we can see that the application has been upgraded but not the database since the old version of the database has been restored. The suggestion here would be to run the SQL scripts from the next version seen in the error from C:Program Files (x86)Kovai LtdBizTalk360ServiceSQL folder. Please note, if there is more than one script that needs to be executed, then they should be run in the same sequence.
Upgrading BizTalk Server
Customers might migrate from a lower version of BizTalk Server to a higher version, say for example from BizTalk Server 2013 to BizTalk Server 2016. There are some configuration changes that need to be done at the BizTalk360 side as well to point to the new BizTalk environment. The below steps need to be followed in the BizTalk360 box when you migrate the BizTalk server.
- Deactivate the license in BizTalk360 first before migration
- Install the new version of BizTalk admin components in BizTalk360 server
- After migration, update the environment details to point to the SQL instance which contains the BizTalk databases
- The below tables need to have the BizTalk version changed appropriately and the MS_BizTalk_install_location should be updated
b360_admin_BizTalkEnvironment -> BizTalk Version
b360_admin_GlobalProperties -> MS_BIZTALK_VERSION & MS_BIZTALK_INSTALL_LOCATION
You can export the alarms from the old BizTalk360 environment and import them to the new environment. The mappings will also get imported to the new environment. If you are using BizTalk360 v8.8 or later, then you can export the user settings as well.
- Modify the alarm mapping to point to the artifacts in the new environment
Migrating BizTalk360 database and application
When the BizTalk360 database is moved to a new server, the connection string needs to be modified in the following config files:
- Web.config
- BizTalk360.Monitor.exe.config
- BizTalk360.Analytics.exe.config
For more details, refer to the article.
BizTalk360 additional details
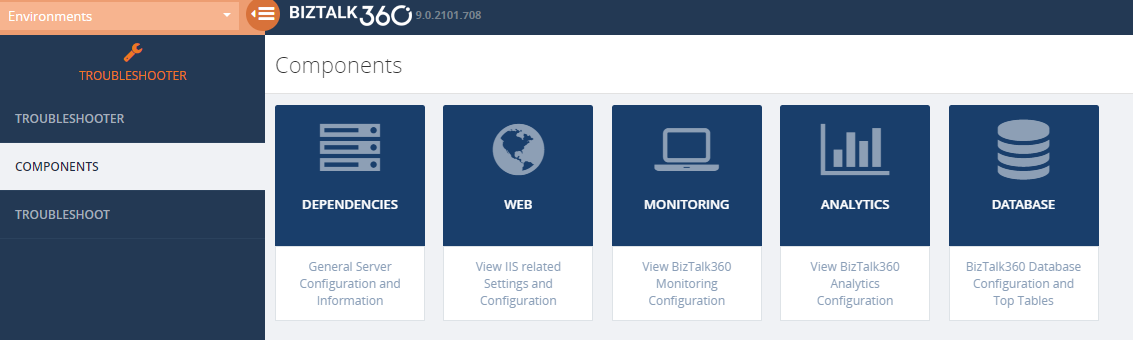
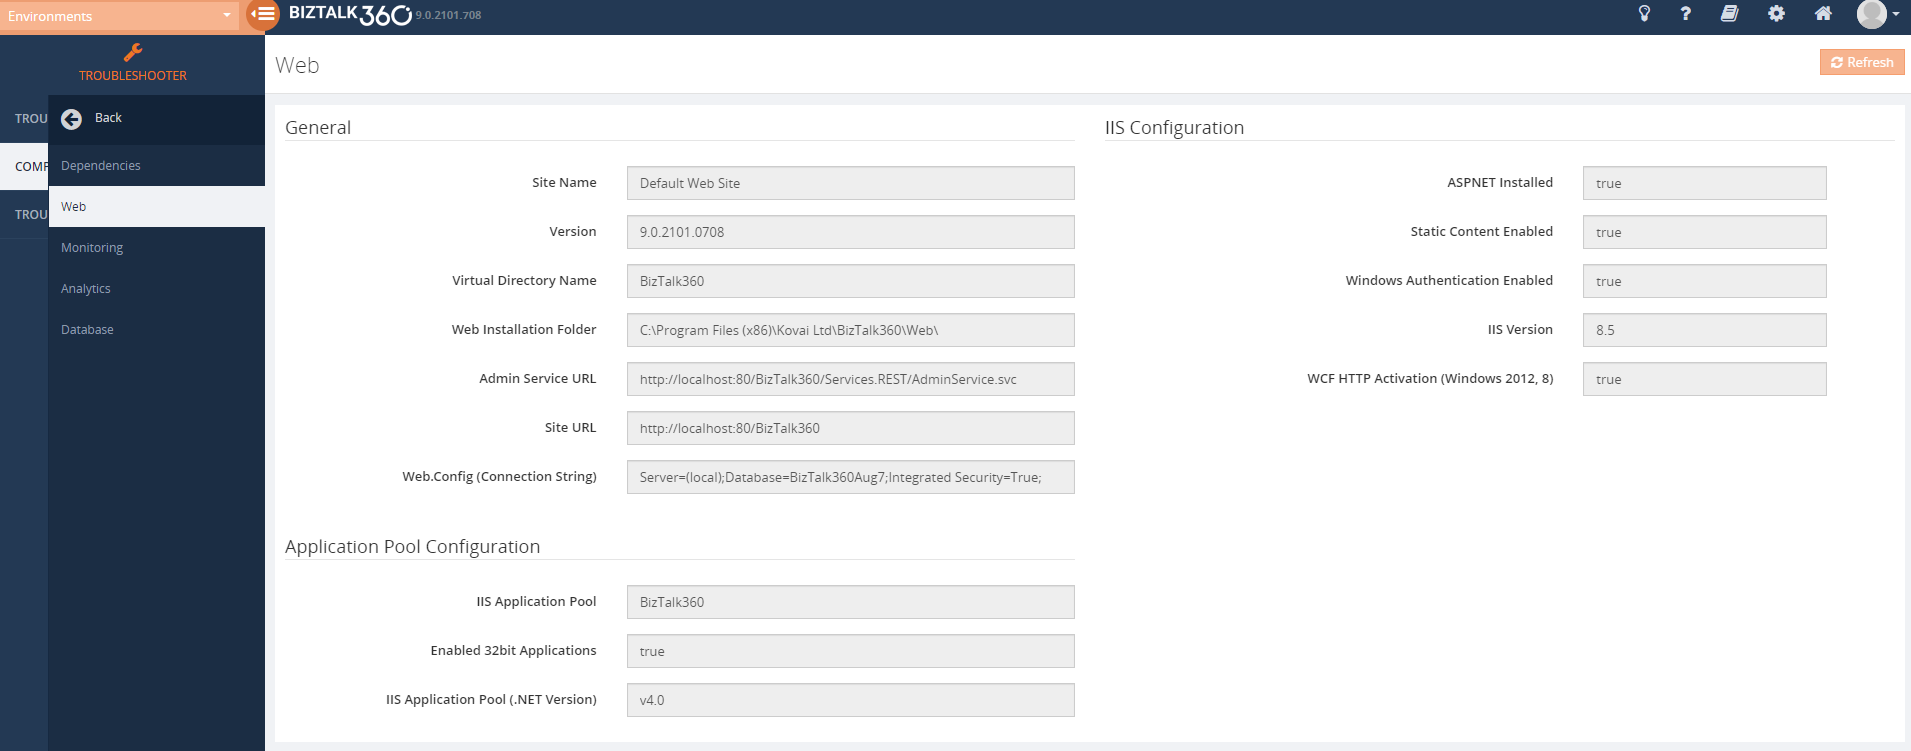
The integrated Troubleshooter in the BizTalk360 UI will provide you with the complete details of BizTalk360 like the connection string, installation location, and the database.
Conclusion
Once all the setup and configurations are in place, it is a quick and seamless task to install/upgrade BizTalk360. The customer suggestion and feedback are always heard and addressed, which helps us to improve the product and provide better service.
Happy monitoring with BizTalk360! 
The post BizTalk360 – Ready to function appeared first on BizTalk360.
by Sandro Pereira | Jul 18, 2019 | BizTalk Community Blogs via Syndication
Due to personal requests from some members of the community, I decided to release another minor version of my stencils pack that will include the following features:
- New shapes: new shapes were added to existing modules like:
- Logic App Inline Code (square – original that you can find in Logic App design)
- Logic App Inline Code JS (square – original that you can find in Logic App design)
- Logic App Inline Code (Custom shape version 1)
- Logic App Inline Code (Custom shape version 2)
- Secure Message Input
- Secure Message Output

Microsoft Integration, Azure, Power Platform, Office 365 and much more Stencils Pack it’s a Visio package that contains fully resizable Visio shapes (symbols/icons) that will help you to visually represent On-premise, Cloud or Hybrid Integration and Enterprise architectures scenarios (BizTalk Server, API Management, Logic Apps, Service Bus, Event Hub…), solutions diagrams and features or systems that use Microsoft Azure and related cloud and on-premises technologies in Visio 2016/2013:
- BizTalk Server
- Microsoft Azure
- Integration
- Integration Service Environments (ISE)
- Azure App Service (API Apps, Web Apps, Mobile Apps, and Logic Apps)
- Event Hubs, Event Grid, Service Bus, …
- API Management
- IoT, and Docker
- Machine Learning, Stream Analytics, Data Factory, Data Pipelines
- and so on
- Microsoft Power Platform
- Microsoft Flow
- PowerApps
- Power BI
- PowerShell
- Infrastructure, IaaS
- Office 365
- And many more…
- … and now non-related Microsoft technologies like:
You can download Microsoft Integration, Azure, BAPI, Office 365 and much more Stencils Pack for Visio from:
Microsoft Integration, Azure, Power Platform, Office 365 and much more Stencils Pack for Visio
GitHub
Or from:
Microsoft Integration and Azure Stencils Pack for Visio 2016/2013 v4.0.2 (22,6 MB)
Microsoft | TechNet Gallery
The post New Logic App Inline Code icons are now included in Microsoft Integration (Azure and much more) Stencils Pack v4.0.2 for Visio appeared first on SANDRO PEREIRA BIZTALK BLOG.
by Sowmiya Subramanian | Jul 11, 2019 | BizTalk Community Blogs via Syndication
Monitor Host Instances in Clustered/High availability environment
A BizTalk Server Host is a logical container that contains the BizTalk Server runtime processes in which you deploy items such as adapter handlers, receive locations (including pipelines), and orchestrations. The host instance is the runtime process where the message processing, receiving, and transmitting occurs. Obviously, it is very important to ensure your host instances are running in your BizTalk environment. BizTalk360 already made it easy for its customers by introducing the Host Instance Monitoring functionality. In BizTalk360, you can monitor the BizTalk host instances by setting the Expected State. If the expected state doesn’t match with the current state of the host instance, you will get notified.
Out of the box, BizTalk360 allows users to monitor the Clustered Host Instances using the “AtLeastOneActive” state.
If this state is assigned as the Expected State, then the monitoring service will verify that across all the instances for the respective clustered host, at least one host instance is active, guaranteeing that the server is running, and no downtime happened for that host/server. To know more about Clustered Host Instance monitoring, follow this blog link.
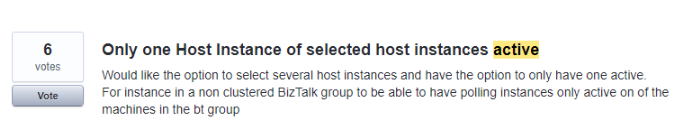
In the upcoming BizTalk360 version 9.0 Phase 2, we have extended this core functionality to monitor the host instances for high availability environment, as per the customer feedback and voting as below.
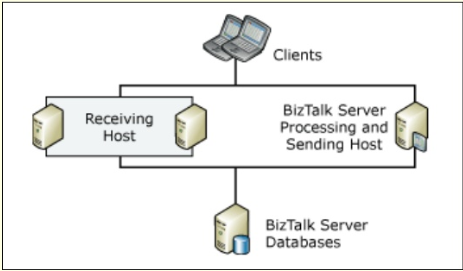
BizTalk Server High availability
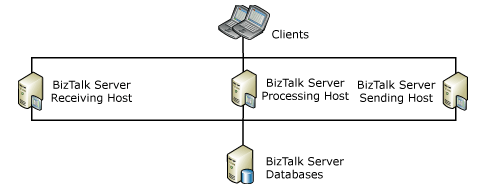
The following figure shows a BizTalk Server deployment that provides high availability for the receiving host by having two host instances on different computers. Note, that in this figure the processing and sending host is not highly available, because there is only one host instance processing the BizTalk items assigned to the host.
How BizTalk360 helps to monitor the Host Instances in clustered/High availability Environments?
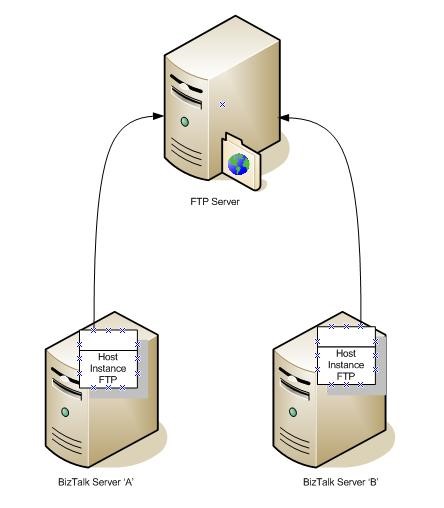
In a business scenario, if you have two BizTalk servers and they both have a Host Instance on them called “FTP”, both Host Instances will trigger a connection to this FTP server. If a file exists on the FTP server that matches your Receive Location’s file mask, both of these host instances will attempt to retrieve a copy of this file, as shown below.
To avoid processing duplicate messages from the high availability, organizations may use the Windows Clustering. This will guarantee that only one host instance is running at a time.
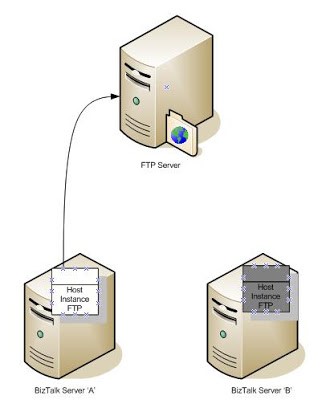
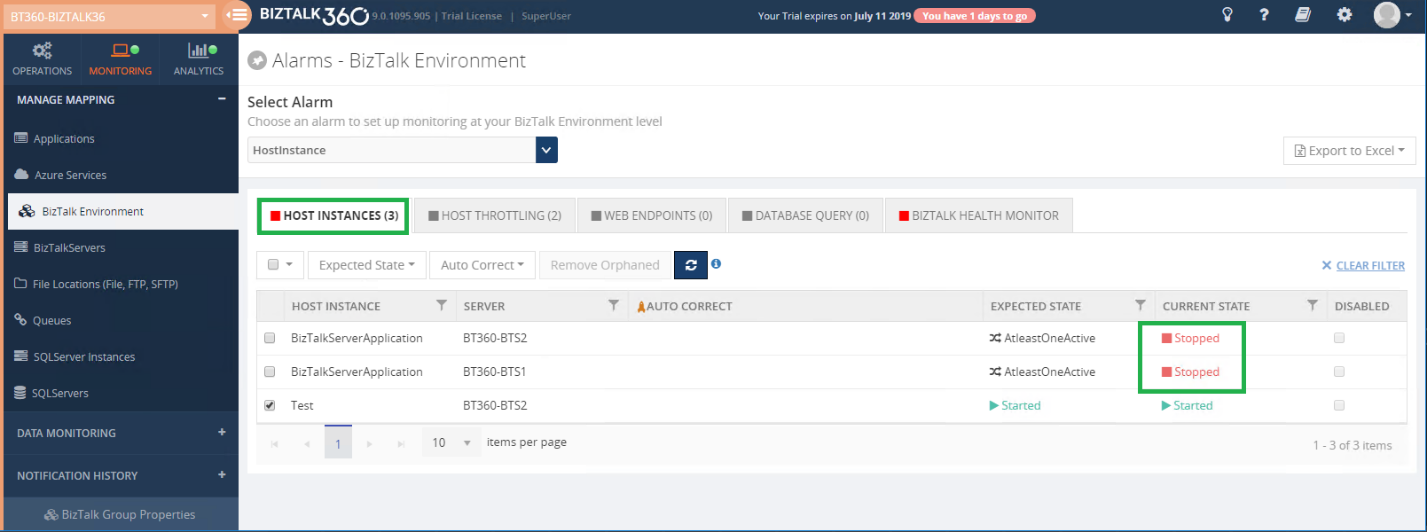
In the above cases, any one of the BizTalk servers needs to be in the active state to receive the file, if both the server is down, then the file will not get received. With BizTalk360, a user can monitor both the host instances in different servers, by setting up the “AtleastOneActive” State as shown below.

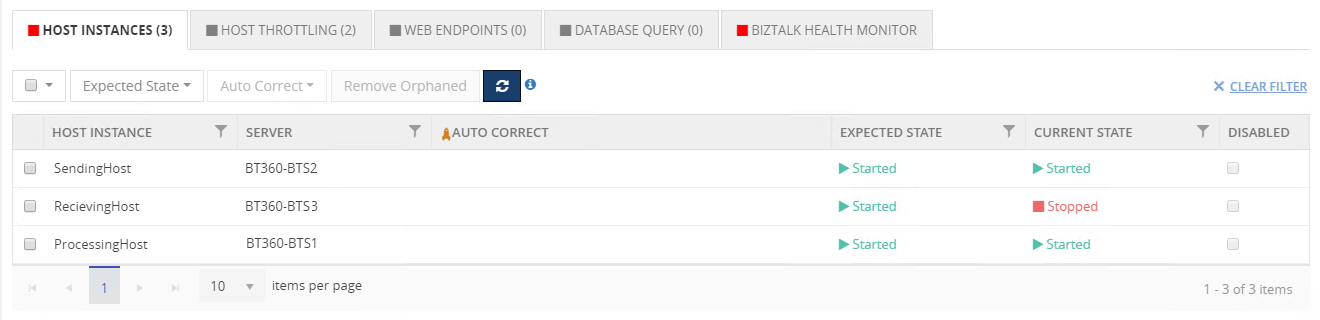
In High Availability environments, users can have all the host instances to be Active. For example, if you have 3 BizTalk Host Instances, in multiple BizTalk servers, used for different purposes like receiving, processing and sending the files.
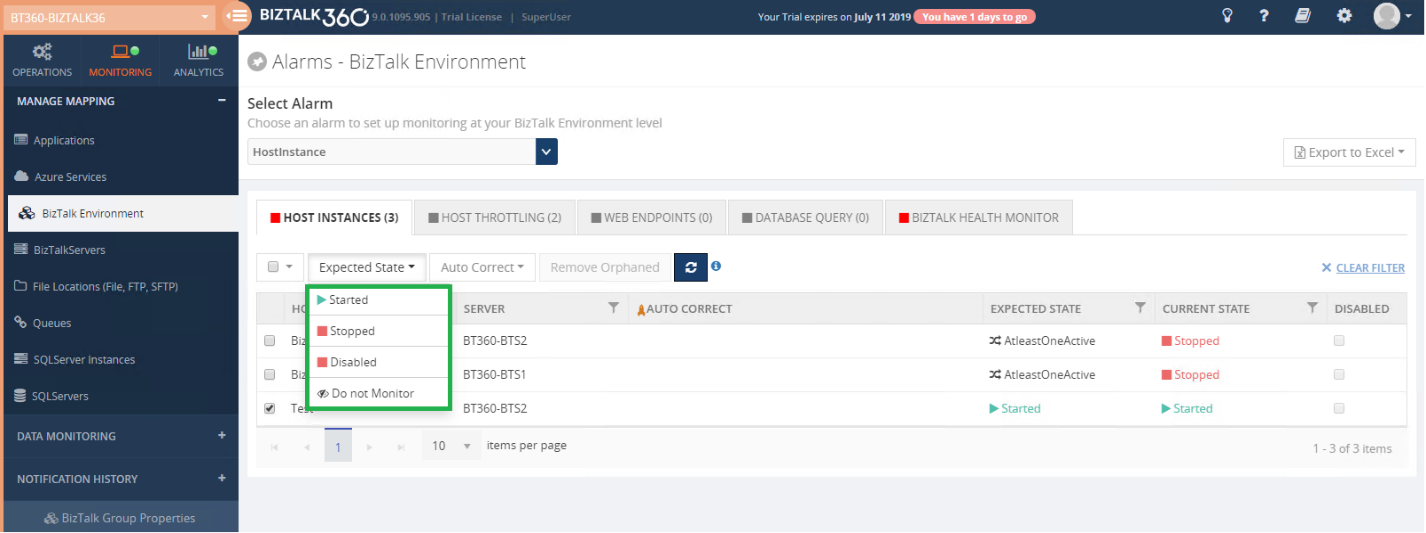
You can set up monitoring for the above scenario in BizTalk360, by setting the expected state to Started for all the three Host Instances as you can see below. When any of the host instances goes down, you will be notified.
Setting up the “AtleastOneActive” state for Host Instances
The “AtleastOneActive” state is mainly used to monitor the Active/Passive clustered and Non-clustered host instance monitoring. The user can set the “AtleastOneActive” state only for clustered host instances and non-clustered host instances in high availability environment.
Setting the “AtleastOneActive” state will monitor across all the configured host instances of the same host and check if any one of the host instances is active. If so, the monitoring state will be healthy.
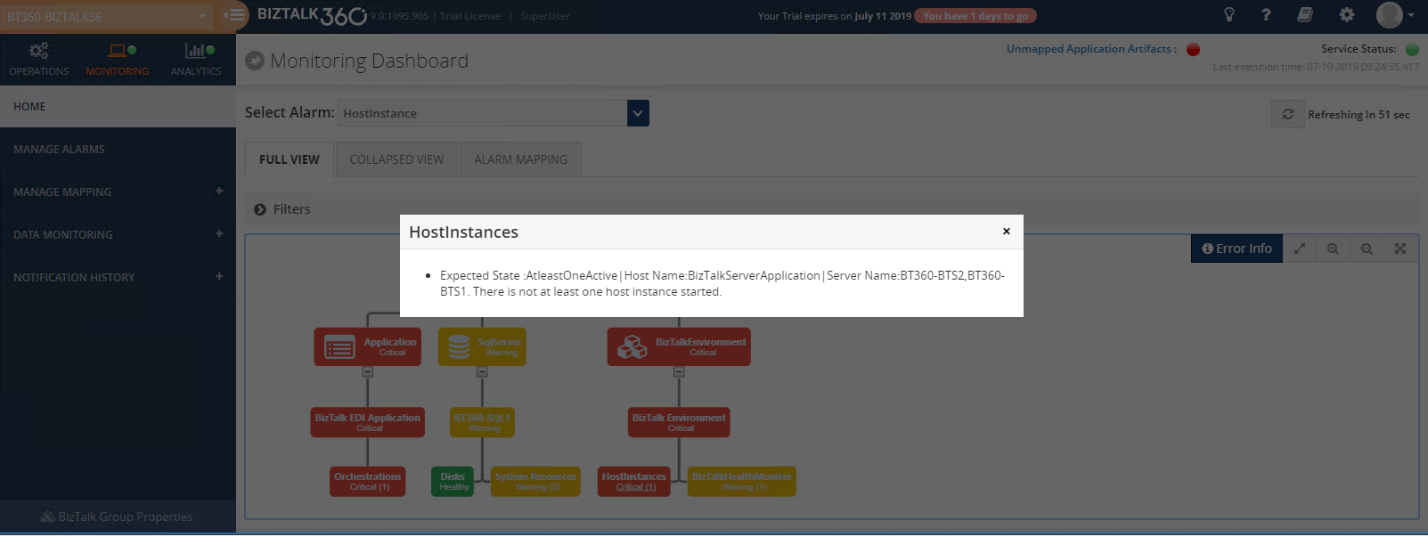
If all the configured host instances are down or stopped state, then the host instance monitoring will turn to Critical state.
The monitoring status of the host instances will get reflected in the BizTalk360 Monitoring dashboard and the same will be notified in detail in the alert email.
How does AutoCorrect functionality work for the AtleastOneActive state of the host Instance monitoring?
Do you feel frustrated to manually start host instances, when all the host instances become down in clustered/High availability environment?.
BizTalk360 comes up with another solution with its Auto Healing capability.
For Example, if you have 2 BizTalk host instances running under Clustered/high availability setup, from 2 host instances any one instance needs to be in the active state for performing file transactions. If both the host instances are down, then you need to start the host instances manually. This requires continuous monitoring, which can be handled by BizTalk360 itself, by configuring the AutoCorrect functionality to the clustered or non-clustered host instances.
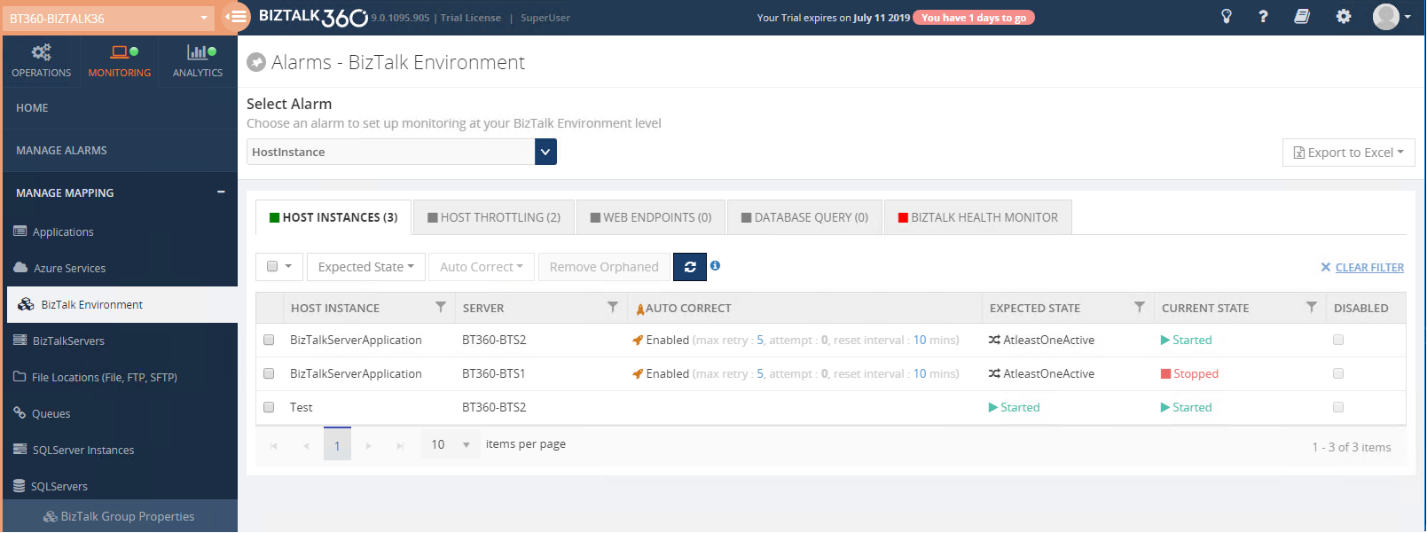
In the above screenshot, the auto-correct functionality is enabled for 2 host instances in different BizTalk servers BTS1 and BTS2. If both the host instances are down, from next monitoring cycle BizTalk360 will try to auto-heal any one of the host instances from these servers. On the first attempt, it will try to start the host instance in BTS1 server. If the instance is started successfully then it skips auto-healing the next server BTS2. In case BizTalk360 fails to start the instance in BTS1, then it tries to start the host instance on the server BTS2. BizTalk360 will try to start any one of the host instances until it reaches the maximum attempt count. You can also reset the auto-correct by setting the reset interval. To know more about the auto-correct feature click here.
Conclusion
Monitoring the Host Instances in Clustered and High availability environment is a must for a healthy BizTalk environment. BizTalk360 monitors those host instances in an easy and simple manner. It also manages the host instances and ensures they are up and running, by using the auto-correct functionality. The upcoming version of BizTalk360 will ease your way of monitoring the host instances in clustered and high availability setup.
The post Monitor the Host Instances in Clustered/High availability environment appeared first on BizTalk360.

by Sandro Pereira | Jul 5, 2019 | BizTalk Community Blogs via Syndication
On 1st January 2011, I was awarded for the first time Microsoft Most Value Professional (MVP), back them as a BizTalk Server MVP, joining an amazing worldwide group of technicians and community leaders who actively share their high quality and real-world expertise with other users and Microsoft. And since then I was re-award in:
- 2012, again as BizTalk Server MVP;
- From 2013 to 2015, I was rebranded as Microsoft Integration MVP;
- In 2017, Integration become part of Azure category, so I was awarded for the first time as Azure MVP
- And in the middle of 2017, I was Award in two categories, Azure and Visio MVP;
- In 2018, I was rewarded Azure MVP
And today, still with all the same pride, honor and enthusiasm than the first time, I’m delighted to share with you that in July 1st I was renewed as a Microsoft Azure MVP (Microsoft Most Valuable Professional) for one more year.

It is with great pride we announce that Sandro Pereira has been awarded as a Microsoft® Most Valuable Professional (MVP) for 7/1/2019 – 7/1/2020. The Microsoft MVP Award is an annual award that recognizes exceptional technology community leaders worldwide who actively share their high quality, real world expertise with users and Microsoft. All of us at Microsoft recognize and appreciate Sandro’s extraordinary contributions and want to take this opportunity to share our appreciation with you.
With just over 3,000 awardees worldwide, Microsoft MVPs represent a highly select group of experts. MVPs share a deep commitment to community and a willingness to help others. They represent the diversity of today’s technical communities. MVPs are present in over 90 countries, in more than 40 languages, and across numerous Microsoft technologies. MVPs share a passion for technology, a willingness to help others, and a commitment to community. These are the qualities that make MVPs exceptional community leaders. MVPs’ efforts enhance people’s lives and contribute to our industry’s success in many ways. By sharing their knowledge and experiences, and providing objective feedback, they help people solve problems and discover new capabilities every day. MVPs are technology’s best and brightest, and we are honored to welcome Sandro as one of them.
This is my 9th straight year on the MVP Program, an amazing journey, and experience that, again, started in 2011, and that gave me the opportunity, and still does, to travel the world for speaking engagement, share the knowledge, and to meet the most amazing and skilled people in our industry.
As usual, I would like to thank all of you! And special to my wife Fernanda and my three kids: Leonor, Laura, and José. And to all members of my beautiful family. THANKS for all the support during these last years! You guys are my inspiration!
And a special thanks to my MVP Lead Cristina Herrero for all the support, to Microsoft Integration Team and Azure Teams, to all my fellow Microsoft Azure (Integration) MVP’s and to DevScope (my company) and all my coworkers (no names here because all of them are amazing professionals)
It’s a big honor to be in the program and I’m looking forward to another great year!
The post Thanks! Awarded as Microsoft Azure MVP 2019-2020 appeared first on SANDRO PEREIRA BIZTALK BLOG.
by Raja Sreenivasan | Jul 4, 2019 | BizTalk Community Blogs via Syndication
Introduction
BizTalk users who use BizTalk360 can manage their BizTalk environment in a more efficient way. Monitoring and Notification is amongst the most important features in BizTalk360, The first and foremost step for monitoring is mapping the artifacts to an alarm. In which user can use this on a daily basis to monitor their BizTalk environment and get notified if any violation occurs.
The Monitoring Dashboard is the one stop point for users to view the status of the artifacts which are mapped to an alarm. Typically a customer displays the monitoring dashboard in big screens and looks for the health of their BizTalk environment visually. The monitoring dashboard is structured at alarm level, which lists the status of all the artifacts mapped to the respective alarm. However, you cannot see all the alarms and their mapped artifacts status in a single view, which was a usability problem persist from our side. To overcome these we are implementing the “BizTalk Group Dashboard” for the v9.0 (phase 2). With this dashboard you can view the status of all the artifacts mapped to any number of alarm in a single view and you can easily customize it using the rich filter option provided
Let’s deep dive into BizTalk Group Dashboard and see how it solves the problem.
BizTalk Group Dashboard
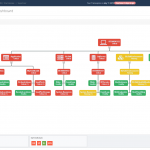
The BizTalk Group Dashboard is designed to monitor all the artifacts (and view all errors) which are mapped to all the configured alarms in BizTalk360, in a single view. The BizTalk Group Dashboard can be found under the Home of Monitoring section. The “BizTalk Group Dashboard” will automatically pick up all the artifacts (which are mapped to any of the BizTalk360 alarms) and displays the status of the artifacts in a graphical manner . Also the error details of the displayed artifacts are shown in a grid view . The BizTalk Group dashboard checks the status of the artifacts in every 60 seconds .
For better usability, BizTalk Group Dashboard splits the windows in two sections:
- Displays the mapped artifacts in a graph
- Show the Error/Warning details in an artifact level segregation
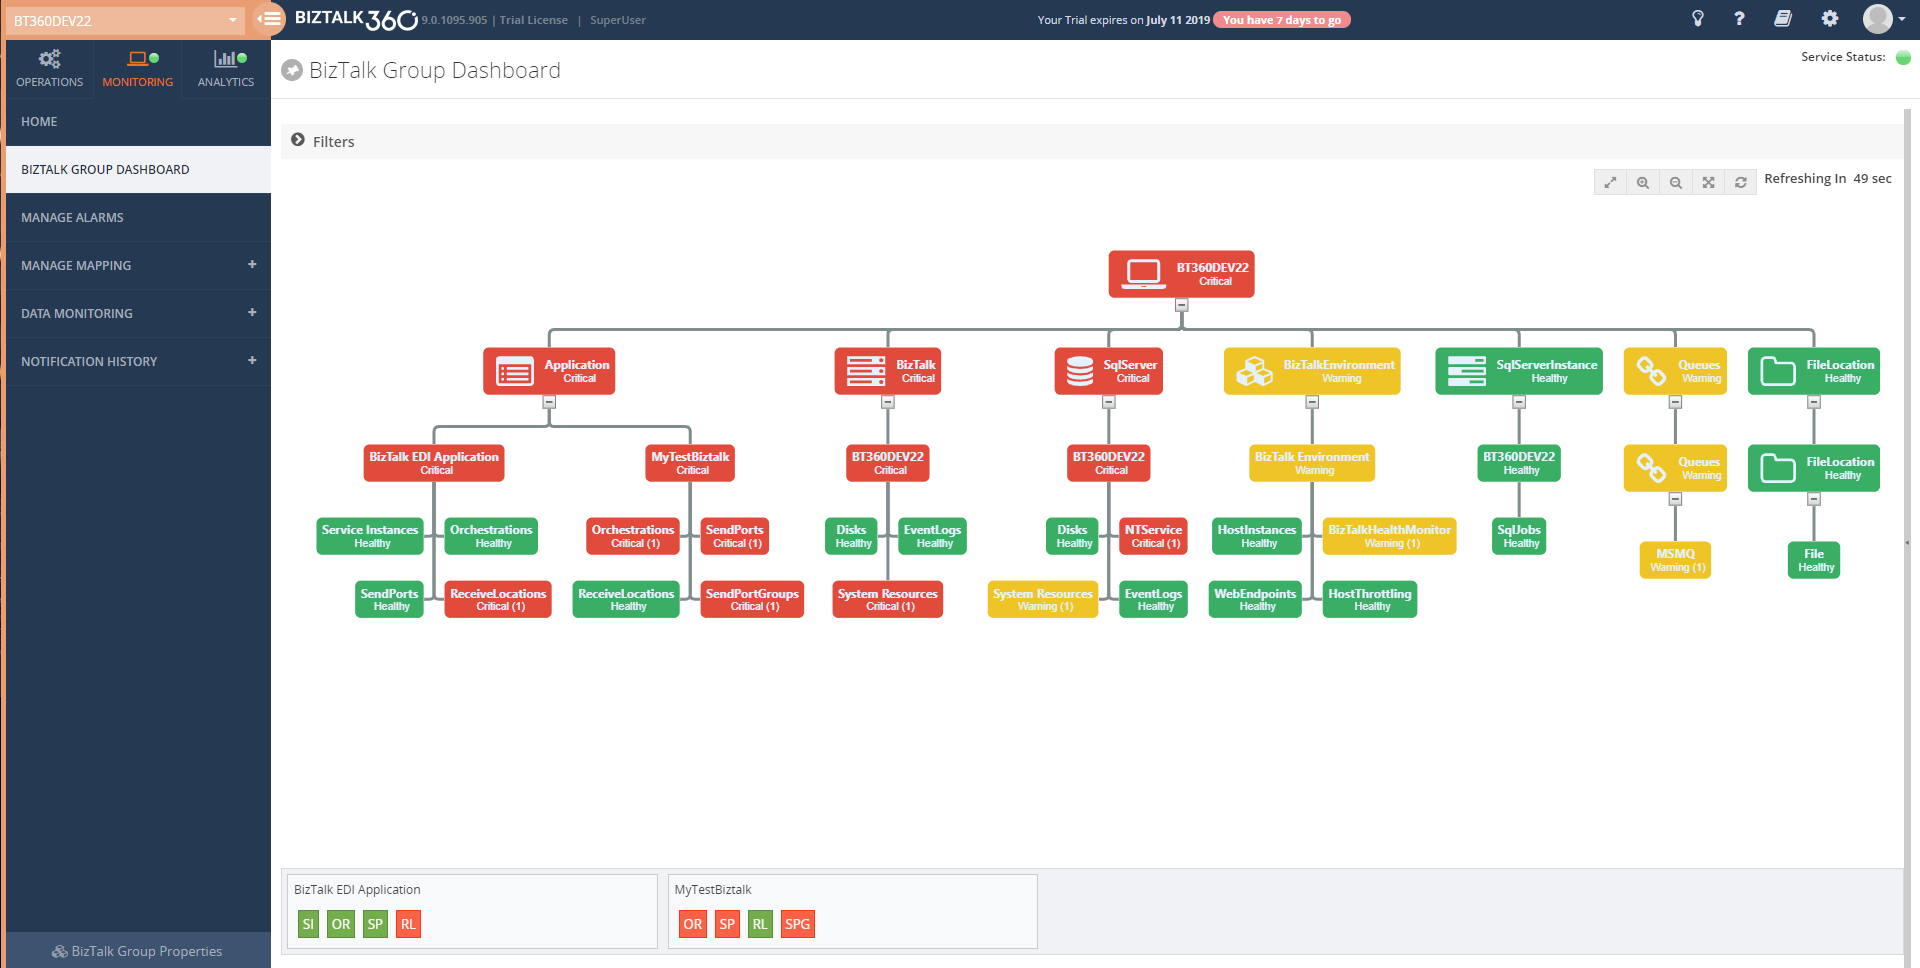
The dashboard has a draggable separator so that the user can adjust the width of the graphical window and the error/warning pane, based on their resolution. They can even minimize or maximize the error/warning pane to the leftmost section.
There is a chance of mapping the same artifact to multiple alarms. In such cases, the BizTalk Group Dashboard picks only the positive state of artifacts for monitoring. For instance, a Receive Location is mapped to an alarm1 with the expected state as Enabled and the same receive location is mapped to another alarm, say alarm2, with the expected state as Disabled; in this scenario, the BizTalk Group dashboard will only consider the positive state mapping such as expecting state as Enabled for monitoring.
Note: BizTalk group Dashboard is only designed for visual monitoring of the BizTalk environment and artifacts. It will not trigger any alert notifications.
Advantages of BizTalk Group Dashboard
Comparing to the already existing Monitoring Dashboard, the BizTalk Group dashboard has quite some advantages. Some of the main advantages of the BizTalk Group Dashboard are:
- It consolidates the status of all the artifacts which are mapped to any alarm and there is no need to switch alarms for viewing the status of any other artifact
- The BizTalk Group Dashboard can be split into two windows; one for the artifact graph and the other for viewing the Error/Warning pane. For usability, the split windows can be adjusted based on the monitor resolution
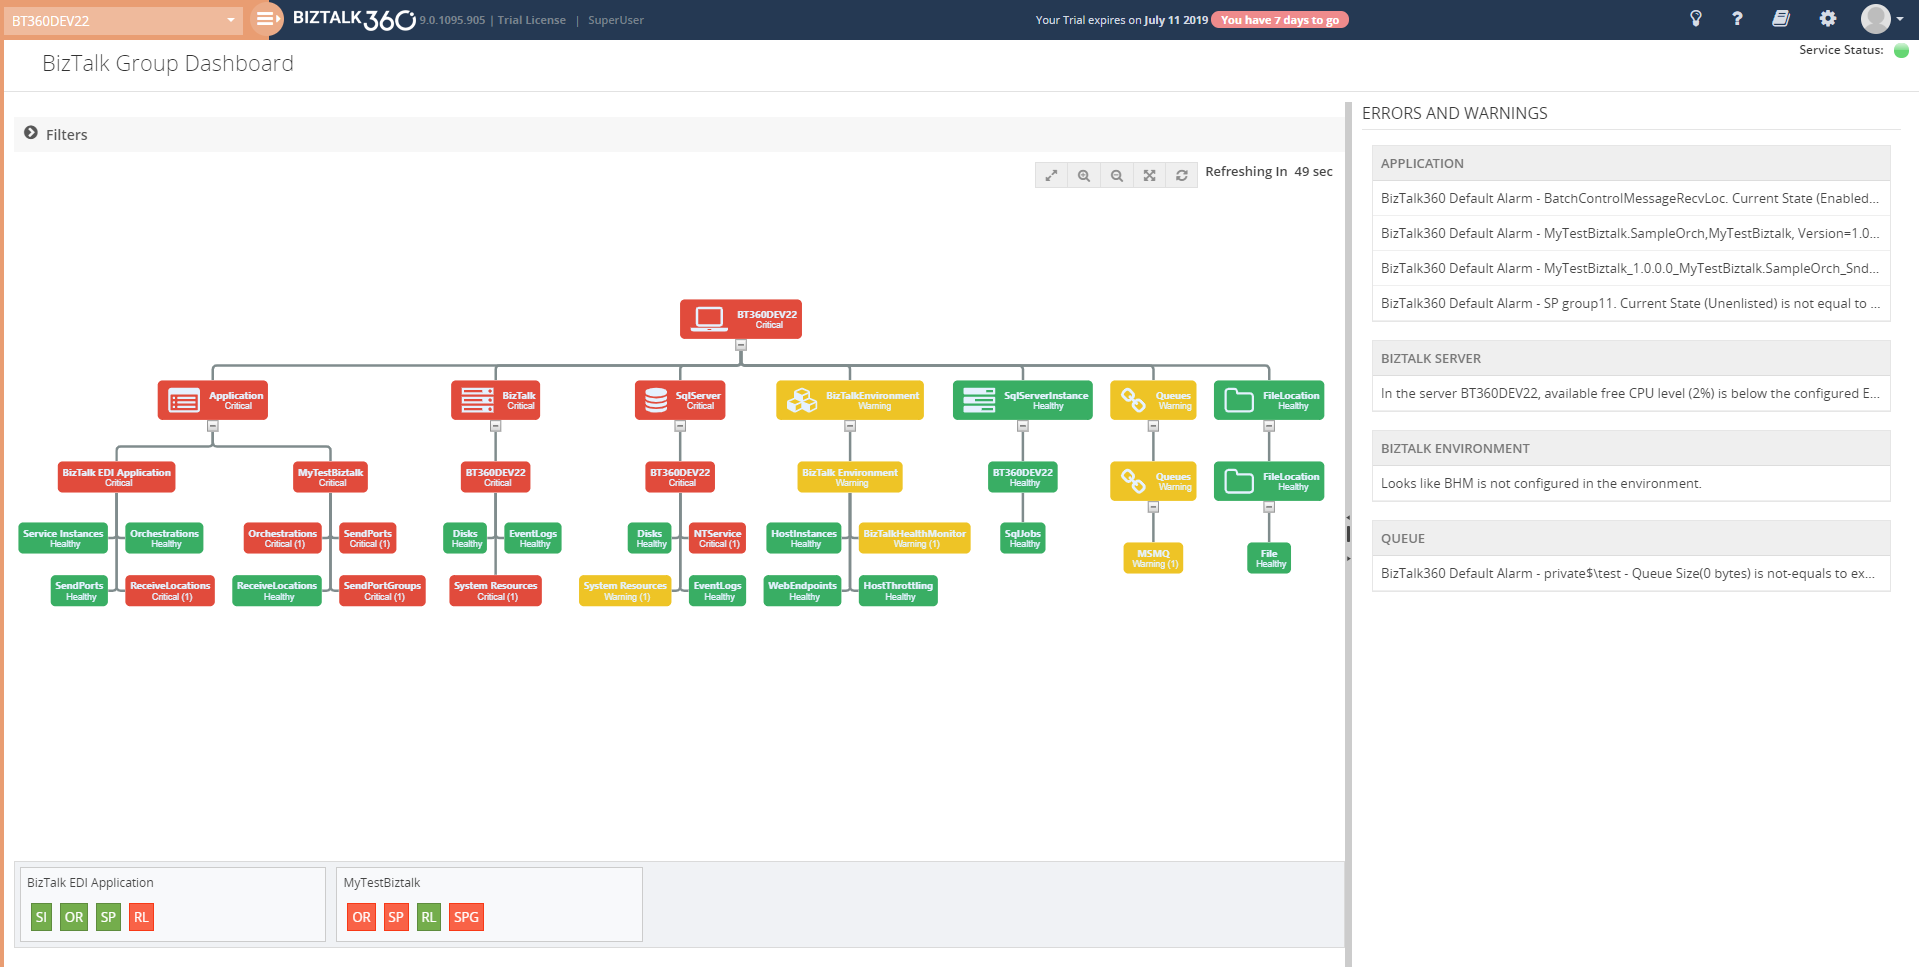
- For better monitoring, the user can apply filters (at the top of the graph) based on the artifact and/or based on the event type filter option
- The user can view the Error/Warning details along with the graph
Scenarios
Many organizations use different alarm configurations and patterns for their processes. Some of the commonly used alarm configuration patterns are:
- Integration-based alarm configuration
- Role-based alarm configuration
- Entity-based alarm configuration
Integration-based alarm configuration means configuring BizTalk artifacts, File location, Queues, Web endpoints, etc. in an alarm, which all belong to the same integration.
Role-based alarm configuration is configuring alarms for people in different roles. For example, a platform administrator will be interested in infrastructure settings like Disk, system resources, host instances in an alarm.A Database Administrator (DBA), on the other hand, will be more interested in the SQL Server instances and the jobs which have been deployed in it.
Entity-based alarm configuration is configuring similar components in the same alarm. For instance, putting all the queues like IBM Queue, Azure service bus queue, MSMQ in one alarm.
Irrespective of the alarm configuration/pattern, now the user can customise the BizTalk group dashboard using the filter capablity .Say Administrator can monitor the infrastructure components which are mapped to all the alarm .) and queues in a single dashboard window by filtering only the Infrastructure components.
Conclusion
With this feature, users are able to visually monitor all the artifacts and view error/warning details in a single dashboard with a much more comprehensive view. If you have any feedback or suggestions, please write to us at [email protected]. You can get started with monitoring your BizTalk environment via the BizTalk Group Dashboard by downloading the 30-day free trial of BizTalk360.
The post Consolidated monitoring with the new BizTalk Group Dashboard appeared first on BizTalk360.
by Lattetapriyanka Vishu | Jul 2, 2019 | BizTalk Community Blogs via Syndication
BizTalk360 always values customer feedback and we focus on improving the usability by adding new features and enhancing existing features as per customer requirements. Recently we have received a few support cases from our customer end about SQL Collation. So, we have analysed and improved it.
We are happy to share you that BizTalk360 has improved its standards by supporting case-sensitive collation. This will soon be available in the upcoming version 9.0 Phase 2. In the previous version of BizTalk360, we were supporting the general collation like Latin1_General_CI_AI for BizTalk360 Database. In this blog, we will see why we started supporting case sensitive SQL collation and what the benefits are of having it.
As you all know BizTalk360 is the one-stop monitoring tool to monitor BizTalk Server. Since BizTalk Server supports case sensitive collation, it is so important that BizTalk360 also supports case sensitive collation, to make it as a compatible tool.
About SQL Collation
A collation is a configuration setting that determines how the database engine should treat character data at the server, database, or column level. SQL Server includes a large set of collations for handling the language and regional differences that come with supporting users and applications across the world.
SQL Server is, by default case insensitive; however, it is possible to create a case sensitive SQL Server database and even to make specific table columns case sensitive. The way to determine a database or database object is by checking its “COLLATION” property and look for “CI” or “CS” in the result.
- CI refers to Case Insensitive
- CS refers to Case Sensitive
List of collation combination in SQL setup:
- SQL Server collation
- SQL Server and Database collation
- SQL Server, Database and Tables collation
- SQL Server, Database, Tables and Column collation
SQL has 4 levels of collation: server, database, table and column. If you change the collation of the server, database or table, then we don’t want to change the setting for each column. If needed, we can change the default collations at database/table/column level.
Note:
Example: If you change the default collation of a database, each new table you create in that database will use that collation, and if you change the default collation of a table each column you create in that table will use that collation.
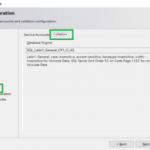
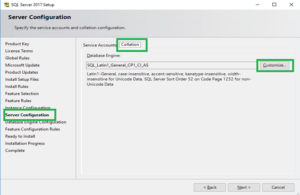
To change the collation of SQL Server: SQL Server collation can be changed in two ways, one is by changing the collation during the installation and the other way is changing the collation after installation.
Changing the collation during the installation: while installing SQL server, you can find the Server Configuration section. Under this section, you can see two sections Service accounts and Collation. Click the Collation tab to verify the collation. The collation will have the default supported collation. Click on the Customize… button and select the required collation. Click Next and proceed further.
Note: To have case sensitive collation use the collation which holds CS_AS.
Why BizTalk360 supports SQL Collation
BizTalk Server supports all case sensitive and case insensitive SQL Server collations except for binary collations. So, it is important that BizTalk360 should support the same collations.
Collation refers to a set of rules that determine how data is sorted and compared. When BizTalk360 calls any functions or data from BizTalk Server which is of case sensitive collation, then it may lead to an exception.
Let’s consider that the BizTalk databases hold a case sensitive collation and BizTalk360 holds a case insensitive collation. In this case, when BizTalk360 gets integrates with BizTalk Server and tries to read the data, it is necessary to ensure all the procedure and column names should be exactly similar.
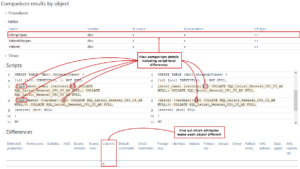
From the above picture it is clearly understandable that having a collation-based database, and when trying to fetch the data of an object, it will compare the case sensitiveness and provide the data. In case of uppercase and lowercase mismatch, it will lead to an exception.
Say for example, Invalid column name ‘nAdminHostId’ (or) Invalid object name ‘dbo.b360_ST_Schedules’ (or) Must declare the scalar variable “@expiryDateTime”etc.
Most of our customers configure BizTalk360 in the SQL Server instance where BizTalk Server is configured. In such cases, the below-mentioned scenario will add value for supporting collation.
Scenario I: BizTalkMgmtDb (Latin1_General_CS_AS) & BizTalk360 (Latin1_General_CI_AI)
Let us consider the scenario of having a SQL server with case insensitive SQL collation and case sensitive collation for BizTalkMgmtDb.
In this case, the BizTalk360 installation will be successful and BizTalk360 database will be created with case insensitive SQL collation since SQL Server holds a case insensitive SQL collation. But in the BizTalk360 application, you may face some exceptions getting popped up related to “Invalid column name ‘nAdminHostId”, in few sections like BizTalk Server, SQL Server, SQL Server instance, Analytics etc.
Scenario II: SQL Server (Latin1_General_CS_AS) & BizTalk360 Database (Latin1_General_CI_AI)
When creating a database in the SQL Server, by default the database will hold the collation of the SQL Server. In this case, the customer has the CS collation for the SQL server, thus all the BizTalk related databases hold the same case sensitive collation. In this case, when you try to install the BizTalk360 Db in the SQL server which holds Latin1_General_CS_AS collation, the installation will fail!
“ExecuteSqlStrings: Error 0x80040e14: failed to execute SQL string, error: Must declare the scalar variable “@environmentId”., SQL key: CreateTablesWin SQL string: ALTER PROCEDURE . @EnvironmentId uniqueidentifier”
The BizTalk360 database is created with a CI collation and BizTalk360 is installed by pointing the database to the CI collation DB. But, since the database was under the case sensitive collate SQL server, we had the same exception.
Query to create database with a case CI collation
CREATE DATABASE BizTalk360
COLLATE Latin1_General_CI_AI;
GO
In BizTalk360 v9.0 phase 2, the collation issue has been fixed across the application. We have revised the collation issue across each section in the application.
Checklist prepared to test SQL collation in BizTalk360
BizTalk360 supports many features like ESB, BAM, Azure etc. When having case sensitive collation for BizTalk360 Database, it is important that we look into all the sections of BizTalk360 (Operation, Monitoring, Analytics and Settings) to make it work correctly.
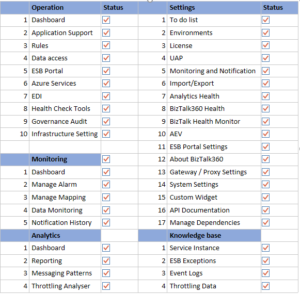
Say for example, BizTalk360 manages ESB exception data (EsbExceptionDb), in which it is important that all the column names, object names and procedures are exactly the same. We have nailed the compatibility of the BizTalk360 database with BizTalk Server database, ESB, BAM, Azure etc.
Conclusion
We always aim to improve the product by filling gaps in customer needs. Considering the same, we have improved the collation support in our upcoming release version 9.0 phase 2.
It is possible to have a combination of collation. Say, for example, SQL Server with the collation Latin1_General_CS_AS and BizTalk360 with Latin1_General_CI_AI. By achieving this, we have taken BizTalk360 to leading-edge technology in its standards.
The post SQL Collation Support in BizTalk360 appeared first on BizTalk360.

by Sandro Pereira | Jun 21, 2019 | BizTalk Community Blogs via Syndication
INTEGRATE (formerly known BizTalk Summit) is the premier, and maybe the biggest integration conference in the world focused on Microsoft Integration and a must go event for anyone who is working in this area. So, if you missed the chance to attend the London event this year, this is your last chance to meet and interact with the Microsoft Product Group, Microsoft Integration MVP’s and a huge list of attendees that are in fact experts from the field in these areas.
Since the first BizTalk Summit event till today, I’m a constant presence as a speaker at these events, and I had the enormous pleasure to present last time this event happened in USA (2017), that was, in fact, the first time I deliver a session in an event in the USA… and the way I was received and cherished by the attendees was so special that I could not miss this opportunity to come back again! So, I’m thrilled to say that I will be present once again in the INTEGRATE USA event delivering the second part of the session: BizTalk Server Fast & Loud!
Also, I’m extremely happy to say that for the second time DevScope (my company) will be sponsoring this amazing event!
I receive so many amazing feedbacks about my BizTalk Server Fast & Loud session two years ago, that this year I decided to create this second part, I was a bit nervous in the beginning because I want to keep the good level on the previous session and avoid what usually happens with the sequels in the movies, as a new part is released the quality goes down… and I think I did a good job, at least based on the feedback in London event. Personally, I love this session more than the previous. But at that time, I decide to do this session I did not know, and/or I had not decided that I would be present in the USA this year. So, this is, in fact, a happy coincidence, because the last time the event happened in USA my talk was the first part of this session :), so it makes more sense. But if you were not there you can see the first part of this session here: BizTalk Server Fast & Loud
About my session
Session Name: BizTalk Server Fast & Loud Part II: Optimizing BizTalk

Session Overview: Following the success of one of Sandro’s previous presentations at Integrate, Sandro decided to go deep on this hardcore BizTalk topic: Optimizing your BizTalk Server. This session will allow you to gain a better view on how to optimize BizTalk Server for better performance in all phases: your teams proactivity, your code, your environment, and your goals. Once again, this is a very extensive and complex topic and there is no magic formula you can apply to solve all your problems. This presentation will aim to guide you through some of the most important steps, operations, tasks and best practices that you need to do or be aware of, in order to boost the performance of your BizTalk Server projects and that you can adjust or follow according to your needs.

The event will take place between June 24-26, 2019 at Microsoft Campus, Redmond, WA and you are still on time to register for the conference here.
The post INTEGRATE 2019 USA – Redmond | June 24-26, 2019 | BizTalk Server Fast & Loud Part II appeared first on SANDRO PEREIRA BIZTALK BLOG.
by Lex Hegt | Jun 17, 2019 | BizTalk Community Blogs via Syndication
From time to time we go on a call with our customers because they raised a support ticket, or simply to explain a particular feature of the product. During such sessions, in most cases, the Operations Dashboard is the first screen which will show up after starting BizTalk360.
Unfortunately, quite often we find that dashboard in its out-of-the-box status. In this article, we will explain taking maximum benefits of the Operations Dashboard.
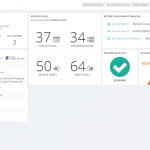
The default dashboard looks similarly like shown below.

Of course, it is up to our customers to leave the BizTalk360 Operations Dashboard to its defaults. However, there is a big opportunity to make the Operations Dashboard much more informative about your BizTalk environment. In this article, we will show some examples on how to improve the Operations Dashboard.
What is the Operations Dashboard?
The Operations Dashboard, the Home Page of BizTalk360, is designed to provide its users with valuable information about their BizTalk environment. The advantage is that each user has its own homepage and can shape it to his/her own requirements. For example, you can think of showing information in the following categories:
• Suspended/Running Instances
• Status of BizTalk artifacts
• EDI Interchanges and Transaction Sets
• ESB Faults, Itineraries and Resubmissions
• Customized information based on REST API’s
• Shortcuts to BizTalk360 features
All the information is shown in, what we call, widgets. For most widgets, you can decide on matters like:
• Location on the dashboard
• Size of the widget
• Refresh interval of the widget
In summary, by choosing the relevant widgets from the available set of widgets, rearranging and resizing them according to your needs, you can create a highly usable and effective dashboard which gives you a good overview of the health of the environment.
You can read more about Widgets and Widget Operations in the Documentation Portal of BizTalk360.
Before I joined Kovai.co, I was a BizTalk consultant and mainly had developer and administrator roles at many different companies. During that time, I frequently helped these customers out by installing and implementing BizTalk360. Obviously, setting up the Operations Dashboard was a part of that kind of assignments.
In many cases, I ended up with a dashboard like the one which is shown below.

Above dashboard is divided into the following 5 different sections:
1 – Shortcuts to BizTalk360 features
As BizTalk360 has grown over the years to a very rich-featured product, it can be hard to find your way through all the features. Because we want to make navigation throughout all the features a bit easier, we have added pinpoints to most of the features. By clicking on such a pinpoint, a shortcut to the feature is added to the Operations Dashboard. This first section contains several such pinpoints.
2 – Status of BizTalk artifacts
Part of providing an overview of your BizTalk environment is being aware of the status of your BizTalk artifacts. You can think of your Receive/Send Ports, Orchestrations, Host Instances and depending on your scenario, also the EDI Parties & Agreements. BizTalk360 helps you in providing the status of these artifacts in one glance, after you have added these artifacts from the widget library to the dashboard, resize them and drag them to the position you want them to show up.
3 – Some miscellaneous widgets
This section shows the following 2 widgets:
• Monitoring status – this widget reflects the status of the BizTalk360 Monitoring Service. This Windows NT service is used for amongst others performing the actual monitoring, sending notifications, etc. Because this is such an important component, it makes sense to show its status on the dashboard.
• Link to the documentation portal – to help our customers, we put a lot of effort into the maintenance of the documentation portal. Besides topics like Release Notes for all its releases, you will also find detailed information about all the features of the product. That’s why it is handy to have this portal easily accessible from the dashboard.
4 – BizTalk runtime information
Another important category of information to have at hand is the runtime information about Running and Suspended instances. BizTalk 360 contains widgets for both categories and for aggregations like Service Class, Service Name, Error Code, Host Name, BizTalk Application and few more. These different aggregations enable you to take the aggregation you prefer the most.
Besides the Runtime information, the section also shows the BizTalk Environment Properties, which you will find handy to have at hand.
5 – Alarm information
This last section shows information about the two different kinds of alarms. With BizTalk360, you can setup Alarms, being:
• Alarms – used for threshold and health monitoring. The widget shows information about the number of created alarms, how many are Enabled/Disabled, how many alarms contain mappings to (BizTalk) artifacts and how many still need to be mapped to (BizTalk) artifacts
• Data Monitoring – used for monitoring the processing of messages by BizTalk. This widget shows the number of monitors created for each type of monitor.
The purpose of these widgets is to provide the insight if, for example, alarms have been turned on/off for maintenance or few alarms are just empty containers and still need to be mapped to artifacts.
The described set of widgets is just an example. If you feel like some of those widgets are not helpful for you, it is totally fine to select different widgets from the library.
Custom widgets
From time to time, we see customers experimenting with the so-called Custom Widgets. A Custom Widget consists of HTML and JavaScript. By creating such widgets, you can make calls to REST API’s and show the output of such REST API’s in the widget. This leads to an enormous range of capabilities! We have seen customers making calls to BizTalk360 API’s to show the result of for example SQL queries, or the status of the BizTalk related SQL Server jobs, but we have also seen customers are embedding Power BI views directly in their BizTalk360 Operations Dashboard!
In the Documentation Portal, we have written an article about creating a Custom Widget for showing the results of a SQL query. We have seen that this is something quite useful. Read this article in the Documentation portal, or this blog post, if you want to know more about how this is done.
Global and private dashboards
The Operations Dashboard is the home page for the BizTalk360 user. However, having one dashboard might not be enough for your requirements. You might need to show a lot of different information on a dashboard, and having that information on a single dashboard would make it messy and you’ll lose the overview.
To help you out, you can create additional dashboards in BizTalk360. Additionally created dashboards show up in the Operations menu, under Dashboards.

In addition, you can choose whether a dashboard is Global or Private.
A Global dashboard can be accessed by anyone who has access to BizTalk360. A Private dashboard can only be accessed by the BizTalk360 user who created the private dashboard.
User Policy limited access to information
The data which becomes shown in the dashboards depends on the permissions which are provided to the user. This means that:
- there are no limitations for a Super User
- a Normal User will only have access to the information according to his/her User Access Policy. A few examples:
- if the user has no permissions to EDI, the EDI related widgets will not show up nor be accessible for that user
- information about BizTalk Applications (Ports, Orchestrations and Service instances) for which the user has no permissions, will not show up in the dashboards
Conclusion
With this article, we intend to encourage you to think about your Operations Dashboard. It is not hard to customize your dashboard and you will benefit from a nicely customized dashboard immediately!
If you want to discuss your Operations Dashboard or need some help to properly set it up, feel free to contact us at [email protected].
The post Taking Maximum Benefits of the Operations Dashboard appeared first on BizTalk360.