This post was originally published here
Introduction
BizTalk users who use BizTalk360 can manage their BizTalk environment in a more efficient way. Monitoring and Notification is amongst the most important features in BizTalk360, The first and foremost step for monitoring is mapping the artifacts to an alarm. In which user can use this on a daily basis to monitor their BizTalk environment and get notified if any violation occurs.
The Monitoring Dashboard is the one stop point for users to view the status of the artifacts which are mapped to an alarm. Typically a customer displays the monitoring dashboard in big screens and looks for the health of their BizTalk environment visually. The monitoring dashboard is structured at alarm level, which lists the status of all the artifacts mapped to the respective alarm. However, you cannot see all the alarms and their mapped artifacts status in a single view, which was a usability problem persist from our side. To overcome these we are implementing the “BizTalk Group Dashboard” for the v9.0 (phase 2). With this dashboard you can view the status of all the artifacts mapped to any number of alarm in a single view and you can easily customize it using the rich filter option provided
Let’s deep dive into BizTalk Group Dashboard and see how it solves the problem.
BizTalk Group Dashboard
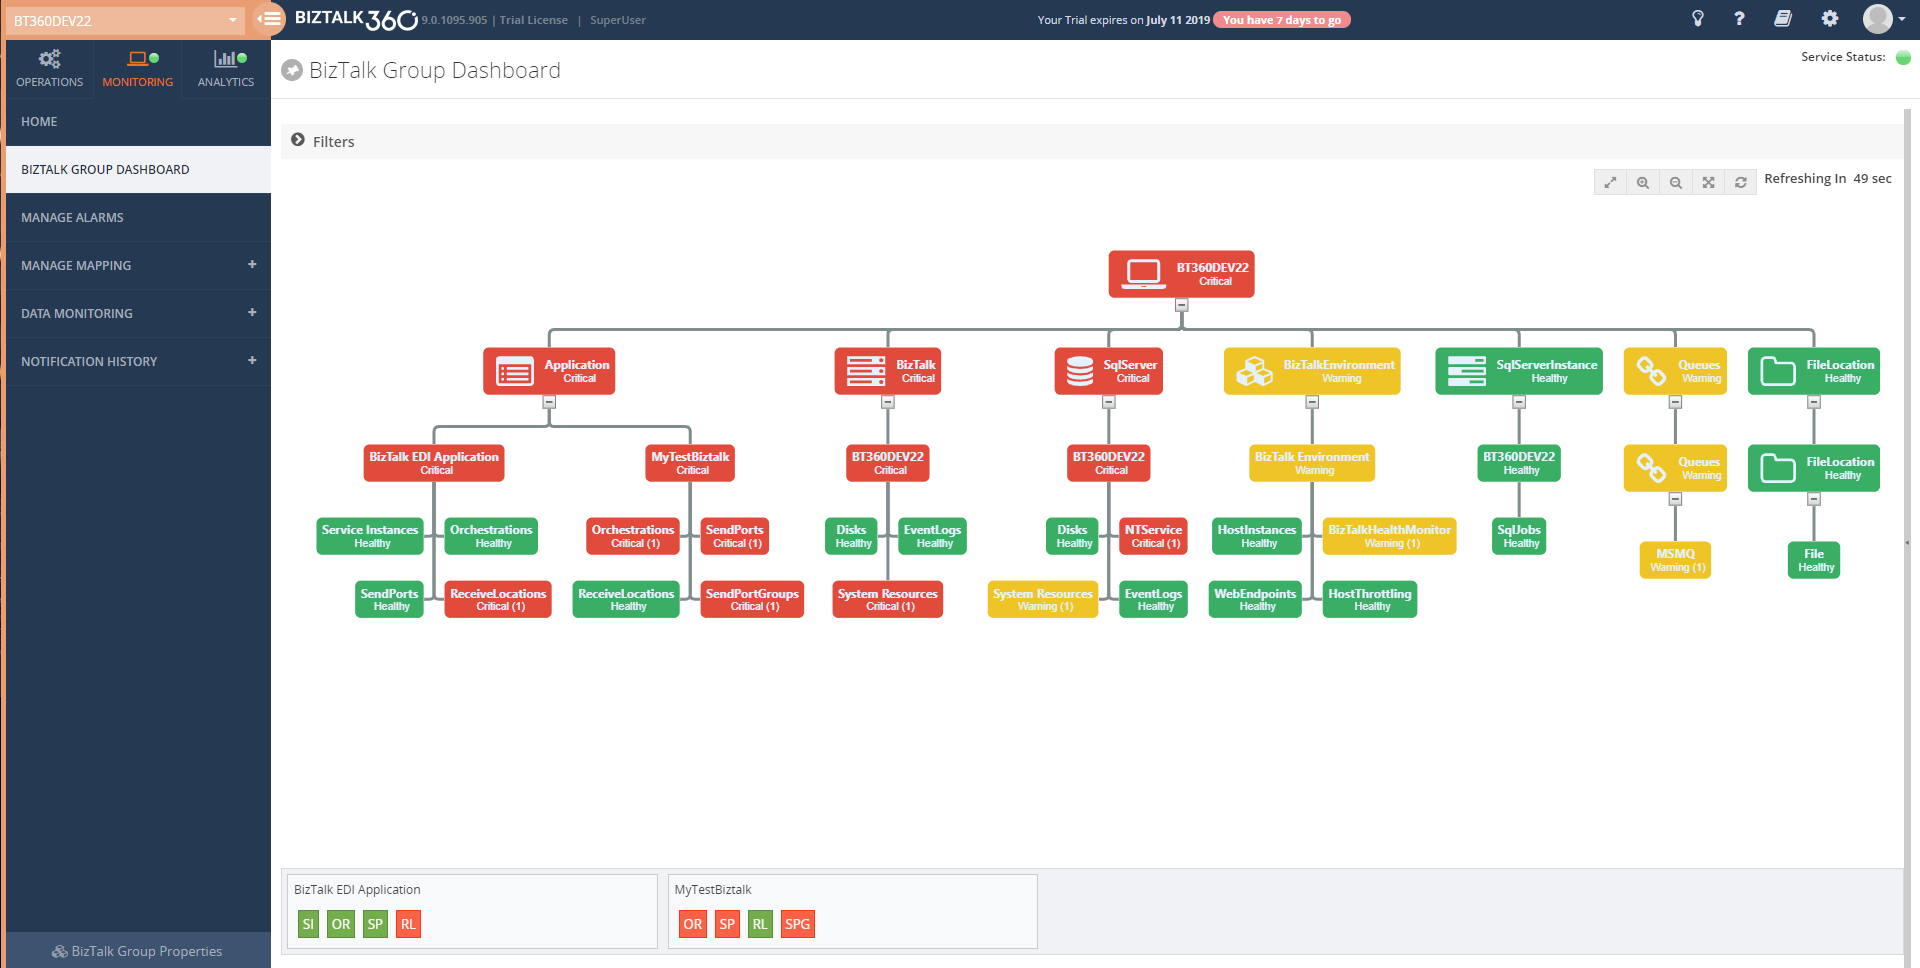
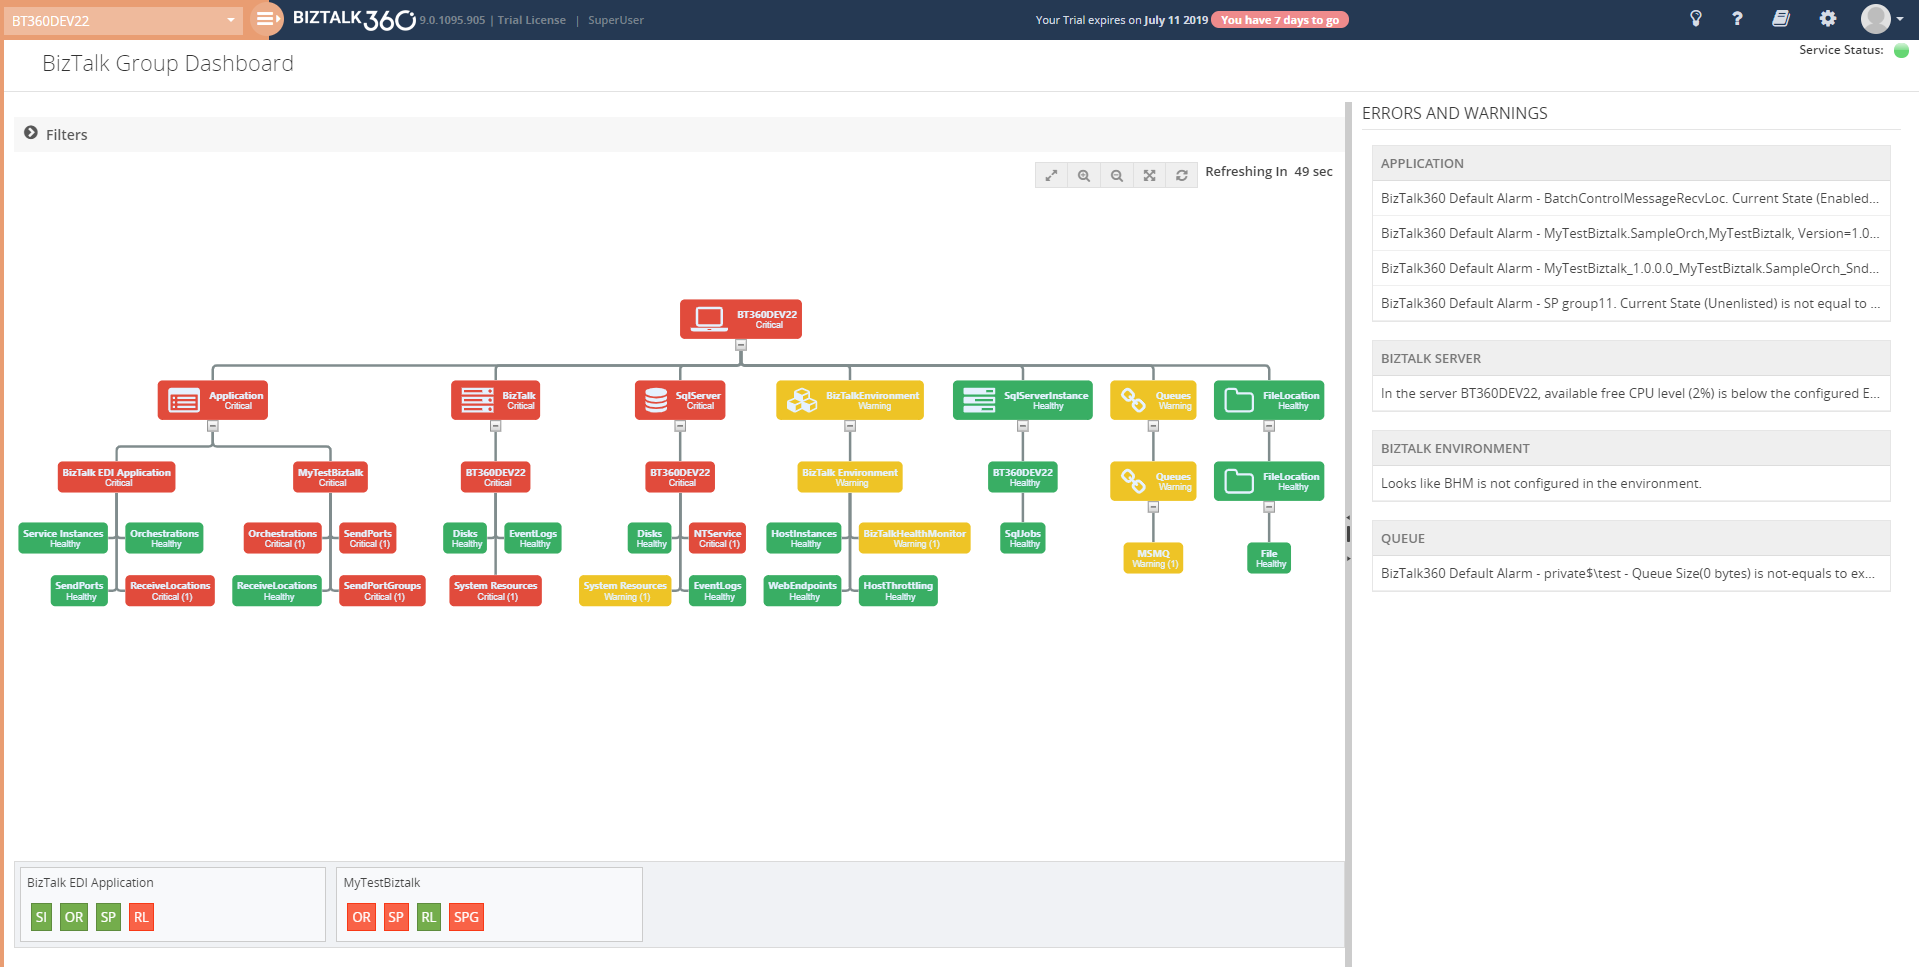
The BizTalk Group Dashboard is designed to monitor all the artifacts (and view all errors) which are mapped to all the configured alarms in BizTalk360, in a single view. The BizTalk Group Dashboard can be found under the Home of Monitoring section. The “BizTalk Group Dashboard” will automatically pick up all the artifacts (which are mapped to any of the BizTalk360 alarms) and displays the status of the artifacts in a graphical manner . Also the error details of the displayed artifacts are shown in a grid view . The BizTalk Group dashboard checks the status of the artifacts in every 60 seconds .
For better usability, BizTalk Group Dashboard splits the windows in two sections:
- Displays the mapped artifacts in a graph
- Show the Error/Warning details in an artifact level segregation
The dashboard has a draggable separator so that the user can adjust the width of the graphical window and the error/warning pane, based on their resolution. They can even minimize or maximize the error/warning pane to the leftmost section.
There is a chance of mapping the same artifact to multiple alarms. In such cases, the BizTalk Group Dashboard picks only the positive state of artifacts for monitoring. For instance, a Receive Location is mapped to an alarm1 with the expected state as Enabled and the same receive location is mapped to another alarm, say alarm2, with the expected state as Disabled; in this scenario, the BizTalk Group dashboard will only consider the positive state mapping such as expecting state as Enabled for monitoring.
Note: BizTalk group Dashboard is only designed for visual monitoring of the BizTalk environment and artifacts. It will not trigger any alert notifications.
Advantages of BizTalk Group Dashboard
Comparing to the already existing Monitoring Dashboard, the BizTalk Group dashboard has quite some advantages. Some of the main advantages of the BizTalk Group Dashboard are:
- It consolidates the status of all the artifacts which are mapped to any alarm and there is no need to switch alarms for viewing the status of any other artifact
- The BizTalk Group Dashboard can be split into two windows; one for the artifact graph and the other for viewing the Error/Warning pane. For usability, the split windows can be adjusted based on the monitor resolution
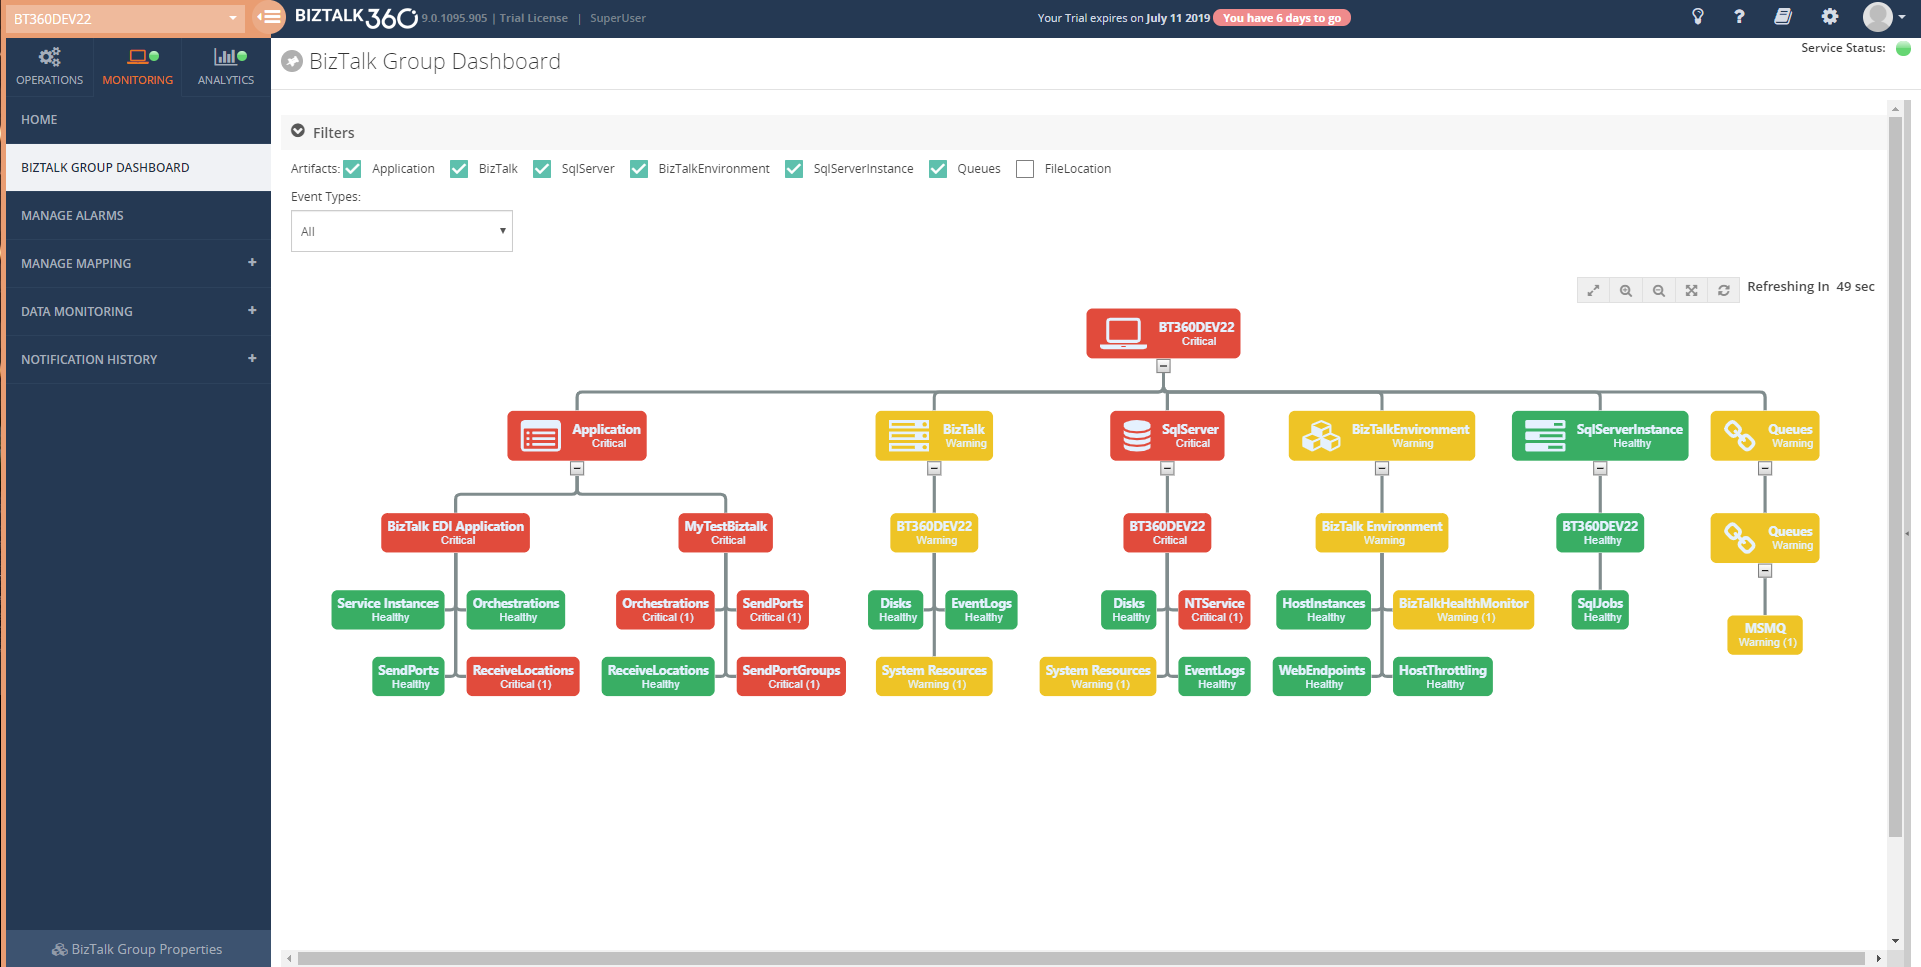
- For better monitoring, the user can apply filters (at the top of the graph) based on the artifact and/or based on the event type filter option
- The user can view the Error/Warning details along with the graph
Scenarios
Many organizations use different alarm configurations and patterns for their processes. Some of the commonly used alarm configuration patterns are:
- Integration-based alarm configuration
- Role-based alarm configuration
- Entity-based alarm configuration
Integration-based alarm configuration means configuring BizTalk artifacts, File location, Queues, Web endpoints, etc. in an alarm, which all belong to the same integration.
Role-based alarm configuration is configuring alarms for people in different roles. For example, a platform administrator will be interested in infrastructure settings like Disk, system resources, host instances in an alarm.A Database Administrator (DBA), on the other hand, will be more interested in the SQL Server instances and the jobs which have been deployed in it.
Entity-based alarm configuration is configuring similar components in the same alarm. For instance, putting all the queues like IBM Queue, Azure service bus queue, MSMQ in one alarm.
Irrespective of the alarm configuration/pattern, now the user can customise the BizTalk group dashboard using the filter capablity .Say Administrator can monitor the infrastructure components which are mapped to all the alarm .) and queues in a single dashboard window by filtering only the Infrastructure components.
Conclusion
With this feature, users are able to visually monitor all the artifacts and view error/warning details in a single dashboard with a much more comprehensive view. If you have any feedback or suggestions, please write to us at support@biztalk360.com. You can get started with monitoring your BizTalk environment via the BizTalk Group Dashboard by downloading the 30-day free trial of BizTalk360.
The post Consolidated monitoring with the new BizTalk Group Dashboard appeared first on BizTalk360.


