Today I faced a very peculiar problem. I was helping a customer split a BizTalk project
into two projects, because some of the schemas that were in the original project needed
to be common for other projects.
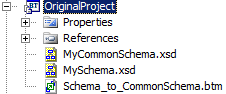
So this is what i started out with:
which is: Two schemas and a map between them.
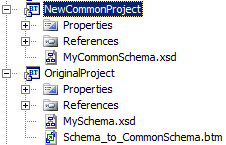
And this is what I would like:
So basically, the common schema has been transferred to a common project. Now, naturally,
I need to reference the CommonProject from the OriginalProject and then reload the
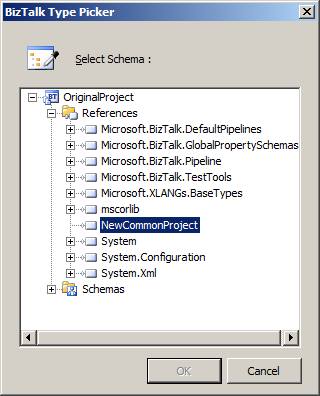
schema in my map to make it work. But this is where the weird part starts. After compiling
the NewCommonProject and adding the reference, this is what showed up in the schema
browser when I wanted to reload the schema in the map:
Basically, my new project didn’t have any schemas inside it. After much troubleshooting,
thinking that the issue was something with the newly compiled dll didn’t get copied
to the bin folder of the OriginalProject and trying lots of stuff with that, I finally
figured it out.
I just happened to notice that the file size of the NewCommonProject.dll was only
5kb which seemed to small. So I browsed the dll in the object browser and it was totally
empty. Weird. Then I went and looked at the properties of the schema, and didn’t see
anything unusual. So I added a new schema to the project just to see what would happen
with that. This new schema showed up in the schema browser. Even weirder. But then
I went and looked at the properties of the schemas again and that’s when this new
property suddenly showed up:
I changed the build action on the schemas to be “BtsCompile” and this did the trick.
Now all the schemas showed up in the schema browser.
Now, another strange side to this story is, that by now, the Build Action property
has disappeared again I haven’t quite figured out when it appears and when it does
not.
BUT, if you ever run into issues where your schemas just don’t show up anywhere this
might be your issue.
As I announced in a previous post, I just released a MMC Snap-in for MBV.
To be honest, I did not have ideas about really new useful features I could add in MBV itself or around MBV but reading some posts on other blogs talking about BizTalk Admin and suggestions of a better integration with MBV, I thouht : eh maybe I could integrate MBV in an MMC !
Doing that will allow so any BizTalk administrator to have for example his own custom MMC console (.MSC) by adding the BizTalk Snap-in and the MBV one !
If yoo look at the file behind the BizTalk Administration console, you can see that it is an .msc file containing both the Microsoft BizTalk Server MMC Snap-in and the EventViewer one; so you could create easily for example your own .msc adding BizTalk Snap-in, the Eventlog one, and MBV Snap-in
So I created a MMC snap-in for MBV in C# using the MMC 3.0 SDK: what is easier to develop an MMC Snap-in using .NET ! 🙂
Setup:
just run the setup.exe on your machine to register the snap-in automatically
This snap-in use .NET 2 so on a BizTalk 2K4 machine, the setup can propose you to download the .NET 2. framework.
This snap-in use Microsoft Mgmt Console 3.00 framework on a W2K3 machine,you may have also to install KB 907265 :
One the setup finished, open MMC console and choose to add a Snap-in. You should see in the list “MBV Snapin”.
The first version of this MBV snap-in I release allow to run a collect statement in the MMC by starting in an hidden mode the console version of MBV tool : “BTSDBCOLLECT.EXE”.
When you add first time the Snap-in, a dialogbox will be displayed inviting you to specify local path of MBV Console tool BTSDBCOLLECT.EXE. Once it is one, you can also select the profile to use among the profiles present (created by GUI version of MBV) and then the MBV Snap-in will be added in the MMC console.
‘MsgBoxViewer’ Node
The ‘MsgBoxViewer’ MMC node will then allow you to start a Collect statement, change settings, open status file or History File or delete all HTML reports appearing as childre nodes. This node display also as children nodes the existing HTML reports found in the HTML folder (either the one configured in selected profile file ‘MBVSettings….XML’ or by default the folder of MBV tool).
Starting a Collect statement
When you put the focus on ‘MsgBoxViewer’ node, right-click on it and start a collect statement, the MMC display in the right pane the resulting cmd line executed, and the status bar will show all the steps of the Collect statement.
At the end of the collect statement, the MMC will add in the left pane a children node representing the MBV HTML file produced and will show this file in the right pane.
Complete status of the collect is displayed in the right pane when selecting back the node ‘MsgBoxViewer’.
Open an existing HTML MBV Report
Once you clicked a section (sub-node) of an HTML report node in the treeview of the left pane, you have immedialtely on the right pane of the MMC the selected sectioj of HTML MBV report displayed like in the Internet Browser. You can so display quickly a Warning Report sectrion of an existing HTML Report.
Change Settings
Right-cliking on ‘MsgBoxViewer’ node and selecting the ‘Settings” action, you can change the global settings and for example selectb the MBV profile to use for the collect, that you have prepared before with gui version of MBV. Selecting a profile in the snap-in allow so to run only the queries you selected with also the global options you configured in the gui version of MBV.
Thanks to everyone that came to the Connected Systems SIG meeting of the San Diego .NET User group meeting tonight where I presented on “M” and “Oslo”. I’m really passionate about the whole Oslo initiative, and, well, if you were there tonight, then you should be pretty aware of that 🙂
As promised, I have created an “Oslo Links” page here on my site. This will not be a “link list” containing all Oslo-links on the Net, but rather it will be some key links/aggregators that you can use as a jumping off point.
And, if you were not at the presentation, you can watch at least the demo part of what I showed (the best part! :)) of it here at CloudTv.
Our team delivers many presentations to internal and external audiences on BizTalk, we have put some of these up here, see links below. Please feel free to use these as you wish. We will be adding more presentations over the next few months as we wrap up our tests for the BizTalk 2009 performance guide (estimated delivery date August 1st 2009).
In this post we will explain how Tracking Participants work and how they are used to process and store the Tracking Records emitted from the workflow. We will also cover the out of box Event Tracing for Windows (ETW) Tracking Participant and how to use it to view Tracking Records in Event Viewer.
You can also try out the following samples for a more hands on experience with Tracking in .NET 4 Beta 1. Throughout this blog post, we will be using several examples contained in these resources:
1) Tracking Records are emitted from the Workflow Runtime.
2) Tracking Profiles let you subscribe to Tracking Records in a declarative, flexible manner.
3) Tracking Participants listen to the Tracking Records being emitted from the runtime directly and process them in whatever way they choose to. This includes writing to a specific output (e.g. File, Console, ETW), processing/aggregating the records, or any other combination that might be required.
In WF 4, multiple tracking participants can consume the tracking events simultaneously. Each tracking participant can be associated with a different tracking profile.
Tracking Participants are used to get the tracking data emitted from the workflow and store it into different mediums. Likewise, any post processing on the Tracking Records can also be done within the Tracking Participant. In future posts we will cover the full extensibility of the Tracking infrastructure provided in WF 4, including writing Custom Tracking Participants.
Next we will look at the out of box Tracking Participant included in .Net 4 Beta 1; the ETW Tracking Participant.
Out of box ETW Tracking Participant
In .NET 4, we ship an out of box Event Tracing for Windows (ETW) Tracking Participant which writes the Tracking Records to ETW. The ETW Tracking Participant writes these records to an ETW session in a very efficient manner with minimal impact to the app’s performance.
One of the advantages of using this tracking participant is the tracking records can be viewed in the Windows Event Viewer, alongside your application and system logs.
The ETW tracking participant is configured in the web.config as follows
In ETW, events are written to the ETW session through a Provider Id. The Provider Id that the ETW Tracking Participant uses for writing the Tracking Records to ETW is defined in the diagnostics section of the web.config (under <system.serviceModel><diagnostics>):
By default, the ETW Tracking Participant uses a default Provider ID when one has not been specified.
Tracking Participants are declared in the <system.serviceModel><tracking><participants> section. Each tracking participant can have a profile associated with it to specify the tracking records it has subscribed to:
Once they have been declared, the Tracking Participants can be added to the service behavior. This will add the selected Tracking Participants to the Workflow instance’s extensions, so that they begin to receive the Tracking Records.
For this, we simply use the same name with which the Tracking Participant was declared in the previous step:
A graphical representation of the flow of Tracking data through the ETW Tracking Participant would be as follows:
Once the tracking data reaches the ETW Session, it can be consumed in a number of ways. One of the most useful ways to consume these events is through Event Viewer, a common Windows tool used for viewing logs and traces from applications and services.
Consuming Tracking data from the ETW Tracking Participant in Event Viewer
Events that are written to the ETW session by the ETW Tracking Participant can be consumed through Event Viewer (when using the default Provider ID). This allows for rapidly viewing the Tracking Records that have been emitted by the workflow.
To enabling viewing the Tracking Records in Event Viewer:
1) Open Event Viewer (eventvwr.exe)
2) Navigate to “Application and Services Logs”-> “Microsoft” -> “WCF” -> “WF-Development”
3) Right-click and enable View -> “Show Analytic and Debug logs”
4) Enable the log
In the ETW Tracking Participant Sample, the workflow simulates to have an error, and the ETW Tracking Participant is used to trace the issue. The tracking events are displayed in the Event Viewer below:
All the Tracking Records have ETW event IDs ranging from 100-112. Other event IDs (200-225) are used for other types of tracing such as WCF Traces. In future posts we will cover correlating tracing and tracking events for a full end-to-end view of the monitoring data.
Tracking Records emitted through the ETW Tracking Participant also appear with the appropriate severity level in Event Viewer. This way it is easy to identify any warnings or errors with the execution of the workflow.
With the ETW Tracking Participant and its integration with Event Viewer, consuming Tracking Records is fast and easy in .Net 4 Beta 1.
What’s Next
In future posts we will cover writing Custom Tracking Participants and emitting Custom Tracking Records. In the meantime, we look forward to your feedback on our samples and Hands on Labs:
Today at Microsoft’s Worldwide Partner Conference, we announced availability for BizTalk Server 2009 Enterprise Runtime Edition, BizTalk Server 2009 Standard Runtime Edition, and BizTalk Server 2009 RFID.
We recently launched BizTalk Server 2009, which is currently helping customers to integrate business applications and partners and to automate and simplify processes. With more than 8500 customers worldwide, the BizTalk customer base continues to grow rapidly.
We now offer multiple editions of BizTalk Server to enable any size ISV partner to leverage the product capabilities.
BizTalk Server 2009 Enterprise Runtime Edition: Every application needs to integrate with other applications in customer environments and solution companies do not want to reengineer and build an integration server from scratch. BizTalk Server 2009 Enterprise Runtime edition provides all integration capabilities with high availability features and all the adapters to systems like SAP, Oracle E-Business Suite and Mainframe systems. Enterprise Runtime is a special edition for partners designed to be used in support of their ISV application, as part of a unified solution. BizTalk Server 2009 Enterprise Runtime includes all capabilities, adapters and accelerations and supports scale out/failover, multi-server configuration with multiple message boxes.
BizTalk Server 2009 Standard Runtime Edition: BizTalk Server 2009 Standard Runtime Edition is a great option for partners who need low cost option and do not need high availability. Standard Runtime includes all the capabilities of BizTalk Server along with all adapters to embed inside ISV application. Standard Runtime allows partners to deliver 1 BizTalk application and connect to 1 external application. Goal of Standard Runtime is to provide integration capability at a very low price for ISV partners.
BizTalk Server 2009 RFID Edition: RFID is being used to transform business processes by companies across industry verticals. Microsoft first delivered RFID platform as part of BizTalk Server 2006 R2. Now in its 6th version, BizTalk Server 2009 has made major enhancements to this platform including application platform for mobile RFID devices and support for industry standards like EPCIS, LLRP, and TDT/TDS. Microsoft also received EPCIS certification from GS1 EPCGlobal for BizTalk Server 2009. BizTalk RFID 2009 is a dedicated SKU for partners and customers interested in RFID deployments. It provides capabilities like high availability, plug and play devices; enterprise manageability with System center and SDK for partners and customers to build RFID enabled solutions etc.
I had a PowerPoint 2007 presentation this morning that I needed to convert into the OpenDocument Presentation format, to make it usable in OpenOffice 3.0. It was a fairly simple presentation, with no animations or anything, just text and some figures.
My first attempt was to simply use the PPTX importer in Impress, and ended up […]
Topic Microsoft has embarked on a major initiative to make it easier to design, construct, deploy and manage distributed applications and services. The Oslo modeling platform is a key part of this vision, and "M", a new way to describe models, lies at the heart of Oslo. In this session we drill into the composite parts of M: MSchema, MGrammar and MGraph. We will see how these pieces can be used to create a DSL (Domain Specific Language) and how that DSL can be used. We will also look at the tooling that Microsoft is providing to work with textual and graphical DSLs. We will demo a DSL that can be used as a REST client.
Speaker
Brian Loesgen is a Principal SOA Architect with Microsoft. Based in San Diego. Brian is a six-time Microsoft MVP for BizTalk Server, and has been involved with BizTalk since prior to the BizTalk Server 2000 beta. Brian has extensive experience in building sophisticated enterprise, ESB and SOA solutions. Brian was a key architect/developer of the "Microsoft ESB Guidance", initially released by Microsoft in Oct 2006. He is a co-author of six books, including "BizTalk Server 2004 Unleashed", and is currently working on "SOA with .NET". He has written technical white papers for Intel, Microsoft and others. Brian has spoken at numerous major technical conferences worldwide. Brian is a co-founder and past-President of the International .NET Association (ineta.org), and past-President of the San Diego .NET user group, where he continues to lead the Connected Systems SIG, and is a member of the Editorial Board for the .NET Developer’s Journal. Brian was also a member of the Microsoft Connected Systems Division Virtual Technical Specialist Team pilot, and is part of Microsoft’s Connected Systems Advisory Board. Brian has been blogging since 2003 at http://blog.BrianLoesgen.com.
When and Where
We’ll be meeting on the 4th floor of the Microsoft La Jolla office. Pizza will be available at 6:00 PM. The meeting will start at 6:30 and end at 9 o’clock.
Address: 9255 Towne Centre Dr San Diego, CA 92121 Map PLEASE NOTE THAT PARKING ARRANGEMENTS HAVE CHANGED. YOU WILL HAVE TO PAY FOR PARKING IF YOU USE THE BUILDING LOT. WE SUGGEST YOU PARK ON THE STREET TO THE NORTH OF THE BUILDING OR IN THE UTC SHOPPING CENTER
I just installed the July 2009 .NET Services SDK and after reviewing it for changes, I started wondering how I might call a cloud service from BizTalk using the out-of-the-box BizTalk adapters. While I showed in a previous blog how to call .NET Services service anonymously, that isn’t practical for most scenarios. I want to […]