by community-syndication | May 25, 2010 | BizTalk Community Blogs via Syndication
Great tip from Dominick to quickly determine the use an ASP.NET, WCF or WF4 service is running under. Add the following ASPX file and hit it with the browser.
<%@ Page %>
<%= System.Security.Principal.WindowsIdentity.GetCurrent().Name %>
Thanks to Dominick
www.TheProblemSolver.nl
Wiki.WindowsWorkflowFoundation.eu
by community-syndication | May 25, 2010 | BizTalk Community Blogs via Syndication
Thanks to everyone attending the BizTalk Performance talk at the Swedish User Group, last week. The webcasts are ready and will be posted on DevCenter shortly.
The downloads includes presentations and scripts used in the first talk. It also includes the Streaming and Large Message Transmission demo from the second talk. I did not include the Transformation demo, as you download that from Paolos blog:
(Part 1) How To Boost Message Transformations Using the XslCompiledTransform class
(Part 2) How To Boost Message Transformations Using the XslCompiledTransform class Extended
Thank you
Download presentation, demos and scripts
by community-syndication | May 24, 2010 | BizTalk Community Blogs via Syndication
The BizTalk documenter has been update to work in x64 environments: http://biztalkdocumenter.codeplex.com/
by community-syndication | May 24, 2010 | BizTalk Community Blogs via Syndication
In one of our recent publications, we explained the key usage patterns for the ETW-based instrumentation framework which was made available to the community on the BizTalk CAT Best Practices Code Gallery. We have received a number of insightful follow-ups and interesting questions and one of them has triggered the following post.
Scenario
A BizTalk solution running in a production environment manifests a noticeable performance degradation. The operations team investigates the problem and arrives to a conclusion that it might be related to a bottleneck in a custom component used by a number of orchestrations in the BizTalk solution. The operations team would like to collect detailed diagnostic information to assert the validity of the above assumption. They want to be able to understand the component behavior as it relates to functions being invoked, measuring accurate durations of the method calls as well as tracing parameter values being used for execution.
Luckily, the BizTalk solution was fully instrumented using the ETW instrumentation framework by following the technical guidance and best practices from the BizTalk Customer Advisory Team (CAT). The operations team has full access and all the required privileges to be able to enable ETW tracing in the production environment. However, they might face with a new challenge.
Challenge
The complexity of the BizTalk solution in question has led to implementing a number of custom components spreading across the end-to-end architecture. Virtually all custom components have been enriched with relevant tracing and instrumentation events. When enabled, the ETW trace log contains thousands of events generated by these custom components. This makes it time consuming to locate the events produced by the suspected component causing a performance degradation. In addition, many events are being written by multiple components running simultaneously on separate threads and this increases the complexity in performing trace log data analysis.
The operations team would like to streamline the troubleshooting process by capturing only those events which are directly related to the component being investigated. Ideally, they want to be able to have these events written into a separate trace log so that it can also be shared with the developers to get their input. The operations staff opens a dialogue with the development team and finds that there is a solution provided by the developers and is already available in the production codebase.
Solution
When implementing core custom components for the BizTalk solution, the development team has made a decision to support the extra level of granularity and add instrumentation at the individual component level. The advantage of this approach is that trace events produced by individual .NET components can be captured in isolation from the others. This approach opens the opportunity for collecting the detailed behavioral and telemetry data related to a specific component whilst ensuring that any events produced by other custom components will not interfere with the trace log content.
The underlying implementation has rather been very straightforward.
First, the TraceManager class from the Microsoft.BizTalk.CAT.BestPractices.Framework.Instrumentation namespace was enriched with a new public static method:
// Returns an instance of a trace provider for the specified type. This requires that the type supplies its Guid
// which will be used for registering it with the ETW infrastructure.
public static IComponentTraceProvider Create(Type componentType)
{
    GuidAttribute guidAttribute = FrameworkUtility.GetDeclarativeAttribute<GuidAttribute>(componentType);

    if (guidAttribute != default(GuidAttribute))
    {
        return new ComponentTraceProvider(componentType.FullName, new Guid(guidAttribute.Value));
    }
    else
    {
        throw new MissingMemberException(componentType.FullName, typeof(GuidAttribute).FullName);
    }
}
Secondly, every .NET component which required to be individually instrumented was decorated with a Guid attribute available in the System.Runtime.InteropServices namespace.
Next, a new protected readonly static field was added into each non-sealed instrumented .NET component. For sealed classes, the private readonly static modifier was used. This class member is statically initialized with an instance of the framework component implementing the IComponentTraceProvider interface which provides a rich set of tracing and instrumentation methods.
Lastly, all important aspects of the custom components’ behavior were wisely instrumented by calling the relevant tracing methods provided by the above static class member as opposed to using TraceManager.CustomComponent:
Summary
This article was intended to demonstrate the simple and very powerful approach to supporting the code instrumentation in the custom .NET components to be able to capture trace events for individual components. The benefits of this technique lies in the ability to collect only those events which are necessary to perform troubleshooting of specific components in the BizTalk solutions, eliminate “noisy events” which may come from other components, reduce the amount of events in the trace log and greatly reduce the time required to analyze the trace log data.

by community-syndication | May 24, 2010 | BizTalk Community Blogs via Syndication
So hidden within the plethora of announcements about the BizTalk Server 2010 beta launch was a mention of AppFabric integration. The best that I can tell, this has to do with some hooks between BizTalk and Windows Workflow. One of them is pretty darn cool, and I’m going to show it off here. In my […]
by community-syndication | May 24, 2010 | BizTalk Community Blogs via Syndication
They have publicly release the BizTalk Server 2010 Beta and full details about it can be found: www.microsoft.com/biztalk
by community-syndication | May 24, 2010 | BizTalk Community Blogs via Syndication
Hi all
I am just playing around with the new mapper in BizTalk 2010 beta (get it here).
I am happy to announce that the restrictions form the old versions of BizTalk regarding
placement of functoids that have the output from other functoids as input has been
removed.
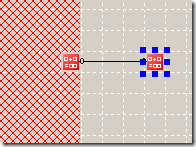
In the “old” days (pre-BizTalk 2010 beta), you would have some of the mapper grid
marked as inaccessible when you dragged a functoid that has the output form another
functoid as input like this:
With BizTalk 2010 Beta you can place the functoids were you like. All links have a
small arrow on them indicating the flow of information and you can therefore have
a setup like this:
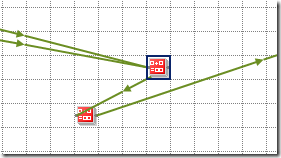
Very nice and more flexible, I think.
—
eliasen
by community-syndication | May 23, 2010 | BizTalk Community Blogs via Syndication
As you know I’m a big fan of Virtual Box being able to run my x64 VMs on my Win7 machine.
Yay!!
So armed with my trusted new Core i7/8 GB laptop – I figured the VMs will be cooking
on this new kit
After installing the lastest VirtualBox (3.2.0) I was away – only to notice the machines
were running like a SLUG! (I actually have a cat that has the nick name ’slug’ and
this machine was slower than her)
After waiting a full 20mins (still booting – ’loading windows files’ etc) my machine
Blue Screened for a millisecond and then rebooted.
So I rolled up my sleeves and started digging – could be the VHD, the bios, the machine,
the 1000 and 1 settings
Firstly I ran a command line command (from under the vbox install dir) –
VBoxManage setextradata VMNAME “VBoxInternal/PDM/HaltOnReset” 1
Finally I got a glimpse of the BSOD and it was an error “STOP7B”
I twigged this is an error of “Inaccessible boot device.” which I’ve had several
times when the SATA drivers couldn’t be loaded by the O/S during boot up.
Solution: (in my case)
I configured the Virtual Box VM with IDE Storage Controllers and NOT SATA
ones for the bootup.(still connected to the same VHDs though)
Win2008/R2 boots up and I’m able to load the SATA drivers in and we’re away.
Back to BizTalk 2010 Beta playing. 🙂

by community-syndication | May 22, 2010 | BizTalk Community Blogs via Syndication
It’s finally arrived. The BizTalk Documenter v3.4 can now be run on 64 bit systems. There are a few other fixes and featuresas well Firstly it now supports SxS scenarios. In the past if you had an orch or a schema with the same name in 2 different assemblies (different versions of the assembly), the […]
by community-syndication | May 22, 2010 | BizTalk Community Blogs via Syndication
Scenario
I came across a nice little one with multi-part maps the other day. I had an orchestration where I needed to combine 4 input messages into one output message like in the below table:
| Input Messages |
Output Messages |
|
Company Details
Member Details
Event Message
Member Search
|
Member Import |
I thought my orchestration was working fine but for some reason when I was trying to send my message it had no content under the root node like below
<ns0:ImportMemberChange xmlns:ns0=”http://—————/”></ns0:ImportMemberChange>
My map is displayed in the below picture.
I knew that the member search message may not have any elements under it but its root element would always exist. The rest of the messages were expected to be fully populated.
I tried a number of different things and testing my map outside of the orchestration it always worked fine.
The Eureka Moment
The eureka moment came when I was looking at the xslt produced by the map. Even though I’d tried swapping the order of the messages in the input of the map you can see in the below picture that the first part of the processing of the message (with the red circle around it) is doing a for-each over the GetCompanyDetailsResult element within the GetCompanyDetailsResponse message.
This is because the processing is driven by the output message format and the first element to output is the OrganisationID which comes from the GetCompanyDetailsResponse message.
At this point I could focus my attention on this message as the xslt shows that if this xpath statement doesn’t return the an element from the GetCompanyDetailsResponse message then the whole body of the output message will not be produced and the output from the map would look like the message I was getting.
<ns0:ImportMemberChange xmlns:ns0=”http://—————/”></ns0:ImportMemberChange>
I was quickly able to prove this in my map test which proved this was a likely candidate for the problem.
I revisited the orchestration focusing on the creation of the GetCompanyDetailsResponse message and there was actually a bug in the orchestration which resulted in the message being incorrectly created, once this was fixed everything worked as expected.
Conclusion
Originally I thought it was a problem with the map itself, and looking online there wasn’t really much in the way of content around troubleshooting for multi-part map problems so I thought I’d write this up.
I guess technically it isn’t a multi-part map problem, but I spend a good couple of hours the other day thinking it was.