by community-syndication | Aug 8, 2010 | BizTalk Community Blogs via Syndication
I will be presenting on:
Building Application that are Cluster Aware and testing them in a Virtual SQL Cluster with Hyper-V and Storage Server 2008
Today we are building more and more applications that run in a highly available environment, with SQL server this is typically a SQL Server cluster, but very few developers or developer organization have access to a SQL Server Cluster for development. Bill Chesnut will be talking about both the consideration you need to make in your code when connecting to a SQL Server Cluster and how to build a SQL Server Cluster with Microsoft Hyper-V server and Windows 2008 Storage Server and will demonstrate this environment running on a 8GB laptop.
by community-syndication | Aug 6, 2010 | BizTalk Community Blogs via Syndication
Nice project put together by one of our MVPs. He’s used the StreamInsight CEP tool to monitor data from SQL Profiler.
http://www.sqlis.com/sqlis/post/Streaming-Profiler-Data-Through-StreamInsight.aspx
Cheers
Peter
by community-syndication | Aug 6, 2010 | BizTalk Community Blogs via Syndication
Are you using WF/WCF in .NET 4?
Would you like to help us improve WF/WCF in the next release?
Would you mind spending an hour or two in a conference call talking about what you like, don’t like and need help with?
We are looking for customers who would be willing to share their stories with us. If you want to participate in this research, please use the Email Blog Author link to let us know.
by community-syndication | Aug 6, 2010 | BizTalk Community Blogs via Syndication
When calling a query multiple times with Entity Framework the recommended approach is to use compiled LINQ queries. Compiling a query results in a performance hit the first time you use the query but subsequent calls execute much faster. The CompiledQuery class has functionality to compile and assist in caching the resulting database command from a query.
An example of a compiled query is show below. The query returns a list of Customers from the Northwinds sample database whose CustomerID starts with a specific string that is passed in as a parameter:
static Func<NorthwindEntities, string, IQueryable<Customer>> compiledCustQuery =
   CompiledQuery.Compile((NorthwindEntities ctx, string start) =>
   (from c in ctx.Customers
    where c.CustomerID.StartsWith(start)
    select c));
A few weeks ago while working with a partner on EF performance optimization, we ran into an interesting case where the EF code segment was executing much slower than expected. The Visual Studio Profiler showed that the code was spending an inordinate amount of time when executing a compiled query. Digging into the code showed that one particular operation on the compiled query was causing it to recompile every time it was executed. The code was checking to see if the result set returned any records. There are multiple ways to accomplish this. A common way is to use .Count()!=0 or Any(). In this case the compiled query returned an IQueryable. Calling Count() or Any() was causing the query to re-compile.
I wrote a small application to duplicate this issue using the Northwinds database. The code executes the compiled query to see if any records are returned. If there are records in the result set, it executes the query again and returns all the rows (the ToList().Count() makes sure all results from the second query are materialized in memory). Below is a snippet of code showing the two queries:
var qryAnyCust = compiledCustQuery(ctx, "C");

if (qryAnyCust.Any())
{
    var qryCust = compiledCustQuery(ctx, "C");
    qryCust.ToList().Count();
}
Running the Visual Studio profiler shows the following Hot Path:
Over 83.33% of the time is spent executing the System.Linq.Queryable.Any() class and only 16.67% of the time was spent actually executing the query. Executing the sample application yielded an execution time of approximately 9ms.
Next the code was modified to use a second version of the compiled query that contained the .Any() method in the query and returned a Boolean instead of an IQueryable. Below is the second query:
static Func<NorthwindEntities, string, bool> compiledAnyCustQuery =
   CompiledQuery.Compile((NorthwindEntities ctx, string start) =>
   (from c in ctx.Customers
    where c.CustomerID.StartsWith(start)
    select c).Any());
The query execution code was changed to call the above query to check if any records would be returned and then the query from the previous example to retrieve the actual records. This code is shown below:
if (compiledAnyCustQuery(ctx, "C"))
{
    var qryCust = compiledCustQuery(ctx, "C");
    qryCust.ToList().Count();
}
Looking at the profiler output of the above code shows that the call to Any() is no longer the bottleneck and that actually invoking the query now takes the majority of the time as expected:
Executing this code displayed much better performance. The test executed in only 6ms almost a 33% performance increase from a small change to a single query.
An alternative way to prevent re-compilation of the compiled query is to return an IEnumerable instead of IQueryable for the cached query. Using IEnumerable causes the query data to be returned from the server and then allows for evaluation and further refinement of the results set locally. For instance, executing a Count() on an IEnumerable from a query returns the number or records contained in the in-memory result set.
Note: Using IEnumerable will cause all of the query results data to be transferred from the server to the client. This can be a drain on memory and performance on the client if the query returns a large number of records. This might not be the best approach if you have large result sets and simply need to get record counts.
Below is the code from the sample application which returns the compiled query as an IEnumerable instead of IQueryable:
static Func<NorthwindEntities, string, IEnumerable<Customer>> compiledEnumCustQuery =
   CompiledQuery.Compile((NorthwindEntities ctx, string start) =>
   (from c in ctx.Customers
    where c.CustomerID.StartsWith(start)
    select c));
A third version of the query execution, is show below, that checks to see if any records would be returned and then the query from the previous example to retrieve the actual records:
if (qryEnumAnyCust.Any())
{
    var qryCust = compiledCustQuery(ctx, "C");
    qryCust.ToList().Count();
}
Executing the above code displayed similar performance to the previous test that used the compiled queries containing the Any(). The test executed in only 6.7ms which was much better than the original code. Profiling the IEnumerable test shows that now most of the execution time is spent in the Any() method on the IEnumerable which should execute quickly because the values are in memory:
In the case of our partner, changing their code to use compiled queries to contain the Any() and return a Boolean boosted their performance 450% because their code checked if queries returned results in multiple places.
Query recompile is not limited to Any() or Count() operations. It can happen with any LINQ operator that is applied on top of a compiled query. So be on the lookout for query re-compilation in your code. It can unknowingly impact performance. In a future post I will cover in more detail the use the Visual Studio Profiler to uncover bottlenecks in the Entity Framework.
Author: Dana Kaufman
Reviewers: Jaime Alva Bravo, Daniel Simmons, Diego Vega, Peter Scharlock
by community-syndication | Aug 6, 2010 | BizTalk Community Blogs via Syndication
A previous post discussed potential issues with Compiled Query recompiles. The cause of the recompile issues were actually uncovered by using the Visual Studio 2010 Profiler. This blog will cover how the Profiler can be used to discover performance issues in the Entity Framework. The sample code from the previous blog will be used as the code to be profiled.
Basically the code executes a compiled query against the Northwind database via the Entity Framework. The LINQ query (using LINQ to Entity) returns all Customers whose CustomerID starts with “C”. The code first executes the query using a .Any() operator to see if there will be any records returned and if so executes the query and returns a list of records which we then take the count of to make sure all of the records are inspected. The queries are executed 100 times. The sample is in a solution named EFTest which you can download here.
Executing this class returns the following results:
Notice the first query took 1144ms which is significantly longer than the follow on queries. This is due to the warm-up that happens in the Entity Framework when an application starts. The first time an ObjectContext is used, EF opens up a connection to SQL Server and loads up the metadata for the EF model. This metadata includes the mappings between the physical and conceptual models and any pre-compiled view SQL.
Now let’s dig into the performance of the LINQ queries. The Visual Studio Profiler can be used to isolate potential performance issues. The Profiler can be enabled by selecting “Analyze | Launch Performance Wizard…” from the Visual Studio main menu. This launches the Performance Wizard which is shown below:
Take the default and hit “Next”, take the default for the target application, press “Next” and then uncheck the option “Launch profiling after the wizard finishes”. Now press “Finish” which will close the wizard.
The Performance Explorer should be shown in Visual Studio:
Right click on the EFTestAny project in the Performance Explorer and select “Properties”. Select “Sampling” from the properties list and change the Sampling interval to “50000”. This will make the profile take executions samples at a faster rate which increases accuracy when profiling such a small amount of code. Click “Ok” to close the property page.
Before we start the profiling, one more task needs to be completed. Remember the first query took significantly longer than any of the subsequent queries due to opening the connection to SQL Server and EF metadata loading? We need to factor the warm-up out of the performance measurements. This can be done by making marks in the data collected by the profiler and then filtering the results on those marks. The Profiler’s API can be used to insert Data marks via code.
To use the Profiler API, a Profiler assembly needs to be added as a reference to the project. Right click on “References” in the Solution Explorer and pick “Add Reference…”. Use the Browse tab and select c:\Program Files\Microsoft Visual Studio 10.0\Team Tools\Performance Tools\Microsoft.VisualStudio.Profiler.dll
Next the DataCollection.CommentMarkProfile() method can be used from the code. This method adds a numeric mark and comment into the performance data being collected by the profiler. The method is passed a MarkId which is an integer and helps in ordering the marks and a description string. The CommentMarkProfile() call needs to happen after the first round of queries to get past the warm-up so that the cost can be excluded from the analysis. To do that, the following code is added after the results are printed for each pass (note the if statement makes sure the mark only happens after the first iteration):
if (i == 0) //Mark profile data after first pass as it is warmup
{
    //Mark profiling data
    DataCollection.CommentMarkProfile(100, "After Warmup - Any ON compiled query");
}
Finally, the CommentMarkProfile() operation is called after the for loop completes before the code pauses for a key press. The code for the second mark is shown below:
DataCollection.CommentMarkProfile(110, "Queries Done");

The complete code with the calls to the profiler API is shown below:
1: using System;
2: using System.Collections.Generic;
3: using System.Linq;
4: using System.Text;
5: using System.Data.Objects;
6: using System.Data.Common;
7: using System.Data.EntityClient;
8: using System.Data;
9: using Microsoft.VisualStudio.Profiler;
10:
11: namespace EFAnyTest
12: {
13: class Program
14: {
15:
16: static Func<NorthwindEntities, string, IQueryable<Customer>> compiledCustQuery =
17: CompiledQuery.Compile((NorthwindEntities ctx, string start) =>
18: (from c in ctx.Customers
19: where c.CustomerID.StartsWith(start)
20: select c));
21:
22: static void Main(string[] args)
23: {
24: System.Diagnostics.Stopwatch sw = new System.Diagnostics.Stopwatch();
25: double totalTime = 0.0;
26: int iterations = 0;
27: int TEST_RUNS = 100;
28:
29: NorthwindEntities ctx = new NorthwindEntities();
30: {
31: Console.Out.WriteLine("Any ON compiled query");
32: for (int i = 0; i < TEST_RUNS; i++)
33: {
34: sw.Start();
35: var qryAnyCust = compiledCustQuery(ctx, "C");
36:
37: if (qryAnyCust.Any())
38: {
39: var qryCust = compiledCustQuery(ctx, "C");
40: Console.Out.Write("{0} Cust records, ",qryCust.ToList().Count());
41: }
42: sw.Stop();
43: totalTime += sw.Elapsed.TotalMilliseconds;
44: iterations++;
45: Console.Out.WriteLine("iteration = {0} Last:{1}ms, Average:{2}ms", i, sw.Elapsed.TotalMilliseconds, (totalTime / (double)iterations));
46: if (i == 0) //Mark profile data after first pass as it is warmup
47: {
48: //Mark profiling data
49: DataCollection.CommentMarkProfile(100, "After Warmup - Any ON compiled query");
50: }
51: sw.Reset();
52: }
53: Console.Out.WriteLine("");
54: }
55: DataCollection.CommentMarkProfile(110, "Queries Done");
56: Console.WriteLine("Press and key to continue....");
57: Console.Read();
58: }
59: }
60: }
Now it’s time to profile the application. In the Performance Explorer, click on the icon for “Launch with Profiling”.
Note: If you see an error message about not being able to open the profiler driver, select “Yes” to upgrade the credential of the current user.
The application will execute and then press the <Enter> key to close the application. Visual Studio will churn for a few minutes and then show the Profile report, but were not ready to study it just yet. These results still contain the warm-up code profile data which includes the loading of the metadata and connecting to the SQL server. To look only at the LINQ query execution, change the “Current View” of the report to “Marks” via the drop down list. A list of profile data marks will be shown including the ones that were set in the code. Highlight all of the marks between the two custom code marks (100 and 110), right-click and select “Add Filter on Marks”:
Now press the “Execute Filter” button which is the second one to the right of the Current View dropdown list. This will filter the profile data and only include data between the marks we inserted via code and then it will change the current view back to the Summary view. Scrolling down on the refreshed report shows the code HotPath(the section of the code that took the majority of the time executing):
As shown above, the call to System.Linq.Queryable.Any() is shown as the most expensive call. This call should be fast because it should simply check if any records are return in the result set so we need to drill in further to find the root cause.
To do this an additional option needs to be changed. Select “Debug | Options and Settings…” from the Visual Studio main menu. Click on “Performance Tools” and uncheck the “Enable Just My Code for profiler reports (sampling)” in the “Just My Code” section and press the “Ok” button. Now re-run the profiler to generate a second report and then filter that report on our code marks as we did above.
Now the report shows a lot more detail. The System.Data.Query.PlanCompiler class is being called even though the query should have already been compiled the first time we accessed it during our warm-up pass. As discussed in the previous blog entry, the call to the Any() method on the IQueriable is causing the query to re-compile each time which is an expensive operation.
CONCLUSION
As you can see, the Visual Studio 2010 Profiler can be a powerful tool to track down potential bottlenecks in your Entity Framework code or other parts of your application. And using the Profiler APIs, provides an easy way to hone in on performance characteristics of specific parts of an application. So go forth and profile that code, you never know what you will uncover.
Author: Dana Kaufman
Reviewers: Jaime Alva Bravo, Daniel Simmons, Paolo Salvatori
by community-syndication | Aug 6, 2010 | BizTalk Community Blogs via Syndication
Check out the Epicor Case Study that was recently published by one of our partners. Epicor is a global software company that creates enterprise resource planning (ERP) solutions for manufacturing firms and other customers.
They have been able to leverage Visual Studio 2010 and ADO.NET Entity Framework 4 to ease development and reduce SQL Server requests by 90 percent. Also, Epicor has a very large data model which the new version of Entity Framework was able to support.
An excerpt from the case study:
Because the ADO.NET Entity Framework 4 can support large data model sizes, Epicor could use the technology to create Epicor 9.05. “The earlier version of the Entity Framework did not handle our data model size very well, and we experienced delays in testing,” says Johnson. “Those problems have all been solved with the ADO.NET Entity Framework 4.
Authored by: Dana Kaufman
by community-syndication | Aug 6, 2010 | BizTalk Community Blogs via Syndication
Introduction
Working with customer’s solutions, we often have to track down potential performance issues or uncover areas for improvement. One of the techniques is to try and measure the relative performance gained using the different configurations or features (likely in a staging/testing environment). When working with Entity Framework 4 one of the potential optimizations is to use precompiled views where Entity Framework query views are pre-built and compiled into the application; which otherwise, the entity framework would have to generate on the fly (extra resources being required). The following are some useful references on precompiled views:
· MSDN – How to: Pre-Generate Views to Improve Query Performance (Entity Framework)
· EF Team Blog – How to use a T4 template for View Generation
This sample application shows one possible way to test potential performance gains and resource utilization when using pre-generated views by providing a performance comparison between runs with precompiled views and without. You can download the sample code here.
When isolating performance, a good idea is to focus on a very narrow piece, preferable a section that gets the most use. Using Visual Studio Profiler to find the bottleneck can point to the slowest query. Then by leveraging the analysis techniques discussed below, the performance gains can be observed/studied.
Note: that the sample for this article leverages the T4 template for View Generation mentioned in the EF Team Blog link above.
Analyzing the Sample
The database – The complete sample code (solution named: PerfSample), executes a query against a local database named PerfSample. To create it, the 2 SQL scripts found at the root of the downloadable ZIP file need to be executed against an empty Database. Open the first one, named EFModelGen.SQL, with Microsoft SQL Server Management Studio and Execute it. This will not create the entities yet but instead, it will generate the required SQL script. Copy and paste the results into a new query and run it against your empty database, this will create 200 empty entities. To create records for the entities Type1 and Type2 run the second script, named PopulateData.sql. It contains 2 variables: Type1RecordCount and oneToMany. The first indicates the number of records to be created in entity Type1, and since entities Type1 and Type2 have one-to-many relationship, the second variable indicates how many Type2 records will be created per each Type1 record.
The sample executes a LINQ select statement with a join against the Type1 and Type2 entities. For the purpose of testing precompiled views, the results need to be materialized (turning data records into “real” objects) hence, the sample runs ToList().Count() against the query results, the simple code is as follows.
   var type1WithType2 = from t1 in context.Type1
                        join t2 in context.Type2
                        on t1.Type1Id equals t2.Type1_Type1Id
                           select new
                           { t1.Type1_Col30, t2.Type2_Col30 };
   type1WithType2.ToList().Count();
Once the query is identified, execution time (performance) and memory usage (resource) is recorded. To measure time, the StopWatch class is used. For recording memory usage, a memory reading is collected into long integers before and after the query is executed and then the numbers are subtracted, which will provide only the memory used by the query. To look at Managed memory (memory used only by the framework), first the garbage collector (GC) is forced to run, that way obtaining a clearer read of the memory being used by the framework. Note that this is purposely done before the stopwatch starts since the GetTotalMemory (true) method may take a little while to return while the GC is run (which can be unpredictably long or short).
   startManageMemoryBytes = GC.GetTotalMemory(true); //Force GC
   stopWatch.Start();

      //[Query/code to analyze]

   stopWatch.Stop();
   endManageMemoryBytes = GC.GetTotalMemory(false);
The program is compiled with the Visual Studio and to streamline things a bit more, it is built in Release mode, the SQL server is local to the machine (minimizing network delays) and its affinity set to CPU1 (minimizing CPU context switching between SQL and the application), tests were executed on a dual-proc machine.
The query above is executed 3 times (call to QueryToTest(context)), in order to collect more even results.
Performing the tests
The sample has to first be prepared to either run in precompiled mode or in standard mode. To setup a precompiled run, make sure the PerfSample.view.tt is included in the solution and that it has a corresponding PerfSample.views.cs file (if the .cs file is missing then it can be generated by doing a right-click on the T4 template PerfSample.view.tt and choosing ‘Run Custom Tool’) and then clean and rebuilding the solution. Likewise, to setup a run without precompiled views, exclude the T4 template PerfSample.view.tt from the project (right-click and choose to ‘Exclude From Project’) then clean and rebuild the solution.
The sample program is a simple console application that is executed via a small DOS batch file. The batch file runs the program 3 times and sends the info to the console; it is named runtest.bat and is found under …/bin/release directory. To make it easier to analyze, the results are piped to a text file in the same directory.
The following DOS commands are executed to collect the respective results, after the proper changes are made (as explained above)
   Runtests > WithPreCompiledViews.txt
   Runtests > WithoutPreCompiledViews.txt
NOTE: To append results into an existing file, replace the single less-than symbol (“>”) with the double pipe command “>>”
The test batch file is run multiple times to get a good sample of performance times.
The Results
|
without precompiled views
|
with precompiled views
|
|
..\bin\Release>call PerfSample
|Time MilSec |Manage Bytes |
|————————–|
| 8,009 | 69,174,356 |
| 810 | 53,299,352 |
| 815 | 53,299,388 |
..\bin\Release>call PerfSample
|Time MilSec |Manage Bytes |
|————————–|
| 7,629 | 69,169,948 |
| 847 | 53,303,016 |
| 858 | 53,305,532 |
..\bin\Release>call PerfSample
|Time MilSec |Manage Bytes |
|————————–|
| 8,057 | 68,123,116 |
| 800 | 53,303,064 |
| 794 | 53,304,332 |
|
..\bin\Release>call PerfSample
|Time MilSec |Manage Bytes |
|————————–|
| 3,287 | 73,282,032 |
| 813 | 53,306,136 |
| 897 | 53,301,052 |
..\bin\Release>call PerfSample
|Time MilSec |Manage Bytes |
|————————–|
| 3,269 | 73,283,292 |
| 805 | 53,299,816 |
| 837 | 53,305,532 |
..\bin\Release>call PerfSample
|Time MilSec |Manage Bytes |
|————————–|
| 3,257 | 73,283,548 |
| 815 | 53,306,776 |
| 806 | 53,299,004 |
|
This is well in line with the expected behavior of precompiled views. The test runs made without precompiled views have to first generate the set of views to access the database so, it is expected that their elapsed time will be greater. From the results above, the time lapse for precompiled views is over twice as fast but not for subsequent runs since the view is already generated and therefore reused.
In the same manner, precompiled views should give us a lower memory footprint. For managed memory, the first run uses about 5~7% less memory and subsequent are in both cases similar. Also, in both cases, the drop in memory usage is likely explained by the fact that unused memory is being reclaimed by the system.
As a way to further explore the behavior of pre-generated views, the sample has one line of code commented-out, this is the method PreRun(context) which does a select count of all the members in both the Products and the TransactionHistory entities, the same entities used in the query. And it does this by reusing the ObjectContext instance (no statistics are recorded). Running the test with this method uncommented, will result in very similar time lapses and memory usage for both the precompiled and not-precompiled executions. This is because the Query from the QueryToTest(context) method is reusing the already generated views from PreRun(context) since they share the same ObjectContext.
Conclusion
This empirically demonstrates the performance improvement offered by precompiled views, by pre-constructing the Entity Framework views, the first run of the query was about 2.4 times quicker and there also was an improvement in memory usage. Since the first execution of the query is where the performance gain is, leveraging pre-generated views in at least two cases will be of significant value: the warm up of a system and the execution of infrequently run queries. The use of less memory is also advantageous and is due to no longer having the overhead of keeping and creating the views.
Results are likely going to vary depending on your solution, particularly the model size and the amount of records being queried, so the sample should be tailored to match, as much as possible, your particular solution, however gains should be noticeable.
Authored by: Jaime Alva Bravo
by community-syndication | Aug 6, 2010 | BizTalk Community Blogs via Syndication
[Source: http://geekswithblogs.net/EltonStoneman]
In my previous post, Cloud Services and Command-Query Separation: Part 2, I walked through a sample Command-Query Separated service bus solution using readily available cloud services for communication. In this one, I’ll look at some of the implications of shifting systems integration to the cloud, compared to an on-premise ESB. The focus here is mainly on Amazon Web Services, but I’ll cover Azure with a dedicated sample project.
Cost & Non-Functional Requirements
If an ESB is core to your system landscape, it needs to be reliable and scalable. With a BizTalk-based solution you get this built-in with the architecture, but it doesn’t come cheaply. For a minimally-resilient enterprise-grade solution you’ll need at least two BizTalk servers in a group running against a SQL Server cluster on two nodes; for DR you’d need the same again in a separate data centre. Buying all the hardware and licenses could take you to %u00a3100K, not allowing for ongoing operating, maintenance and site costs.
In comparison the cloud solution is likely to be far more reliable at a far lower cost. Both AWS and Azure have multiple data centres around the globe, with redundancy levels you couldn’t realistically achieve in a private data centre. Scalability is a given for the queuing and storage services – you just use them as much as you need, and the service scales to cope. If you’re hosting the service provider nodes in the cloud too – either as a Windows Azure service, or within an Amazon EC2 instance – then they can be configured to automatically scale just as easily.
Cost-wise, there’s no comparison. For the AWS services used in the sample, the “free tier” means if you’re sending up to 100,000 messages a month on SQS with up to 1Gb total payload, and using less than 1Gb of storage on SimpleDB then there are no charges at all. The next level up incurs monthly costs (at time of writing) of around %u00a30.20 for an additional 100,000 messages with 1Gb payload, and %u00a30.30 per Gb of data in SimpleDB.
With the roughest calculation, you could push 10,000,000 messages through SQS, and use 100Gb storage on SimpleDB EVERY MONTH FOR 160 YEARS before approaching %u00a3100K in costs. Of course the BizTalk and cloud solutions are not comparable in terms of the functionality they offer, but for certain scenarios they can be compared as they may be used in similar ways.
Security and Interoperability
Cloud services are based on interoperable standards – typically SOAP and REST – and are published on publicly-available endpoints. Azure has clever tricks to navigate firewalls for WCF bindings, and AWS uses standard HTTPS endpoints. To make an internal service publicly available you need to configure DMZs, domain names and firewalls, and sign up for ongoing vigilance against attack.
In AWS, transport-level security on the endpoints is supported by message-level security, with every request containing a signature built using the sender’s secret key to verify that the content has not been tampered with. AWS also lets you secure or deny services to a specific list of AWS user accounts, so you can limit use of your queues and data stores to business partners. It’s fairly simple to interact with AWS services in an iPhone app.
On-premise gives you more options for tailoring your solution. For example, you may have a secure, interoperable entry point to the ESB, but between ESB and service providers the communication is private so you could standardise on efficient WCF over TCP/IP, using IPSec to prevent any machines other than the ESB nodes accessing the service providers. Calling services with an iPad is likely to be more of a challenge.
Time to Market
Or Time to Release, depending on your scenario. Starting from zero, you can be up and running with a simple cloud service bus with less than a day’s effort. Assuming you’re exposing existing functionality then you could conceivably have a pilot project deployed for testing in the cloud within a week. Adding new services is as simple as adding a fa%u00e7ade over existing code, to act as a handler when a known type of message request is received. Business partners can use your test environment with no special effort, and when you go live, decommissioning the test environment is just a case of deleting the queues and data stores with a few API calls.
On-premise, all the delivery times go up. Development, deployment and testing of a basic ESB solution – even if you use BizTalk and the ESB Toolkit as a starting point – is likely to be closer to a month than a week. The contract-first nature of BizTalk means adding a new service or changing an existing one requires deployment of ESB artifacts as well as the new service provider – this not a negative, but it does add to the effort required.
Performance
In terms of latency, the cloud solution is never going to perform as well as on-premise. Pushing an ESB request and response through the BizTalk message box may add 0.5 seconds of latency, but calling out to the web is going to be double or quadruple that. That network latency in fetching a large query response could make the solution unworkable for end clients, compared to the LAN option.
The reverse may be true for globalised organisations which have their data centres in one region. While the on-premise solution needs to negotiate the WAN, the cloud solution has the option to push out to edge nodes, with independent queues and data stores residing in the nearest region to the consumer. In this scenario the cloud solution is likely to have the lower latency.
In terms of processor power and scaling up to meet demand, the cloud solution can provide that more-or-less instantly, with no service disruption and with a linear cost increase. Scaling an on-premise solution will always take longer to commission, for scaling up there will be downtime for the upgraded nodes and scaling out will mean cost spikes.
Limitations
In the cloud world, you currently have to live with limitations that will seriously affect your design. SQS allows maximum message sizes of 8Kb, which is entirely tiny, but should be a size you can cope with for service requests and responses. You may have to give more consideration to serialization than you normally would, using JSON or Protocol Buffers rather than bloated XML.
The BizTalk solution will happily deal with XML messages in the hundreds of megabytes, but to do so efficiently it needs to be tuned to favour large messages over throughput.
Governance
This is where the cloud option does really poorly. One of the key advantages of BizTalk and the ESB Toolkit is that I can navigate UDDI and get a list of all available services and their endpoints; then I can navigate the endpoint WSDL and see what the service contract is, or I can look up the XSD in BizTalk. The service and contract lookups can be wrapped into a custom tool, giving you a real-time ESB navigator which is fairly trivial to build.
In the sample cloud service bus there’s no separate catalogue of services or contracts. Services exist as long as there is a subscriber for a particular type of message; request and response contracts may be explicit in .NET classes, but across the bus they’re just strings of text with no option to validate them. For a robust cloud solution, governance needs to be in from the start, which is likely to mean some custom operations services which can be queried to get that service catalogue and contracts.
by community-syndication | Aug 6, 2010 | BizTalk Community Blogs via Syndication
Hi all
Today I exported an MSI file from my development machine and wanted to import the
MSI file on our test environment.
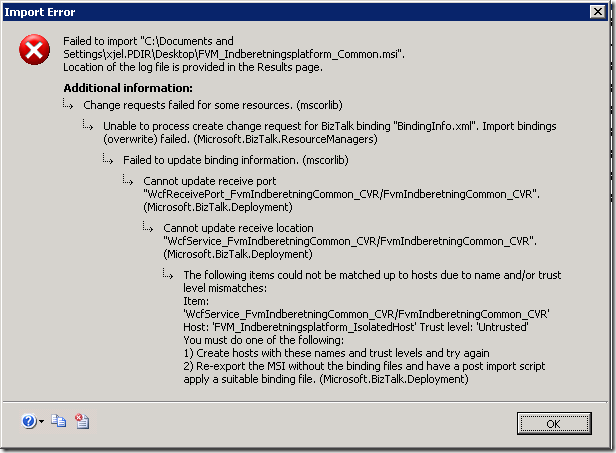
I got this error, though:

Change requests failed for some resources. (mscorlib)
Unable to process create change request for BizTalk binding "BindingInfo.xml".
Import bindings (overwrite) failed. (Microsoft.BizTalk.ResourceManagers)
Failed to update binding information. (mscorlib)
Cannot update receive port "WcfReceivePort_FvmIndberetningCommon_CVR/FvmIndberetningCommon_CVR".
(Microsoft.BizTalk.Deployment)
Cannot update receive location "WcfService_FvmIndberetningCommon_CVR/FvmIndberetningCommon_CVR".
(Microsoft.BizTalk.Deployment)
The following items could not be matched up to hosts due to name and/or trust level
mismatches:
Item: ‘WcfService_FvmIndberetningCommon_CVR/FvmIndberetningCommon_CVR’ Host: ‘FVM_Indberetningsplatform_IsolatedHost’
Trust level: ‘Untrusted’
You must do one of the following:
1) Create hosts with these names and trust levels and try again
2) Re-export the MSI without the binding files and have a post import script apply
a suitable binding file. (Microsoft.BizTalk.Deployment)
Now, the error message is pretty easy to understand. What had me baffled was, that
the host exists and it IS untrusted. So there is no mismatch and the two ideas as
to what to fix don’t seem to apply to my situation.
It turned out that the issue was that after creating the needed host and host instances,
I had forgotten to add the necessary Receive Hander on the appropriate adapter for
the receive location. But the error message doesn’t say anything about that – it just
says that I need to create the host with the right trust level.
So, this post is just to let you know that there is another reason for the error message
than what the error message states.
—
eliasen
by community-syndication | Aug 6, 2010 | BizTalk Community Blogs via Syndication
Looking for BizTalk Server 2009 Training in Europe? QuickLearn’s partner www.Bouvet.no has invited John Callaway to teach several BizTalk classes in the remainder of 2010.
John Callaway will be teaching:
- September 6th – BizTalk Developer Immersion
- October 11th – BizTalk Developer Deep Dive
- November 29th – BizTalk Developer Immersion
- December 6th -BizTalk Expert Series: ESB 2.0
View all of QuickLearn’s BizTalk Server 2009 Training
