Do you feel difficult to keep up to date on all the frequent updates and announcements in the Microsoft Integration platform?
Integration weekly update can be your solution. It’s a weekly update on the topics related to Integration – enterprise integration, robust & scalable messaging capabilities and Citizen Integration capabilities empowered by Microsoft platform to deliver value to the business.
If you want to receive these updates weekly, then don’t forget to Subscribe!
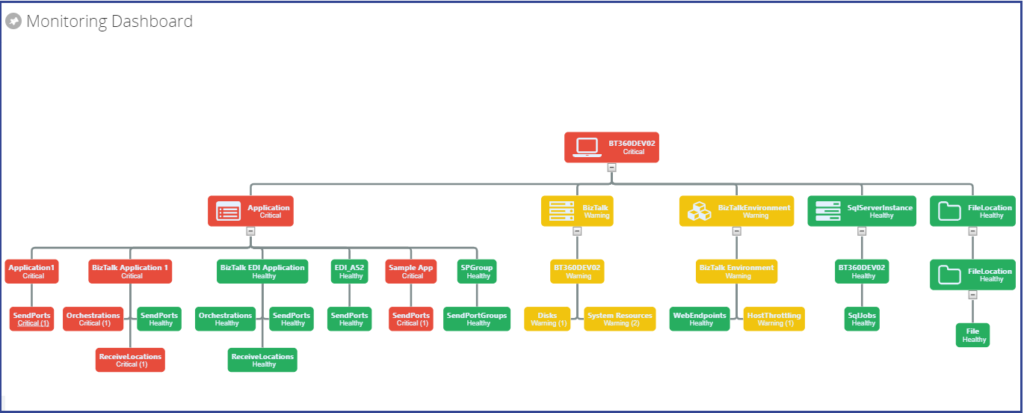
BizTalk360 comes with out of box capabilities to monitor BizTalk Artifacts, BizTalk Environment, Queues (IBM, Azure Service Bus and MSMQ), File Location (File, FTP and SFTP) and so on. The Monitoring Dashboard represents the Monitoring Status in a nice graphical chart view. Different set of users like BizTalk Administrators, Operators, Technical members and Business users are using the monitoring features for their day to day activities. Users create multiple alarms to suffice their needs to monitor the health of their BizTalk environment.
While users are monitoring the multiple alarms, they must keep an eye on multiple dashboards. It is a cumbersome task if a user takes care of more than two Alarms. Based on this requirement, few customers have requested for consolidate view of alarms. In this article, we are going through the process of how you can create a consolidated view of multiple alarms using Custom Widgets.
Scenarios
BizTalk360 users are configuring the alarms based on their business vertical or alignment to their process. There have been different patterns in alarm configurations. We can see some of the commonly used patterns;
Integration-based alarm configuration
Configuring BizTalk Artifacts, Web Endpoints, Queues, File Location etc. of integration in an alarm.
Role-based alarm configuration
BizTalk Administrators will look after infrastructure settings like Disk, System Resources, Host Instances and configure in an alarm BizTalk Operators can configure BizTalk Artifacts and other entities in a single alarm
Entity-based alarm configuration
For instance, users can configure all their Queues (IBM/Azure Service Bus) in an alarm. Similarly, they can configure Web Endpoints, Infrastructure (Disks, System Resources) in separate alarms.
Based on the above patterns, Role-based and Entity-based alarms can have a single view of multiple alarms in which you can monitor all the entities. When you follow the Integration-based alarm pattern, then entities like Application Artifacts, Azure Service Queues and BizTalk Server health activities are in different alarms.
Many organizations follow the Integration pattern by grouping all the related artefacts in an alarm. In this scenario, users (BizTalk Operators/BizTalk Technician) must monitor multiple alarms. For Instance, BizTalk Operators looking after BizTalk Artifacts or Developers responsible to monitor Azure Service Bus Queues will have to monitor the multiple alarms. Let’s see how to overcome this challenge by using custom widgets to group multiple alarms.
Consolidated Dashboard
The Monitoring Dashboard is one of the most used features among the users to monitor BizTalk Environments and Artifacts in BizTalk360. An enriched monitoring capability while using Custom widgets to group the multiple alarms to get a single view based on business or team members role.
Custom Widgets are a powerful feature in BizTalk360, as such widgets will provide the opportunity to meet their business scenarios. Many customers adopted Custom Widgets to provide solutions to end users.
Following are a few illustrated scenarios of grouping alarms when it is configured based on integrations
Azure Service Bus Queues
BizTalk Application Artifacts
BizTalk Environment Health
In this article we take one of these scenarios, to show how users can achieve the grouping alarms using Custom Widgets
Azure Service Bus Queues
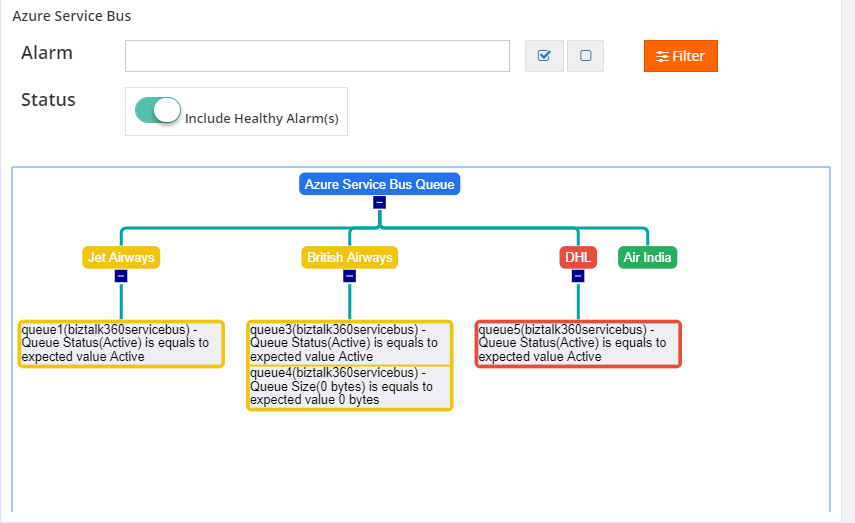
Custom Widgets used BizTalk360 Secure SQL Query API’s to fetch all Azure Service Bus Queues Monitoring Status from BizTalk360 Database. A user can select the filter with different alarms they want to group.
By default, the user can see only the unhealthy queues in an environment. If they set the Enable Healthy Queue option, they will be able to view all queues in the tree nodes. The Azure Service Bus Queues Custom Widget will fetch the information from Secure SQL Query with a refresh interval which is configured in the script of the custom widget.
Follow the below steps to achieve the Custom Widget’s script;
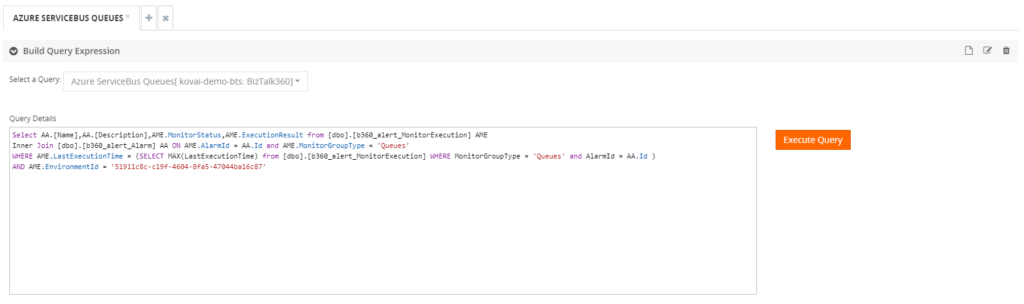
1. Secure SQL Query
Create the Secure SQL Query to fetch the monitoring status of Azure Service Bus Queues in the environment. To know more about how you can execute Secure SQL Queries using custom widgets, refer to this article.
2. Custom Widget Script
Create the initial variables, Place holders and SQL Query to call the BizTalk360 API method in the Custom Widget’s script
// BEGIN User variables
azureQueueRefresh = 20;
username = "`username_812414`";
password = "`password_701422`";
environmentId = "`productionenvid_189308`";
queryId = "8eea2771-10a7-44c6-8709-a597687434cf";
queryName = "Azure ServiceBus Queues";
sqlInstance = "kovai-bts";
database = "BizTalk360";
sqlQueryForAzureGraph = "Select AA.Id,AA.[Name],AME.MonitorStatus,AME.ExecutionResult from [dbo].[b360_alert_MonitorExecution] AME Inner Join[dbo].[b360_alert_Alarm] AA ON AME.AlarmId = AA.Id and AME.MonitorGroupType = 'Queues' WHERE AME.LastExecutionTime = (SELECT MAX(LastExecutionTime) from [dbo].[b360_alert_MonitorExecution] WHERE MonitorGroupType = 'Queues' and AA.IsAlertDisabled='false' and AlarmId = AA.Id and LastExecutionTime >= DATEADD(MINUTE,-60,GETUTCDATE())) AND AME.EnvironmentId ='`productionenvid_189308`'"; // The SQL Query which needs to be executed from the custom Widget
bt360server = "biztalk360.westus.cloudapp.azure.com"; // Name of the BizTalk360 server (needed to do an API call to execute the SQL query
//Mention the created alarm details and the respective partner name to display in the graph.
AlarmDetails = [
{ AlarmName: "Threshold-1", PartnerName: "Air India" },
{ AlarmName: "Threshold-2", PartnerName: "British Airways" },
{ AlarmName: "Threshold-3", PartnerName: "DHL" },
{ AlarmName: "BizTalk360 Default Alarm1", PartnerName: "Jet Airways" }
];
// END User variables
3. GO JS Framework
BizTalk360 uses the GO JS Framework- Organization chart to represent the monitoring hierarchical view in the UI. It will display the organization chart structure as Azure Service Bus Queue node as a root node, Integration friendly name as second level node and Queue threshold violation details as a child node. You can control the nodes expand/collapse capability of through the custom widget code.
4. Filter Options
Users can able to filter the data based on the selected alarms or the option to show healthy queues. By default, users can see only unhealthy Azure Service Bus Queues. Similarly, other scenarios are implemented through custom widgets. To get the full source code of the Custom widgets you can download it from our GitHub Project.
Summary
We hope this article is useful in grouping the multiple alarms into a single view in an environment. This will bring you more control over the custom development you may want to achieve.
A few weeks ago I had the great privilege of presenting a 60 minute breakout session at Microsoft Ignite | The Tour in Sydney. It was thrilling to have over 200 people registered to see my topic “Seamless Deployments with Azure Service Fabric”, especially in the massive Convention Centre.
In the session I demonstrated the self-healing capabilities of Service Fabric by introducing a bug in the code and then attempting a rolling upgrade. It was impressive to see how Service Fabric detected the bug after the first node was upgraded and then immediately started rolling it back.
As you can imagine, it took a fair amount of practice to get the demo smooth and functioning within the tight time limits of the average audience attention span. (In fact, I had to learn how to tweak both the cluster and the application health check settings to shorten the interval – perhaps the subject of another blog post!) Naturally this also entailed frequently “resetting” the environment so that I could start over when things didn’t go quite as planned, or if I wanted to reset the version number. If you’ve ever worked with Service Fabric before you would know that deployments from Visual Studio (or Azure DevOps) can take a while; and undeploying an application from Service Fabric manually in the portal is painful!
For example, if I want to undeploy an application from a Service Fabric cluster in the web-based Service Fabric Explorer, I have to do the following in this order:
Remove the service
Remove the application
Unregister the application type
Remove the application package
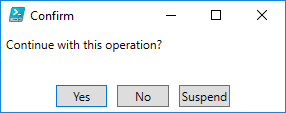
What becomes really annoying is that each step elicits a confirmation prompt where you need to type the name of the artefact you want to remove! That gets old pretty fast.
Thankfully, there is an alternative. Service Fabric offers a number of different ways to deploy applications, including Visual Studio, Azure CLI, and PowerShell. Underneath the covers I expect these all make use of the REST API. But in my case I found the simplest and most efficient choice was PowerShell. Using the documented commands, it is easy to create a script that will deploy or undeploy your application package in seconds. And I mean seconds! It was astounding to see how quickly the undeploy script could tear down the application!
The script I created is available in my demo code on GitHub. I’ll walk through some of it here.
Second, in order for the Deploy_SFApplication.ps1 script to work, you must have already packaged the application. You do this by right-clicking the Service Fabric project in Visual Studio (not the solution file!) and selecting “Package”. The path to this package is a mandatory parameter for this script. The Undeploy_SFApplication.ps1 script does not require this.
Parameters
The make the scripts reusable with the minimum amount of changes, I’ve parameterized all of the potentially variable settings:
Parameter Name
Description
Example/Default Value
path
This is the path to your packaged application. (This parameter is not required for the Undeploy_SFApplication.ps1 script)
C:ReposDemosVoting_v3VotingpkgDebug
imageStorePath
Where you want the package stored when uploaded in Service Fabric. Typically this can be the application name, perhaps with a version.
Voting
appTypeName
Usually the app name with “Type” appended
VotingType
appName
Must be prepended with “fabric:/”
fabric:/Voting
appVersion
IMPORTANT! Cannot deploy the same version already existing, it will fail
1.0.0
ServerCommonName
If using your local development cluster, just “localhost”. Otherwise, if in Azure, “CLUSTER_NAME.REGION.cloudapp.azure.com”
myCluster.australiaeast.cloudapp.azure.com
clusterAddress
Append the port number to the $ServerCommonName variable, usually 19000
$(ServerCommonName):19000
resolves to: myCluster.australiaeast.cloudapp.azure.com:19000
thumb
The thumbprint of the certificate used for a secured cluster (not generally required for a local cluster) NOTE: The script currently sets the location of the certificate in the current user’s personal store. However this could be easily parameterized.
Then it’s simply a matter of following using the documented commands, substituting the variables as appropriate in order to:
Connect to the cluster
Upload the package to the package store
Register the application type
Create the application instance
My Deploy_SFApplication.ps1 script also prints out the application instance details as well as the associated service instance details:
The Undeploy_SFApplication.ps1 script does much the same, except in reverse of course:
Connect to the cluster
Remove the application instance
Unregister the application type
Remove the application package
The use of the –force flag means that when you run this script you will NOT be prompted for confirmation like this:
Whilst the deployment script takes about 20 seconds for this Voting application, the undeploy script takes less than five seconds!
As mentioned previously, the scripts are freely downloadable along with the rest of the demo code on GitHub. I’m no PowerShell guru, so I’m sure there’s plenty of room for improvement. Send me a pull request if you have any suggestions! And feel free to get in touch if you have any questions.
This post was originally published on Deloitte’s Platform Engineering blog.
When messages flow into the BizTalk Server, the messages may get persisted in BizTalk Server’s MessageBox database. For a healthy BizTalk environment, it’s important to keep an eye on the number of service instances in the environment.For example, having a large number of suspended service instances will bloat your message box database and adversely affect the overall performance of your environment.
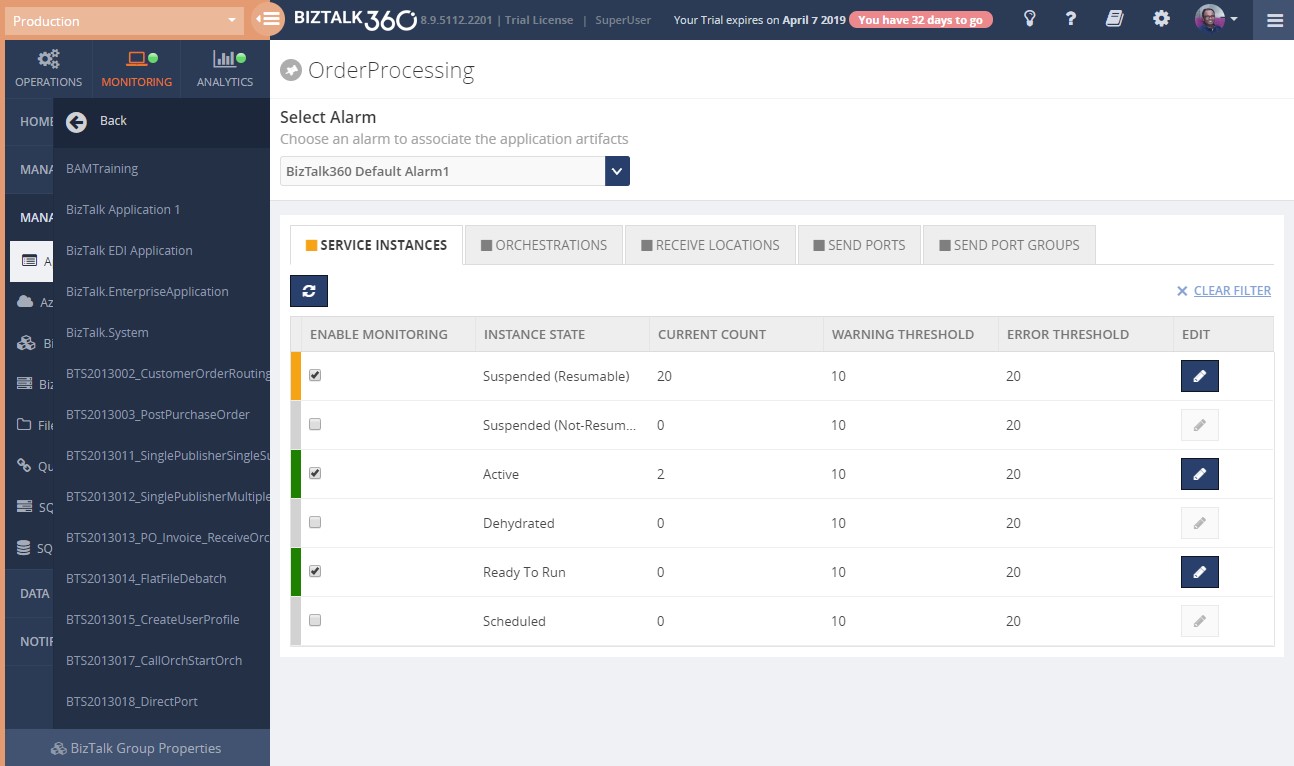
Administrator should always keep an eye on the service instances count via the BizTalk Administrator group hub page. The person who is monitoring this, need to be a BizTalk expert and understand the importance of each state. The group hub page only displays the instance count and it won’t tell you whether this is still at a healthy level. Whereas with BizTalk360 you can set the Warning and Error threshold levels (instance counts) for each states at application level. Once the number of instances count increases above the threshold, the system will send notification alert.
Also, the administrator can set up an alarm like “If there are >20 Suspended Service Instances between 09:00 AM and 05:00 PM, resume all the instances”. He can simply log in to the BizTalk360 Data Monitoring Dashboard to see the status of the message box data for the day. He can also set up email notifications for the alarm. By doing so, the administrator eliminates the need to often log in to the BizTalk360 application and check for the status of the service instances.
Custom widget to list all service instance details which are active for a long period
Custom Widget is one of the interesting and powerful features available in BizTalk360. With a custom widget, users can easily integrate third-party portals like Power BI, Sales Force or internal portals. You can also easily display Secure SQL Queries query results , monitor BizTalk Artefact statuses etc.
For instance, if a host instance is too busy to process all its associated service instances , then those instances will be in “Ready to Run” state until the host instance has available resources. When this situation remains for a longer timeframe, the service instances are going to get accumulated, thereby bloating the message box.
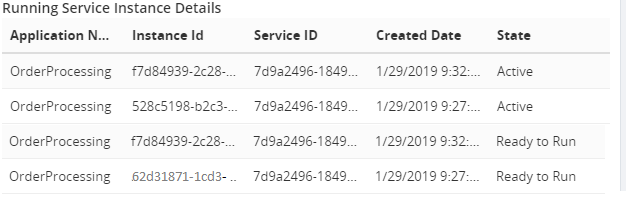
With the below script you can quickly create a custom widget to look up the number of service instances which are in the active state for a particular period of time. Say, the administrator can easily check service instance details which are in the Ready to Run or Active state for more than 15 minutes.
Creating such a widget, consists of the following steps:
Create a Secure SQL Query
Bind the SQL Query result to the custom widget
Both steps are described below.
1) Create Secure SQL Query
The below query retrieves the Service Instances which are in the Active state for more than 30 minutes.
You can create the custom widget and use below code. Don’t forget to include your environment details like the credentials of the BizTalk360 service account, etc.
<div id="WidgetScroll" style="top:30px;" data-bind="addScrollBar: WidgetScroll, scrollCallback: 'false'"> <table class="table table-lists"> <thead> <tr> <th style="width:30%">Application Name</th> <th style="width:30%">Instance Id </th> <th style="width:30%"> Service ID</th> <th style="width:30%">Created Date</th> <th style="width:30%">State</th> </tr> </thead> <tbody> <!-- ko if: (ServiceInstanceDetails()) --> <!-- ko foreach: ServiceInstanceDetails() --> <tr> <td data-bind="text: nvcName"></td> <td data-bind="text: uidInstanceID"></td> <td data-bind="text: uidServiceID"></td> <td data-bind="text: dtCreated"></td> <td data-bind="text: nState"></td> </tr> <!-- /ko --> <!-- /ko --> </tbody> </table> </div> <script> // BEGIN User variables username = ""; // BizTalk360 service account password = ""; // Password of BizTalk360 service account environmentId = ""; // BizTalk360 Environment ID (take from SSMS or API Documentation) queryId = ""; // Id of the Secure SQL Query (take from SSMS) queryName = ""; // Name of the Secure SQL Query as it is stored under Operations/Secure SQL Query sqlInstance = ""; // SQL Instance against which the SQL Query must be executed database = ""; // Database against which the SQL Query must be executed sqlQuery = " " // The Secure SQL Query created in step1 bt360server = ""; // Name of the Server where biztalk360 is hosted // END User variables
ServiceInstanceDetailsList = function () { var _this = this; _this.getServiceInstanceDetails(function (data) {
var results = x2js.xml_str2json(data.queryResult); if (Array.isArray(results.root.records.record)){ ko.utils.arrayForEach(results.root.records.record,function(item){
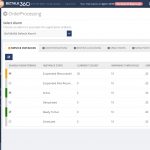
After you have created the custom widget and properly provided your environment details, it will look similar to the picture below.
We have written multiple articles about the capabilities of custom widgets, both in our blog, but also in the Documentation portal. You can check them out below:
Conclusion
It has been extremely beneficial to ensure the environment is healthy. With this custom widget you can easily get a clear insight about long running service instance details in a single view. If you have a particular scenario in which custom widgets could be useful, but you don’t know how to set this up, feel free to contact us at [email protected].
Recently I added an article to the integration playbook which compares the different approaches used for Durability, Persistence and Retry across the various microsoft technologies such as BizTalk, Logic Apps, Event Grid, Event Hubs, Service Bus Messaging and Functions
Ive recently added an article in the Integration Playbook talking about how messages can be correlated between processing instances. In particular this compares the approach in BizTalk against the approach you can use in Logic Apps by combining Logic Apps and Service Bus

 2. Custom Widget Script