Building an application with different deployment models, resources, and tools in Azure is not the end of the road. The ultimate goal of end-user experience, sustainability, and increased visibility could be achieved only with observability.
There are a lot of different tools available in the market. Azure has built-in tools, but many third-party solutions are available that stay on top of the native tooling to advance the observability functionality.
Today, I’ll take you through the common traits among the available tools and what you should consider while choosing an Azure observability tool.
What is the difference between monitoring and observability?
Before I go deep into observability, I would provide better clarity about its supplementary compatriot, monitoring. In fact, observability and monitoring are tightly connected, and you cannot achieve observability without monitoring.
Let us understand what they are, why they are essential, and when they are crucial to consider in your Azure ecosystem.
Monitoring
A monitoring system or tool actively tracks your application and continuously assesses it for any anomalies, flaws, or problems.
- Monitoring gathers metrics and properties from the available sources like APIs and logs.
- It passively tracks the performance and the amount of data it generates usually drowns the admin personnel.
- Monitoring usually focuses on a point observation like integrations, infrastructure, and networks.
- The data available through monitoring is often considered the final expected outcome.
Observability
The data collected from monitoring, like metrics and properties, set the base for observability. While monitoring focuses on incident reporting, observability provides insights into why the issue happened.
- It collects various data like metrics, logs, and traces, which sets up the system to extract crucial insights into why things are happening.
- It provides refined information after processing various data sources that pinpoint the exact root cause of the issue or incident.
- Observability holistically focuses on both application and infrastructure to identify the root cause.
- It collects data from sources contributing to the analytical process, representing the incident state.
At the bottom line, while many observability tools are available in the market, all of them have a shared data source platform: Azure Monitor.
Can you achieve better observability with Azure Monitor?
While Azure monitor could only generate metrics and logs, the users cannot achieve the advanced version of the monitoring, which is observability.
The platform should be able to refine various data sources like metrics, logs, and traces to focus on the relevant data, such as the factors that drive operations decisions and actions to fix incidents faster.
What should you consider while choosing an observability tool?
While many third-party and open-source solutions in the market utilize Azure Monitor export API to provide an upgraded experience beyond the threshold determined by the Azure cloud, I will explain the critical features that are expected to be present in any observability tool.
Analyze and predict anomalies in Azure
Leveraging custom algorithms to predict anomalies in Azure resources allows users to be proactive with critical performance issues. In addition, it correlates issues across hybrid and microservice architecture.
Real-time dependency mapping
This provides a sufficient view of the resources as a Line of Business Applications. Users can derive relationships between the resources that comprise the Business Application using this as a physical representation of the architecture with real-time health status.
Business KPI dashboard
Ability to auto-populate the dashboards that aggregates and presents the data to show the business goal achievements and bottlenecks.
Deep Analytical tool
Without switching between tabs, drill down into Azure services, components, or parameters using robust in-built tools to identify root causes.
Automatic remediation
The advanced automation capabilities help fix trivial incidents that may not require manual intervention.
List of Azure Observability Tools
Given the volume of tools available in the market, it might be daunting to compare every product and choose the wise one that suits your needs. Hence, we have hand-picked the top 5 observability tools that have advanced capabilities.
#1 Serverless360 (Best Overall)
Serverless360 is best for achieving advanced observability and end-to-end correlation tracking.
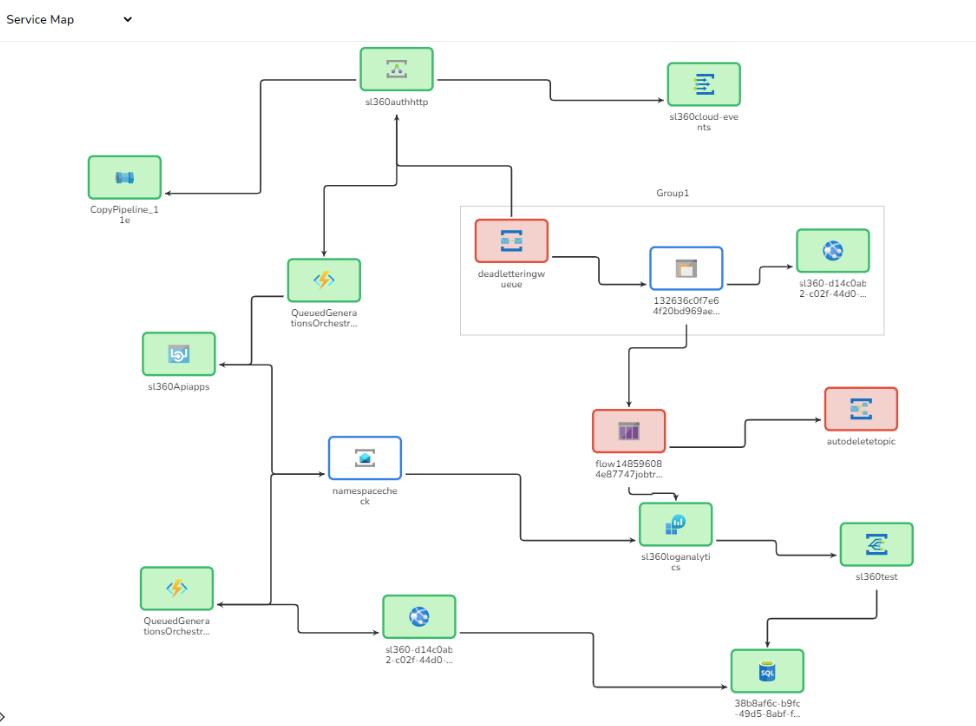
It extends the three core pillars of observability with a topology map that correlates the dependencies between applications to provide contextual information.
It provides actionable answers rather than just producing severity alerts which could be more helpful. With advanced automation, you can ensure high scalability by auto-remediating trivial issues without manual intervention.
Features
- Contextual information from the observed data about business goals impact
- Precise answers to reduce Mean time to recovery
- End-to-end correlation between the Azure service dependencies
- Service map to get the real-time health status of the application architecture
- Granular user access permission and team collaboration
- Desperate notification channels like slack, service now, teams, and more
Price
Its base price starts at $150/month for 25 Azure resources. You can try their 15 days free trial.
#2) Dynatrace
Dynatrace is a comprehensive enterprise SaaS tool for a wide range of enterprise monitoring needs. Distributed Tracing provides a technology called Purepath that combines distributed tracing with code-level insight.
Features:
- Automatic injection and collection of data
- Code-level visibility across all application tiers for web and mobile apps together
- Always-on code profiling and diagnostics tools for application analysis
#3) SigNoz
SigNoz is a full stack open source APM and observability tool. Collect both metrics and traces with log management, currently included in the product roadmap. Logs, metrics, and traces are considered the three pillars of observability in modern distributed systems.
Features:
- User requests per second
- 50th, 90th, and 99th percentile latencies of microservices in your application
- Error rate of requests to your services
#4) Honeycomb
Honeycomb is a full-stack cloud-based observability tool with support for events, logs, and traces. It provides easy to use UI for unified observability and some of its features includes:
Features:
- Quickly diagnose issues and tweak performance with a top down approach to understand how your system is processing service requests
- Full-text search over trace spans and toggle to collapse and expand sections of trace waterfalls
- Provides Honeycomb beelines to automatically define key pieces of trace data like serviceName, name, timestamp, duration, traceID, etc.
#5) Datadog
DataDog is an enterprise APM tool that offers a variety of monitoring products from infrastructure monitoring, log management, network monitoring to security monitoring.
Features:
- Out of box performance dashboards for web services, queues, and databases to monitor requests, errors, and latency
- Correlation of distributed tracing to browser sessions, logs, profiles, network, processes, and infrastructure metrics
- Can ingest 50 traces per second per APM host
- Service maps to understand service dependencies
Observability in Azure: Wrap up
Many tools are available at your disposal, while Azure Monitor is a solid out-of-the-box place to start if your organization decides to work with Azure. But at scale, you may need advanced and custom functionalities that go beyond the limitations of the native tool to help you understand the health of your application at a glance which will keep your business up and running.
The post Top 5 Azure Observability Tools in 2023 appeared first on Steef-Jan Wiggers Blog.