Since quite some time I am developing a BizTalk monitoring tool, called BizTalk Processing Monitor (or BPM). This tool is different from most other BizTalk monitoring tools in that it does not monitor end points, but it gives (near) realtime insight if messages flow through your BizTalk Group. If there are any interruptions, you get warned. To retrieve this kind of information, BPM uses the Tracking database.
%ufeff%ufeff%ufeff%ufeff
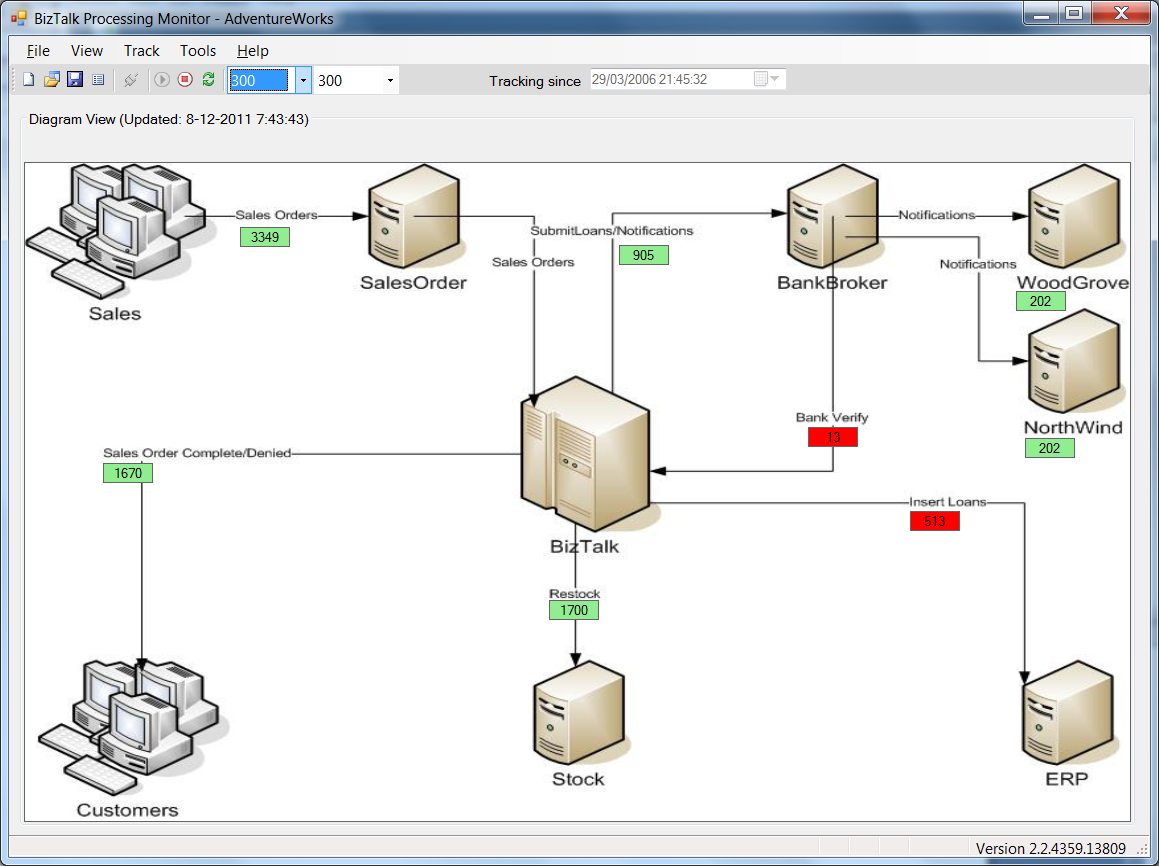 |
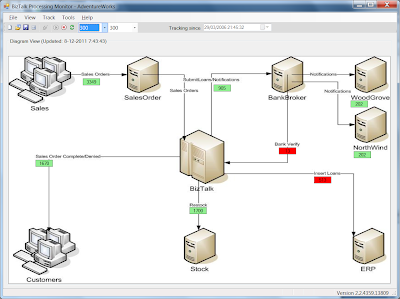
| Diagram View – here you can add a picture from your system and define which information you want to see |
%ufeff%ufeff%ufeff%ufeff Wednesday December 7 I had the pleasure to demonstrate BizTalk Processing Monitor to Saravana Kumar, known from amongst others BizTalk247 and BizTalk360. During a one hour Skype session we discussed BizTalk monitoring in general and BizTalk 360, but most of the time was reserved for a demonstration of my BizTalk Processing Monitor.
%ufeff
For January my collegue Steef-Jan Wiggers, Saravana and me are planning a talk at Ordina, Nieuwegein in the Netherlands about BizTalk monitoring and the available tools. This talk will be part of Ordina’s ‘Innoveer jij mee’ series (Innovate wih us). For now I’ll just show you a couple of screen dumps from BPM, but for a live demonstration I hope to meet you in January! Details will follow when available.
In the mean time: if you are interested in the capabilities of this tool or just want to know how it works, please don’t hesitate to drop me a line!
%ufeff
%ufeff
 |
| Warning Levels legend – When, for example, it took longer than 60 minutes to receive a certain messagetype, the so-called Tracker in the Diagram View will turn red |
%ufeff%ufeff
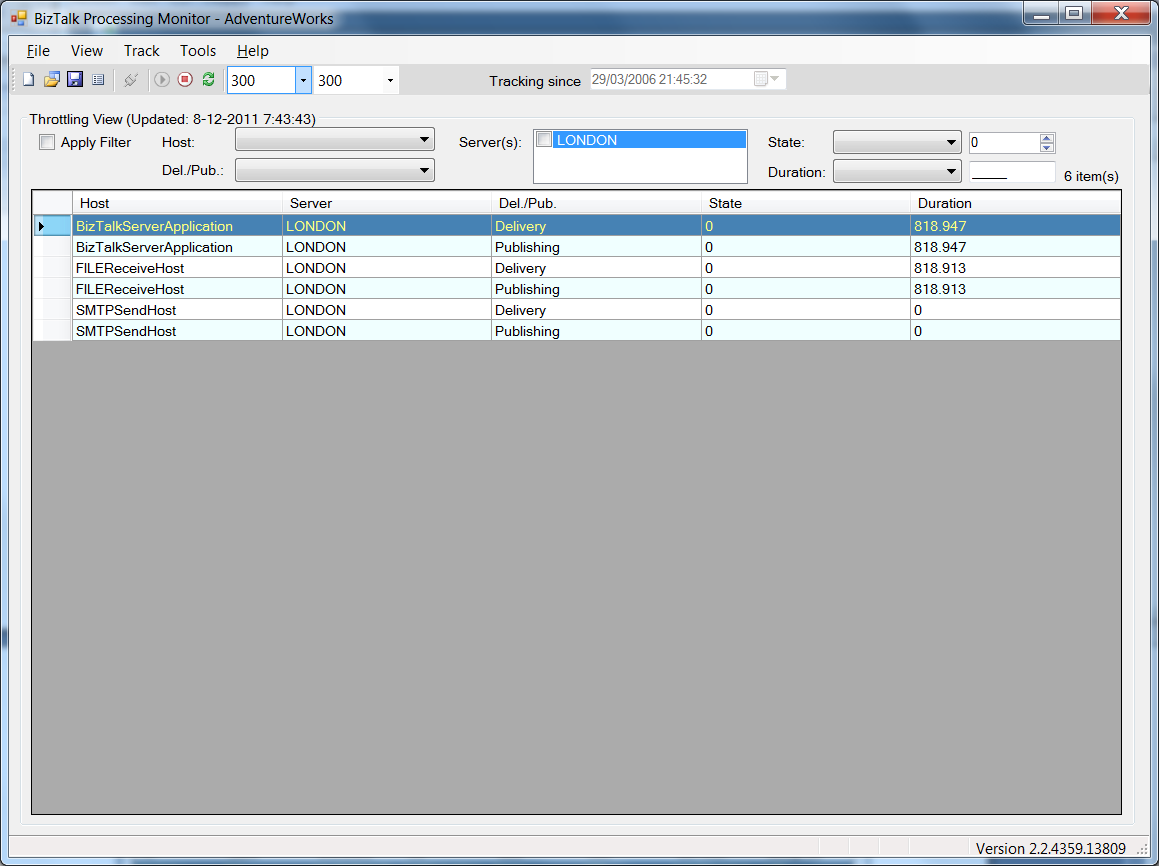 |
| Throttling View – Your Hosts and their instances are auto discovered. In case BizTalk is throttling, you get a warning. |
%ufeff%ufeff
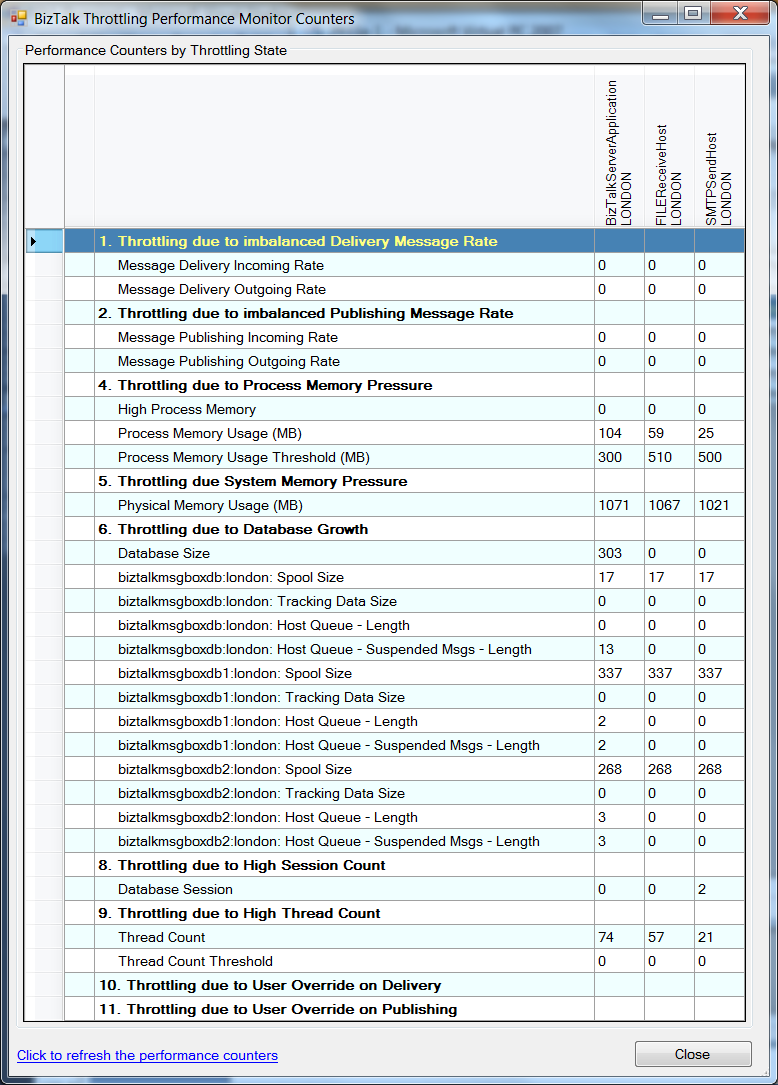 |
| Performance Counters by Throttling State – this screen shows more information about the throttling related performance counters |
%ufeff %ufeff