When you create a Web API or API App it’s essential to monitor it while it is running. Most importantly, you want to detect failures before most of your customers do. You also want to discover and fix performance issues and want to know what the users are doing with your Web API like are they using the latest features for example.
Application Insights is an extensible Application Performance Management (APM) service for web developers that monitors your running Web API. It tells you about failures and performance issues, and helps you analyze how customers use your app.
Perform the following steps to use the Application map and Alerts in Application Insights:
1. Add the Application Insights SDK to the API App
2. Use the Application Insights API in the API App for custom events and metrics
3. Use the Application Map in Application Insights to drill down errors
4. Set Alerts in Application Insights
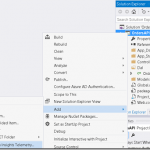
Step 1: Add the Application Insights SDK to the API AppRight-click your API app project in Solution Explorer, and choose Add, Application Insights Telemetry. |
||||||
 |
||||||
| Note In Visual Studio 2015, there’s also an option to add Application Insights in the New Project dialog.) |
||||||
|
Continue to the Application Insights configuration page:
|
||||||
 |
||||||
Step 2: Use the Application Insights API in the API App for custom events and metricsIn Application Insights, a custom event is a data point that you can use to find out what users are doing with the API App, or to help diagnose issues. The Application Insights API for custom events and metrics is the same API that the standard Application Insights data collectors use. |
||||||
| Use the following lines of code in your application to send an event whenever a document is not found: | ||||||
|
using Microsoft.ApplicationInsights; |
||||||
 |
||||||
Step 3: Use the Application Map in Application Insights to drill down errorsThere are plenty of ways to explore your telemetry data in Application Insights. One option is to use the Application Map in the Azure Portal. An Application Map is a visual layout of the dependency relationships of your application components. Each component shows KPIs such as load, performance, failures, and alerts, to help you discover any component causing a performance issue or failure. |
||||||
|
To open the Application Map go to the Azure portal and then navigate to the API App that you created.
|
||||||
 |
||||||
| Click on App map from the Application Insights blade to open the Application map. | ||||||
 |
||||||
| Click on the error or warning to further investigate. | ||||||
 |
||||||
| When you click on the error a new blade opens with an overview of the Failed Requests. | ||||||
 |
||||||
| Click on the error to see the properties of the failed HTTP request. | ||||||
 |
||||||
| Click on the link “All available telemetry for this operation” to see the telemetry and custom events. | ||||||
 |
||||||
Step 4: Set Alerts in Application InsightsApplication Insights can also alert you to changes in performance or usage metrics in your API App. You can use the Metric alerts tell you when any metric crosses a threshold value for some period – such as response times, exception counts, CPU usage, or page views. |
||||||
| Click on Alerts to open the Alert rules blade, and then click on the Add alert button. | ||||||
 |
||||||
| Use the Failed request metric to set an alert if a HTTP request to the API App fails and returns an error to the client. If you check the box “Email owners…”, alerts will be sent by email to an administrator for example. |
||||||
 |
||||||
| You then get a Failed Request Alert email when an alert changes state between inactive and active. | ||||||
 |
||||||
| The current state of each alert is also shown in the Alert rules blade. | ||||||
 |
Application Insights is really a very good way to monitor your API App. It’s easy to add to your code and it has many great features like for example Alerts and the Application map. It’s also very mature and with the Basic pricing option, you pay based on the volume of telemetry your application sends, with a 1 GB free allowance per month. This free data allowance gives you a great way to try out Application Insights as you get started!