Modern enterprise IT is hybrid and relies on data from on-premises and the cloud. At the core of Microsoft’s Hybrid Integration Platform, we have BizTalk Server which handles all your on-premises integration scenarios and Logic Apps, which takes care of all the cloud integrations leveraging Azure Services.
BizTalk 360 already provides a comprehensive monitoring solution for your Hybrid Integrations from version 8.3 which introduced Logic Apps State monitoring.
We are excited to announce the addition of Logic Apps Metrics monitoring capabilities to our forthcoming 8.4 release (expected: Apr 2017).
With this release, you will be able to monitor your logic apps using all the available metrics that are provided in the Azure Portal.
Setting Data Monitoring for Logic Apps metrics
The new Logic Apps monitoring capability is just an extension to our already existing data monitoring functionality. You can find the newly added tab for the Logic Apps under the Data Monitoring module.
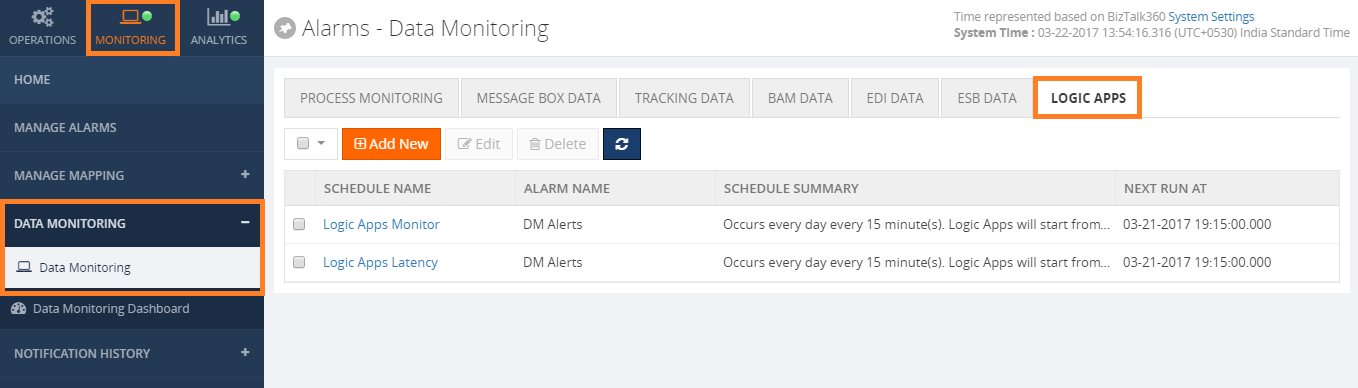
Click the Add New button to add a new monitor for the Logic Apps. A new Logic Apps Monitor setup window will appear. We can see that all the Logic Apps related settings are grouped under “SET DATA FILTER” section in the below image.
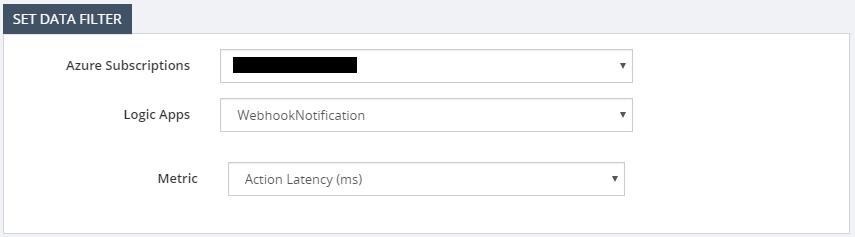
Select the subscription from the list of subscriptions that you have configured in BizTalk 360. Please check this Assist article if you want to know how to add Azure subscriptions in BizTalk360.
Once the subscription is selected BizTalk360 will display all the Logic Apps that are available in that selected subscription. Finally select the metric that you want to monitor.
Once you set the data filter you can specify the notification condition which BizTalk360 will use to send alerts for each violation as shown below.
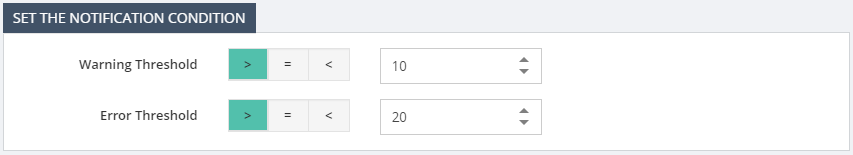
Note: Azure metrics can have different units based on the metric type so metrics like Action Latency will have milliseconds as the unit type. In those cases, the threshold condition must be set based on the selected metric.
Save the Logic Apps monitoring schedule. BizTalk360 Monitor service will pick up the new monitor configuration and customers will start receiving the email notifications or any other notification channels based on the Alarm configuration.
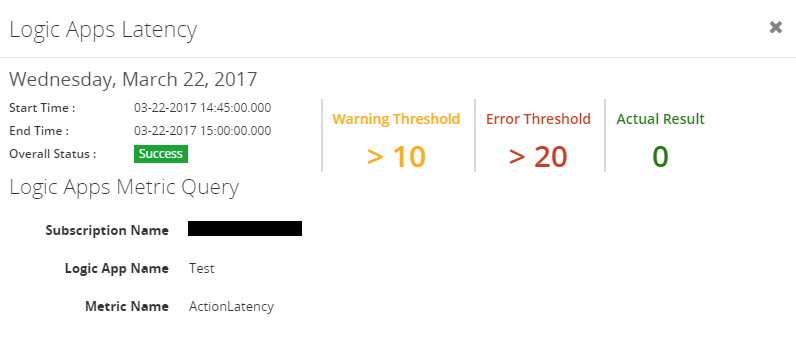
You can also view the monitoring results in the Data Monitoring Dashboard as shown in the below image.
Click an alert item to view the details.
Summary
We hope this new capability will enhance the monitoring use case for all our customers having Hybrid Integration scenarios. If you have any feedback, please write to [email protected].