BizTalk360 is a full featured BizTalk Server Monitoring & Operations product. The product has matured from a small web based monitoring tool to a full blown feature rich product for monitoring BizTalk Server. The product includes features for BizTalk Operation support people like the Throttling analyzer, Topology Viewer, and Backup DR Monitor. Recently a new version 7.8 has been released with another set of valuable features:
- Advanced Process Monitoring and dashboard
- EDI reporting capabilities in line with BizTalk Admin Console.
- System Profile: Ability to remove features you don’t want in BizTalk360.
- User Profile: Flexibility to set custom time zone and date/time format for each user.
- Removed Orphaned artifacts from Monitoring: Ability to remove old orphaned artifacts like Applications, which no longer exist in the environment.
If you haven’t heard of BizTalk360 than you will like this blog post as it will explain how you can easily evaluate the tool by yourself and witness the great value this product can offer. Now this will be not an extensive post to showcase each feature. I will focus on how you can leverage the features: Graphical Flow (Tracking), Business Activity Monitoring (Portal), and the Tracking Manager.
Easy way to see these features in action is by deploying the BamEndToEnd example you can find in the <Samples Path>BamEndToEndInput folder of the installation of your BizTalk Server. This sample stems from version 2004 and can be used from 2006 up to 2013 R2. The demonstrations in this post is the BamEndToEnd example with BizTalk Server 2013 R2, and the latest BizTalk360 Version 7.8.
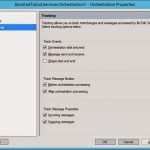
After deploying the BamEndToEnd example you will need to create the tracking profile yourself and deploy it. Next you will to add/verify the tracking is enable on the send, receive ports and the orchestrations.
Note that tracking can be very useful for troubleshooting and traceability in general. However in production environments you beware that extensive tracking can influence performance. For best practices for tracking see blog post on BizTalkAdminsBlogging Best Practices for Tracking. With regards to orchestration tracking is that Event Tracking is enabled by default. This can be helpful during development, testing and troubleshooting with the Orchestration Debugger. In Production, these tracking events should be disabled, because these events are written to the TrackingData_x_x tables in the BizTalkMsgBoxDb database and then moved to the dta_DebugTrace table in the BizTalkDTADb database by the Tracking host. If the TrackingData_x_x tables (BizTalkMsgBoxDb database) and/or the dta_DebugTrace table (BizTalkDTADb database) get too large*, performance will be impacted, see How to maintain and troubleshoot BizTalk Server databases.
After deployment and configuration is done you can drop the test messages in the folder belonging to the receive location. In SQL Studio Manager you can execute the query below to examine if data is present in the BAMPrimairyImport database tables belonging to the BamEndToEndActivity.
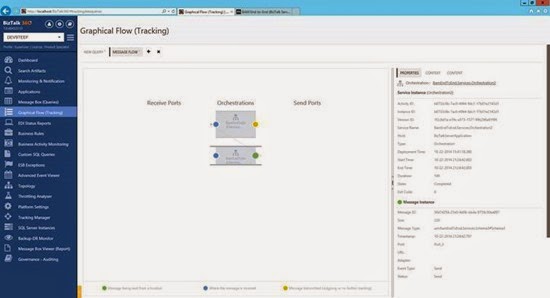
When that is in order you can switch to BizTalk360 product. The product is available for free trail. The installation is straightforward described on the site on this page. Once you have installed and configured BizTalk360 you can start looking at some of the features. One is the Graphical Flow (Viewer). You can select this viewer and leave everything default and click Execute Query.
Next you can select one of the tracked service instances.
On right hand side you can see the properties of the third orchestration of the BAMEndToEnd example. You can click the blue dot (where the message is received) and see a line going from the green dot (message being send from a location) of the second orchestration. Now you can click in the right hand pane the context and/or content tab. You will see the context of the message going from Orchestration 2 to 3 and the content.
You can click the blue dot again and reach orchestration 1 the first orchestration message are flowing through. This feature is a very valuable feature in case you need to troubleshoot a process that for instance consists of multiple orchestrations. From a messaging perspective you can look at messages coming in and out of BizTalk. In the dashboard you can select Tracked Message Events instead of Tracked Service Instances. Select one of the Send Type the eye icon.
A dialog will appear for the message you selected. You can see the general properties, context properties and the content. Note this depends on how tracking is configured. For both Tracked Message Events and Tracked Service Instances you add filters that can enhance search ability for a certain message(s) and instance(s).
Next we will look at the Business Activity Monitoring. BizTalk360 offers a view/dashboard for BAM that is similar to the BAM Portal. One of the concepts of BizTalk360 is offering a single operation and monitoring experience. This means one product for accessing data and user experience (UI) for BizTalk, BAM, BRE, EventViewer, BizTalk databases and ESB Toolkit.
If you go to Business Activity Monitoring Dashboard in BizTalk360 you can do similar things one can do in the BAM Portal. In The BAM Dashboard you can select a BAM View. In this case the BAMEndToEnd View. Select columns and execute a query.
As you can see the data can be viewed from the dashboard. There is no need to go to a separate Portal in case your BizTalk solutions include BAM. The BAM Dashboard in BizTalk360 will also give you a view of the sizes of the BizTalk BAM Databases.
Sizes of your BAM databases matter. In case BizTalk system is under a huge load a significant amount will be persisted to the BAM database. Therefor information on size and growth are valuable. You can monitor this by setting alarms in BizTalk360.
The final feature I like to discuss in this context is the Tracking manager. For the BAMEndToEnd example you can enable tracking on send/receive ports and the orchestrations. By selecting the Tracking Manager in BizTalk360 you can examine how tracking is enable on the receive ports, send ports and orchestrations.
You can select different applications in this dashboard, examine if global tracking is enabled and how per application the tracking is set on receive/send ports and orchestrations. This manager or dashboard if you like gives you a quick view on how tracking is set up in your BizTalk environment. This can be useful in cases you have not direct insight of the bindings of the applications that are being deployed. The bindings can contain tracking settings, see for instance binding collection of a receive port on MSDN.
In this post I quickly showed three powerful features in BizTalk360. However, there are many more which you can examine by yourself or by reviewing the feature tour on the BizTalk360 site. In case you like to further explore the features BizTalk360 offers you can do so by using the BizTalk out-of-the box examples on a VM and the evaluation edition of the product.
Cheers,
Steef-Jan

