Have you noticed that the default BizTalk Health Monitor Dashboard doesn’t monitor/report the status of the BizTalk Server Host Instances?
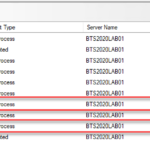
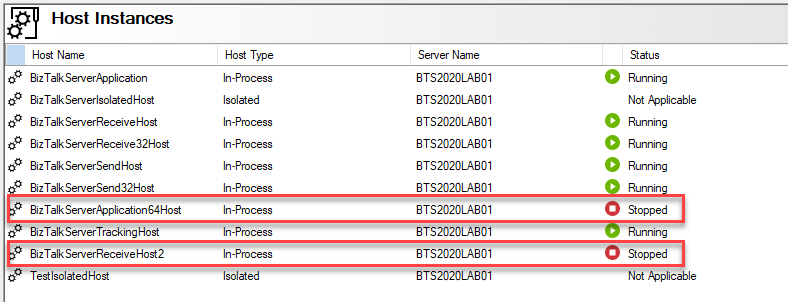
A few weeks ago, while delivering a BizTalk Server training course, I was presenting and playing around with the BizTalk Health Monitor with my “students” and explaining the importance of actively monitoring your BizTalk Server platform. Because my developer environment is a machine that doesn’t have many errors and is properly configured, like a production environment, it is difficult to show the BizTalk Health Monitor presenting problems, so I decided to stop some of the Host Instances! It is an easy way to “emulate” a problem:
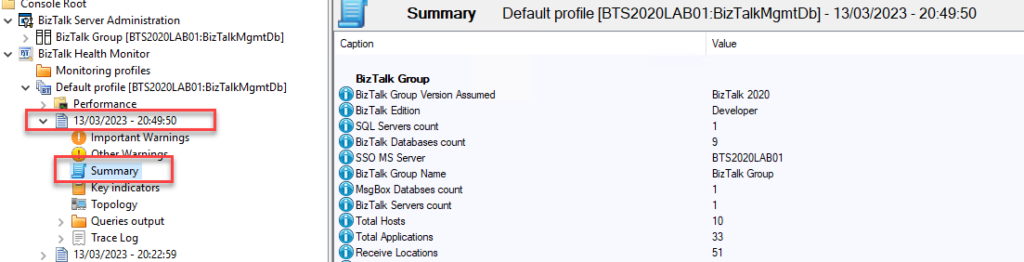
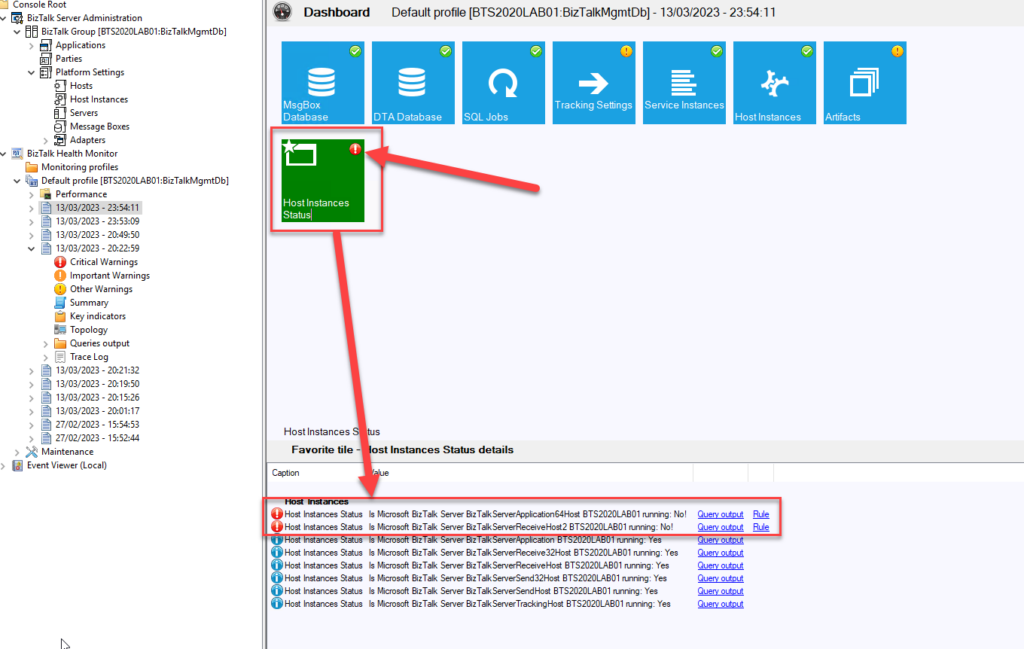
However, when I ran the BizTalk Health Monitor, I realized the Host Instance tile was green!
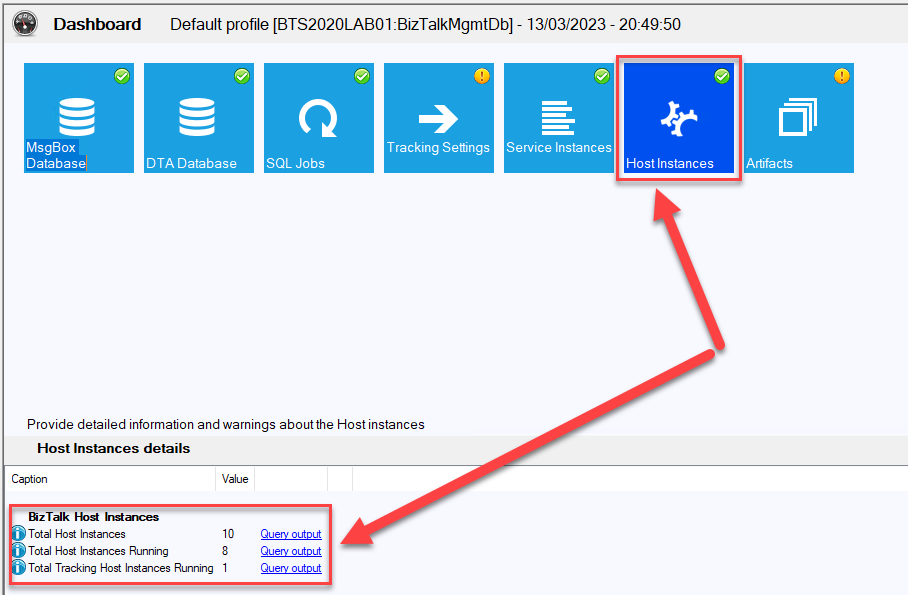
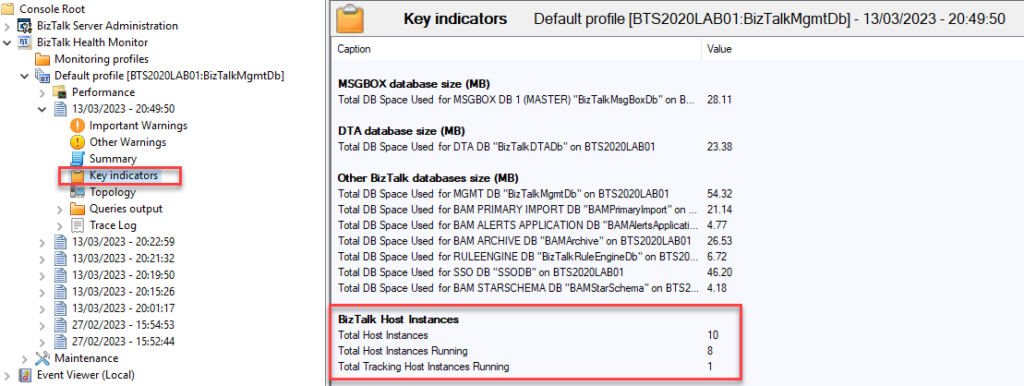
Notice also that the information provided states that I have 10 Host Instances, and only 8 were running. I was surprised by that behavior. I confirmed with the Microsoft Engineering team, and this is not a bug. Actually, by default, the Host Instances dashboard tile is NOT supposed to report a warning if some Host Instances are stopped. this tile reports, in fact, what MSFT has in the category “BizTalk Host Instance” of the KPI view:
Each default Dashboard tile normally reports the content of one or more categories of different views (Warnings, Summary, Key indicators, Queries Output…); However, the choice of content of these tiles cannot be changed by us.
Now the main question is: Can we put the BizTalk Server Health Monitor “watching” the status of the Host Instances and raising some alerts?
Luckily for us, the answer is yes, and it is not that difficult. The tool allows us to:
- Add custom rules that will allow us to query the environment.
- And add our own custom tiles in our profile Dashboard view.
That also means that each profile can have there own monitoring customizations.
To create some custom rules to monitor the status of the Host Instances, assuming that you have the BizTalk Health monitor tool open, we need to:
- Right-click over the Default profile, and select the Profile settings… option from the context menu.
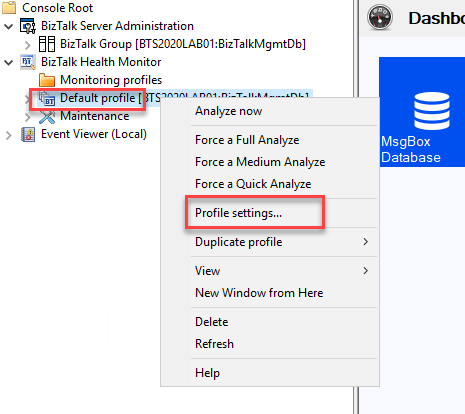
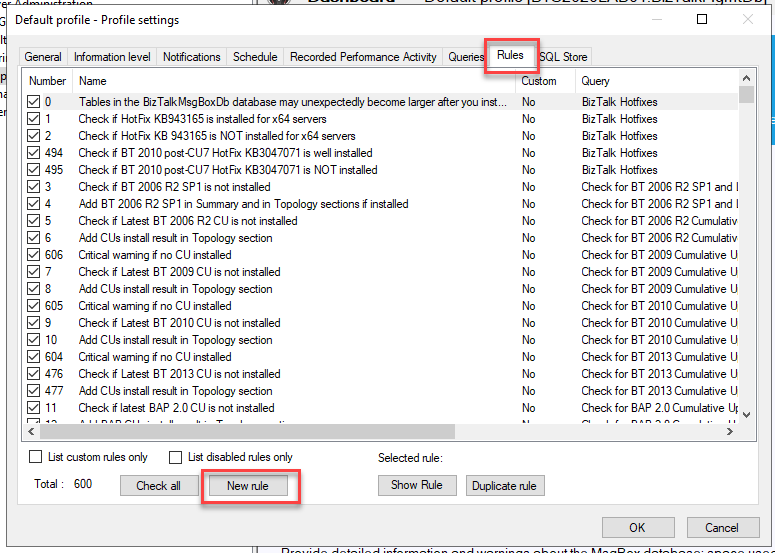
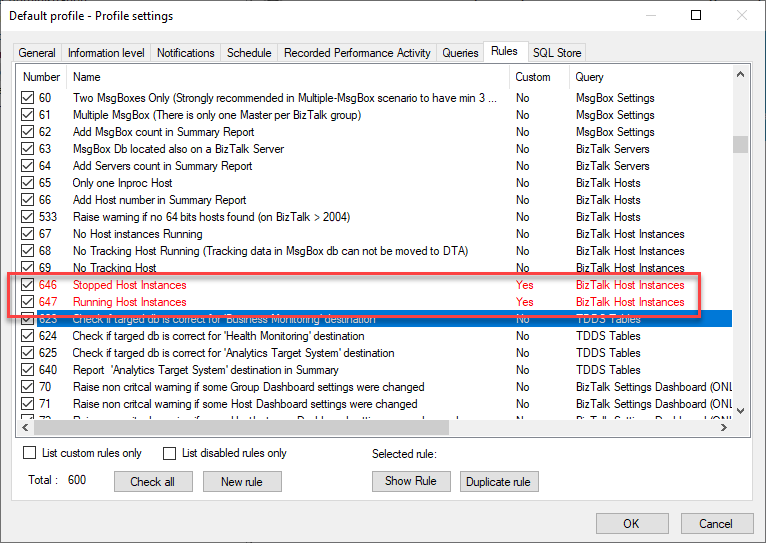
- From the Default profile – Profile settings window, select the Rules tab and then click on New rule.
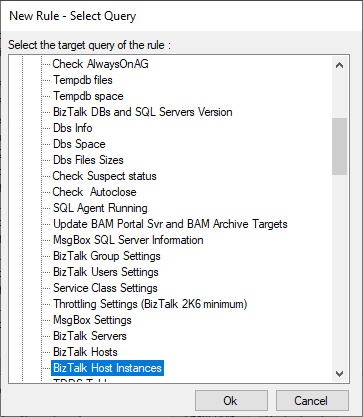
- From the New Rule – Select Query window, expand the Important target category, then select the BizTalk Host Instances sub-category, and click Ok.
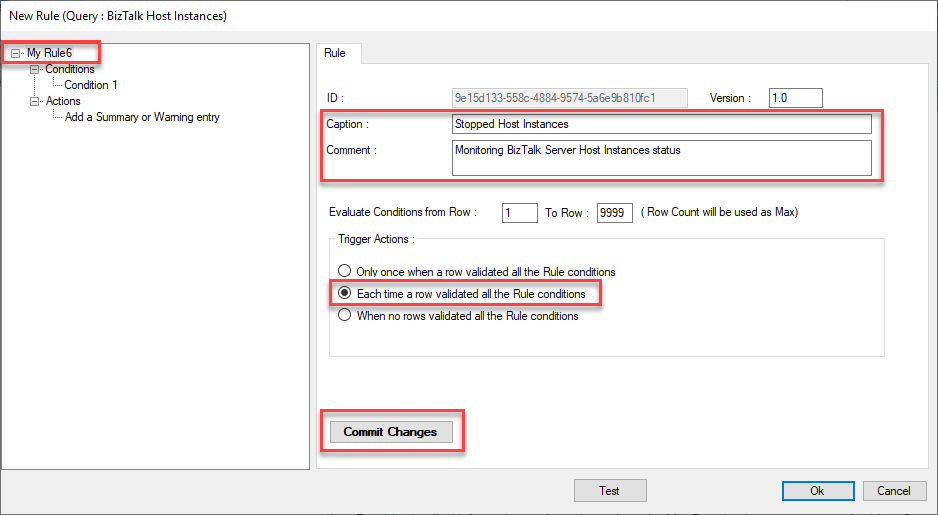
- On the New Rule (Query: BizTalk Host Instances) window, select the My Rule option from the left tree and:
- On the Caption property, give a name to the rule: Stopped Host Instances.
- On the Comment property, provide a small description: Monitoring BizTalk Server Host Instances status.
- On the Trigger Actions panel, select the Each time a row validated all the Rule conditions option.
- And click Commit changes.
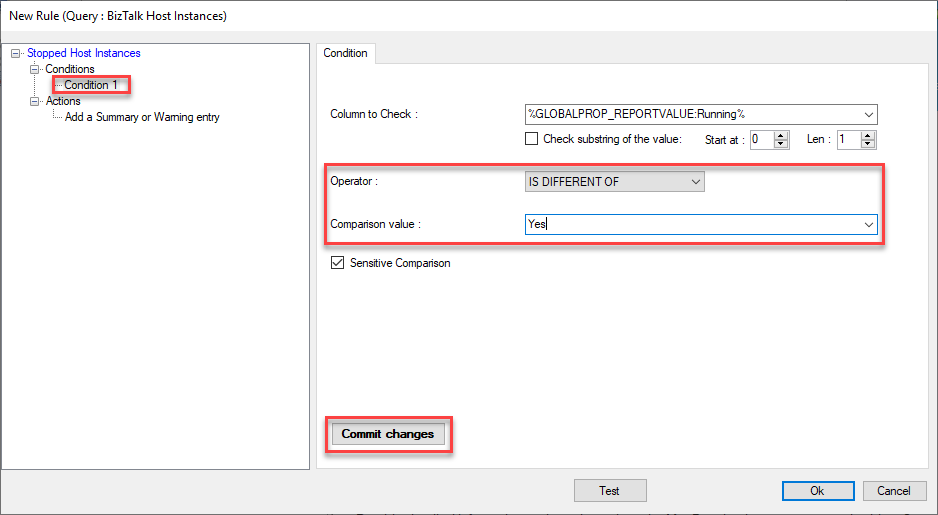
- On the New Rule (Query: BizTalk Host Instances) window, select the Condition 1 option from the left tree and:
- On the Column to Check property, leave the default value: %GLOBALPROP_REPORTVALUE:Running%.
- On the Operator property, from dropbox, select the option: IS DIFFERENT OF.
- On the Comparison value property, type Yes.
- And click Commit changes.
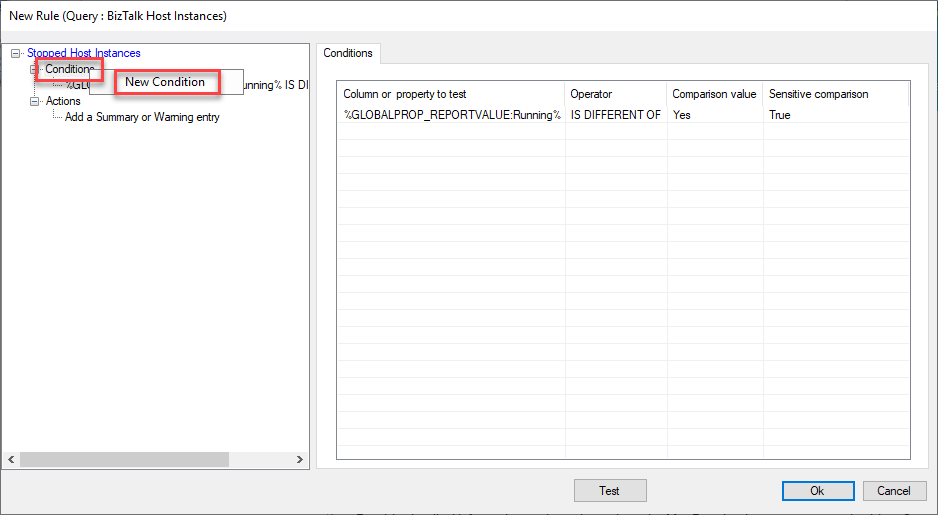
- On the New Rule (Query: BizTalk Host Instances) window, on the Condition option from the left tree, right-click and select the option New Condition:
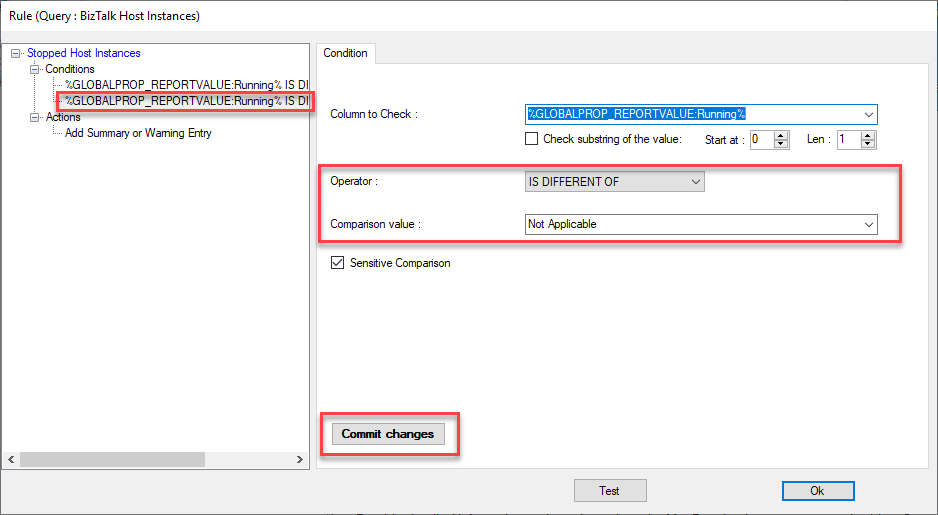
- On the New Rule (Query: BizTalk Host Instances) window, select the Condition 2 option from the left tree and:
- On the Column to Check property, leave the default value: %GLOBALPROP_REPORTVALUE:Running%.
- On the Operator property, from dropbox, select the option: IS DIFFERENT OF.
- On the Comparison value property, type Not Applicable.
- And click Commit changes.
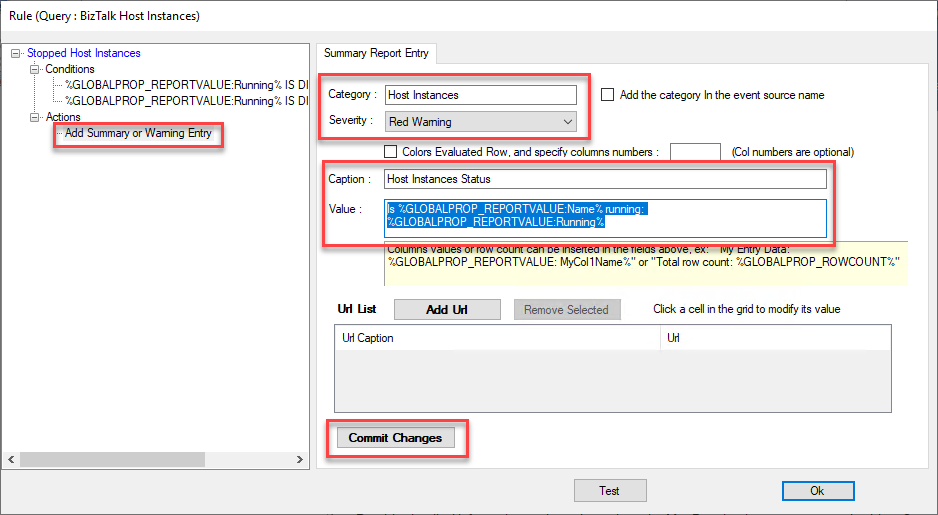
- On the New Rule (Query: BizTalk Host Instances) window, select the Add Summary or Warning Entry option from the left tree under the Actions option and:
- On the Category property, type: Host Instances.
- On the Severity property dropbox, select the Red Warning option.
- On the Caption property, type: Host Instances Status.
- On the Value property, type: Is %GLOBALPROP_REPORTVALUE:Name% running: %GLOBALPROP_REPORTVALUE:Running%
- And click Commit changes.
- Finally, click Ok.
You can always try the custom rule by clicking Test.
This rule will gather information about Host Instances that are not running. Now we are going to create another rule to gather information about Host Instances that are running. To do that, we need to:
- From the Default profile – Profile settings window, select the Rules tab and then click on New rule.
- From the New Rule – Select Query window, expand the Important target category, then select the BizTalk Host Instances sub-category, and click Ok.
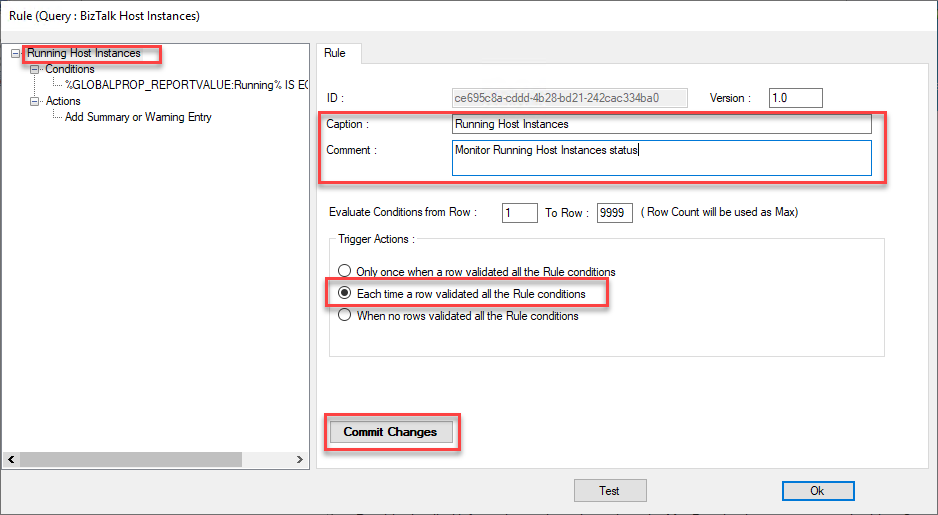
- On the New Rule (Query: BizTalk Host Instances) window, select the My Rule option from the left tree and:
- On the Caption property, give a name to the rule: Running Host Instances.
- On the Comment property, provide a small description: Monitor Running Host Instances status.
- On the Trigger Actions panel, select the Each time a row validated all the Rule conditions option.
- And click Commit changes.
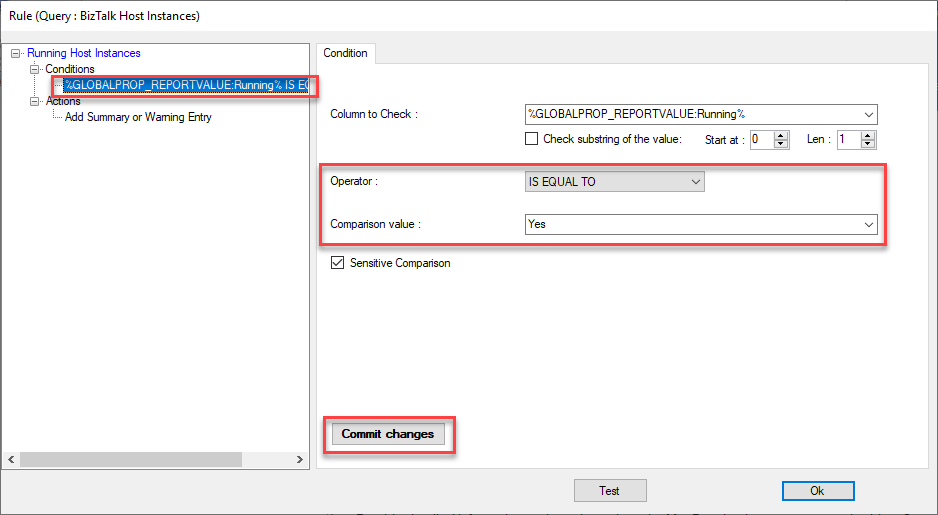
- On the New Rule (Query: BizTalk Host Instances) window, select the Condition 1 option from the left tree and:
- On the Column to Check property, leave the default value: %GLOBALPROP_REPORTVALUE:Running%.
- On the Operator property, from dropbox, select the option: IS EQUAL TO.
- On the Comparison value property, type Yes.
- And click Commit changes.
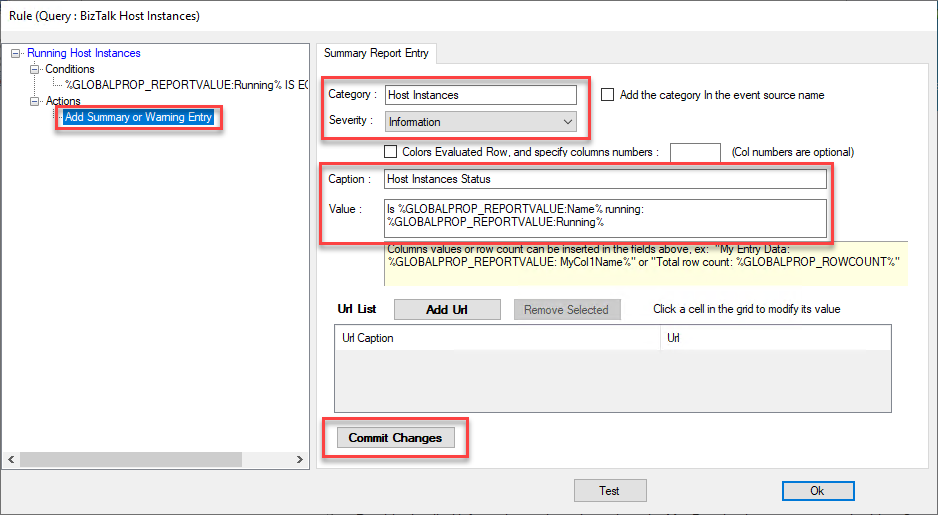
- On the New Rule (Query: BizTalk Host Instances) window, select the Add Summary or Warning Entry option from the left tree under the Actions option and:
- On the Category property, type: Host Instances.
- On the Severity property dropbox, select the Information option.
- On the Caption property, type: Host Instances Status.
- On the Value property, type: Is %GLOBALPROP_REPORTVALUE:Name% running: %GLOBALPROP_REPORTVALUE:Running%
- And click Commit changes.
- Finally, click Ok.
Make sure that the two custom rules are selected, and then perform another analysis of your platform.
Now, what we need to do is to create a custom tile to pin to our dashboard. A custom tile can be indeed created easily from any entry or category of the Warning view, Summary view, Key indicators view, or query output view. And to do that, we need to:
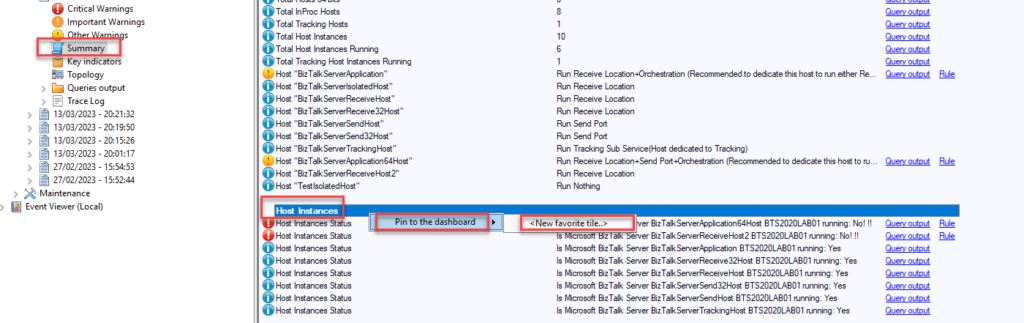
- After analyzing our BizTalk Server environment, expand the report and then select the Summary option.
- On the Summary report page, scroll down until you find the Host Instances summary, right-click on Host Instances and select the option Pin to the dashboard and then .
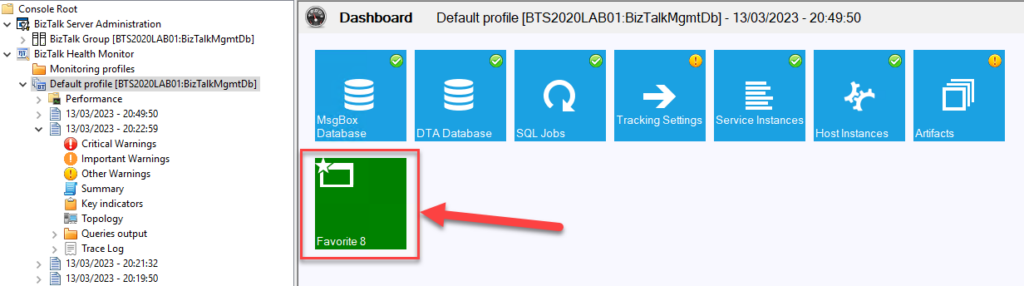
- A new window will appear, saying that a new item was added to the dashboard. Click Ok.
- If we now click on the Default profile, we will see that the Favorite tile was added to the dashboard.
- We can customize the name of that tile by right-clicking and selecting the Edit option.
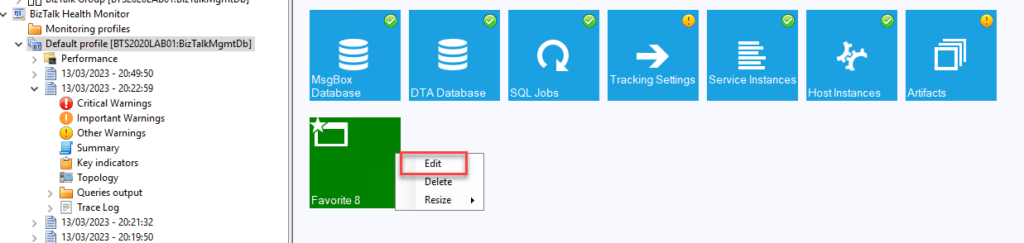
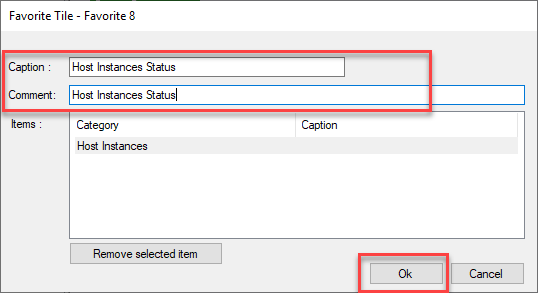
- On the Favorite Tile – Favorite window:
- On the Caption property, type: Host Instances Status.
- On the Comment property, type: Host Instances Status.
- And click Ok.
And finally, test it by doing another analysis of the environment.
How amazing is this!
Thanks to all that helped me document this feature. You know how you are!
Hope you find this useful! So, if you liked the content or found it useful and want to help me write more content, you can buy (or help buy) my son a Star Wars Lego!
