by Saranya Ramakrishnan | Mar 5, 2019 | BizTalk Community Blogs via Syndication
When messages flow into the BizTalk Server, the messages may get persisted in BizTalk Server’s MessageBox database. For a healthy BizTalk environment, it’s important to keep an eye on the number of service instances in the environment.For example, having a large number of suspended service instances will bloat your message box database and adversely affect the overall performance of your environment.
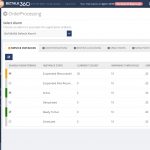
Administrator should always keep an eye on the service instances count via the BizTalk Administrator group hub page. The person who is monitoring this, need to be a BizTalk expert and understand the importance of each state. The group hub page only displays the instance count and it won’t tell you whether this is still at a healthy level. Whereas with BizTalk360 you can set the Warning and Error threshold levels (instance counts) for each states at application level. Once the number of instances count increases above the threshold, the system will send notification alert.
Also, the administrator can set up an alarm like “If there are >20 Suspended Service Instances between 09:00 AM and 05:00 PM, resume all the instances”. He can simply log in to the BizTalk360 Data Monitoring Dashboard to see the status of the message box data for the day. He can also set up email notifications for the alarm. By doing so, the administrator eliminates the need to often log in to the BizTalk360 application and check for the status of the service instances.
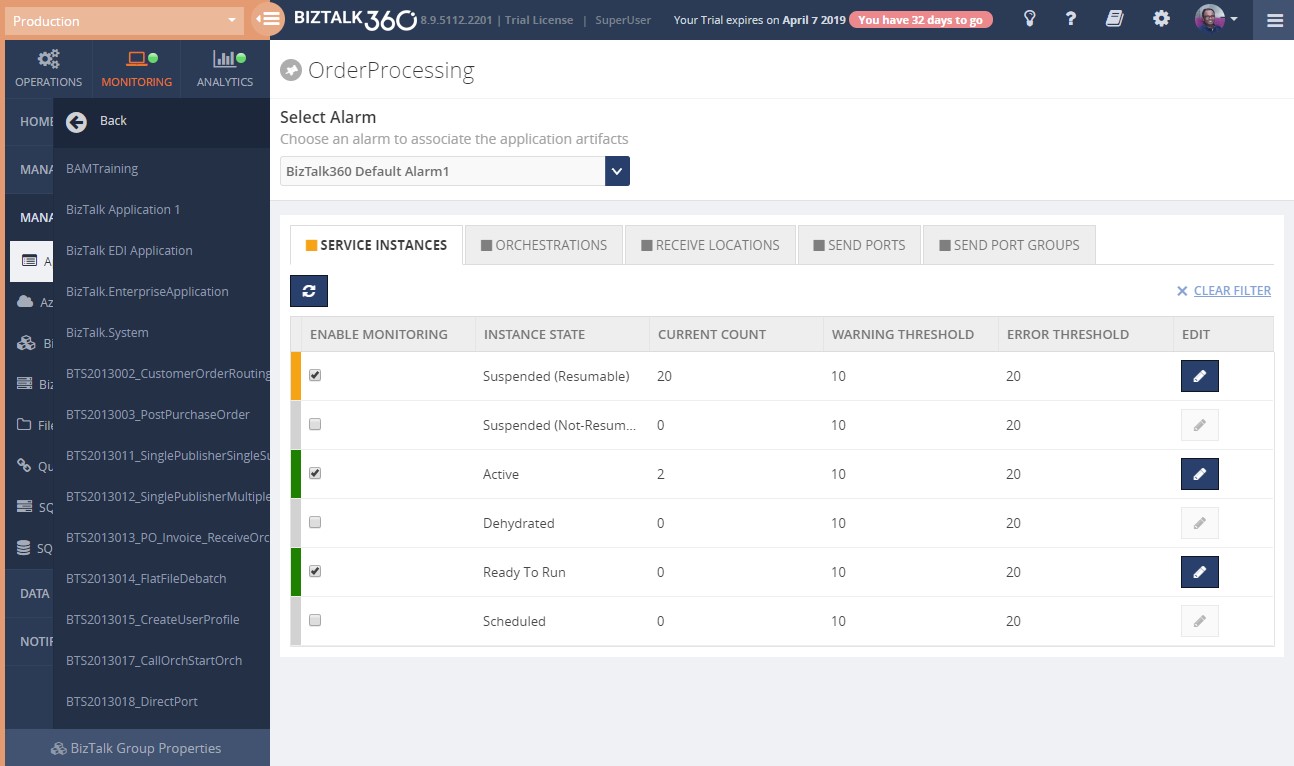
Custom widget to list all service instance details which are active for a long period
Custom Widget is one of the interesting and powerful features available in BizTalk360. With a custom widget, users can easily integrate third-party portals like Power BI, Sales Force or internal portals. You can also easily display Secure SQL Queries query results , monitor BizTalk Artefact statuses etc.
For instance, if a host instance is too busy to process all its associated service instances , then those instances will be in “Ready to Run” state until the host instance has available resources. When this situation remains for a longer timeframe, the service instances are going to get accumulated, thereby bloating the message box.
With the below script you can quickly create a custom widget to look up the number of service instances which are in the active state for a particular period of time. Say, the administrator can easily check service instance details which are in the Ready to Run or Active state for more than 15 minutes.
Creating such a widget, consists of the following steps:
- Create a Secure SQL Query
- Bind the SQL Query result to the custom widget
Both steps are described below.
1) Create Secure SQL Query
The below query retrieves the Service Instances which are in the Active state for more than 30 minutes.
DECLARE @dt DATETIME = ( DATEADD(MINUTES,-30,GETUTCDATE()))
exec ops_OperateOnInstances @snOperation=0 ,@fMultiMessagebox=0 ,@uidInstanceID='00000000-0000-0000-0000-000000000000', @nvcApplication=N'', @snApplicationOperator=0, @nvcHost=N'' ,@snHostOperator=0,@nServiceClass=111,@snServiceClassOperator=0,@uidServiceType='00000000-0000-0000-0000-000000000000', @snServiceTypeOperator=0, @nStatus=2, @snStatusOperator=1 ,@nPendingOperation=1 ,@snPendingOperationOperator=0,@dtPendingOperationTimeFrom='1753-01-01 00:00:00', @dtPendingOperationTimeUntil='9999-12-31 23:59:59.997', @dtStartFrom='1753-01-01 00:00:00', @dtStartUntil=@dt ,@nvcErrorCode=N'', @snErrorCodeOperator=0 ,@nvcErrorDescription=N'' ,@snErrorDescriptionOperator=0,@nvcURI=N'',@snURIOperator=0,@dtStartSuspend='1753-01-01 00:00:00', @dtEndSuspend='9999-12-31 23:59:59.997', @nvcAdapter=N'', @snAdapterOperator=0, @nGroupingCriteria=0, @nGroupingMinCount=0,@nMaxMatches=10,@uidAccessorID='*******',@nIsMasterMsgBox=0;
2)Bind the SQL Query result to a custom widget
You can create the custom widget and use below code. Don’t forget to include your environment details like the credentials of the BizTalk360 service account, etc.
<div id="WidgetScroll" style="top:30px;" data-bind="addScrollBar: WidgetScroll, scrollCallback: 'false'">
<table class="table table-lists">
<thead>
<tr>
<th style="width:30%">Application Name</th>
<th style="width:30%">Instance Id </th>
<th style="width:30%"> Service ID</th>
<th style="width:30%">Created Date</th>
<th style="width:30%">State</th>
</tr>
</thead>
<tbody>
<!-- ko if: (ServiceInstanceDetails()) -->
<!-- ko foreach: ServiceInstanceDetails() -->
<tr>
<td data-bind="text: nvcName"></td>
<td data-bind="text: uidInstanceID"></td>
<td data-bind="text: uidServiceID"></td>
<td data-bind="text: dtCreated"></td>
<td data-bind="text: nState"></td>
</tr>
<!-- /ko -->
<!-- /ko -->
</tbody>
</table>
</div>
<script>
// BEGIN User variables
username = ""; // BizTalk360 service account
password = ""; // Password of BizTalk360 service account
environmentId = ""; // BizTalk360 Environment ID (take from SSMS or API Documentation)
queryId = ""; // Id of the Secure SQL Query (take from SSMS)
queryName = ""; // Name of the Secure SQL Query as it is stored under Operations/Secure SQL Query
sqlInstance = ""; // SQL Instance against which the SQL Query must be executed
database = ""; // Database against which the SQL Query must be executed
sqlQuery = " " // The Secure SQL Query created in step1
bt360server = ""; // Name of the Server where biztalk360 is hosted
// END User variables
url = 'http://' + bt360server + '/BizTalk360/Services.REST/BizTalkGroupService.svc/ExecuteCustomSQLQuery';
ServiceInstanceDetails = ko.observable();
x2js = new X2JS({ attributePrefix: '', arrayAccessForm: "property", arrayAccessFormPaths: ["root.records.record"] });
ServiceInstanceDetailsList = function () {
var _this = this;
_this.getServiceInstanceDetails(function (data) {
var results = x2js.xml_str2json(data.queryResult);
if (Array.isArray(results.root.records.record)){
ko.utils.arrayForEach(results.root.records.record,function(item){
switch (item.nState){
case "1":
item.nState="Ready to Run";
break;
case "2":
item.nState="Active";
break;
}
});
_this.ServiceInstanceDetails(results.root.records.record);
}
else {
_this.ServiceInstanceDetails([results.root.records.record]);
}
});
};
getServiceInstanceDetails = function (callback) {
var _this = this;
$.ajax({
dataType: "json",
url: _this.url,
type: "POST",
contentType: "application/json",
username: _this.username,
password: _this.password,
data:
'{"context":{"environmentSettings":{"id":"' +
_this.environmentId +
'","licenseEdition":0},"callerReference":"REST-SAMPLE"},"query":{"id":"' +
_this.queryId +
'","name":"' +
_this.queryName +
'","sqlInstance":"' +
_this.sqlInstance +
'","database":"' +
_this.database +
'","sqlQuery":"' +
_this.sqlQuery +
'","isGlobal":false}}',
cache: false,
success: function (data) {
callback(data);
},
error: function (xhr, ajaxOptions, thrownError) {
alert(xhr.status);
alert(xhr.responseText);
},
});
};
ServiceInstanceDetailsList();
</script>
After you have created the custom widget and properly provided your environment details, it will look similar to the picture below.
We have written multiple articles about the capabilities of custom widgets, both in our blog, but also in the Documentation portal. You can check them out below:
Conclusion
It has been extremely beneficial to ensure the environment is healthy. With this custom widget you can easily get a clear insight about long running service instance details in a single view. If you have a particular scenario in which custom widgets could be useful, but you don’t know how to set this up, feel free to contact us at [email protected].
by Saranya Ramakrishnan | Jan 31, 2019 | BizTalk Community Blogs via Syndication
We always aim to constantly improve our product based on our customer feedback and the business needs of our customers. Keeping that in our mind, we add some significant features in every single release. In this blog, you can get to know about all the stimulating features we have shipped in our latest v8.9.5 release.
Quick Alarm
Are you new to BizTalk360? Now you can easily setup monitoring, just in a Single click by using a Quick Alarm.
The Quick Alarm feature has been brought into the product to give a unified experience to the user to easily set up monitoring. A Quick alarm is a consolidated alarm which selects a few artefacts from the BizTalk Applications and map them for monitoring, under various categories (Threshold, Data Monitoring, Health Check) .
Quick Alarms can be configured from Monitoring Dashboard and from Manage Alarm section just by providing the alarm name and email id. This configuration also takes care of SMTP setup if you have not yet configured it in your environment. So once a Quick Alarm has been configured, you will be notified through email if any monitoring violation happens.
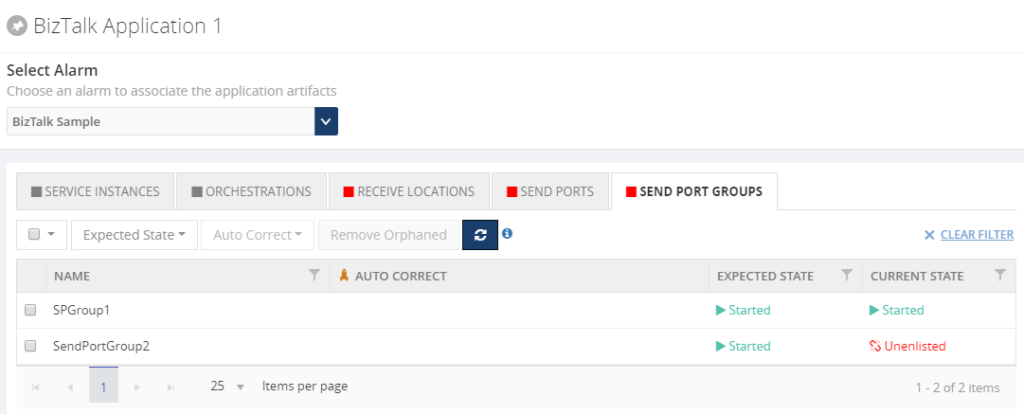
Send Port Group Operations
One of the powerful features in BizTalk Server is Send Port Groups, which help to route a single message to more than one destination.Send Port Group operations and monitoring is one such important feature we did not yet include in BizTalk360. At a point, we received a feedback from one of our customer “As they were not able to fully start/stop the applications from BizTalk360 when they have Send Port Groups configured ” .Hence, we have taken it for v8.9.5.
Now, you can perform operations such as start/stop/enlist/unenlist the Send Port Groups from BizTalk360. With this new capability it is possible to manage the operation of BizTalk applications (Start & Stop) for all the artifacts of each application in BizTalk360. This implementation makes the life easier for the BizTalk support engineers without context switching between BizTalk admin console and BizTalk360.
One of the main objectives for us from the security perspective is auditing. We have leveraged the governance and audit capability to capture all the activities of Send Port Groups performed by all the users within BizTalk360.
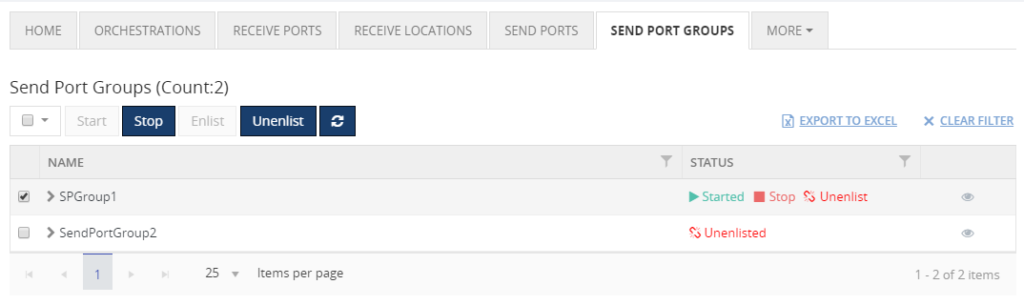
Send Port Group Monitoring
From the latest version, you can completely manage and monitor your Send Port Groups from BizTalk360. Create an alarm, map the Send Port Groups for monitoring by setting up the expected state. If any threshold violation occurs, you will be notified. You can also setup auto-healing for this monitoring; once the Send Port Group goes down, then BizTalk360 will try to auto heal it to the expected state.
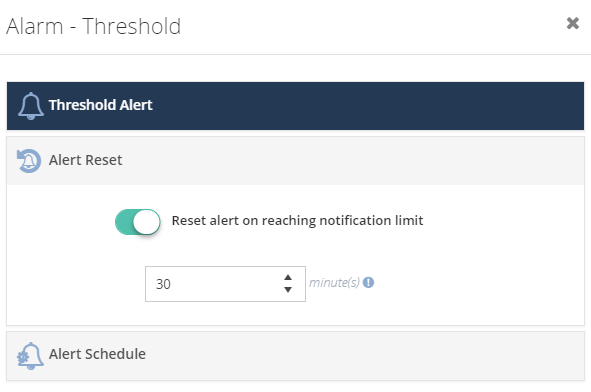
Alarm Auto Reset
We allow users to configure number of alerts to be triggered within stipulated duration if any threshold violation happens . When the configured alert reaches it limit ,it cannot be reset unless if the threshold violation resolves or user reset it manually .This is an impacting issue for some customers who monitor several artefacts under same alarm .In this scenario, when artefact 1 goes down, you will get notified with down alerts on periodic interval based on your configuration. Later no further notification will be sent when any other artefact goes down , since the number of alerts has already reached its maximum count .This problem is now resolved with the Alarm auto reset functionality, in which the alert counter will automatically reset after configured time. So, there is no chance of missing alerts when your artefacts are going down.
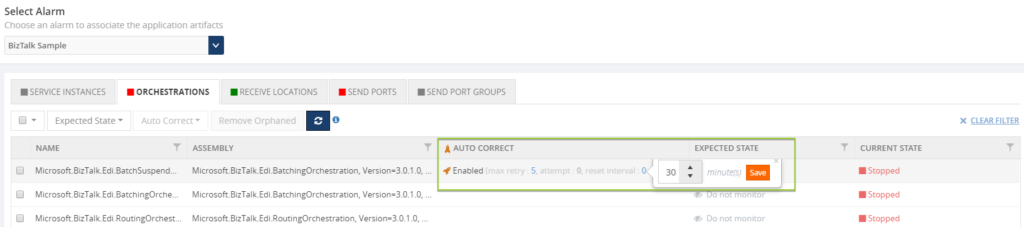
Auto Correct Reset
Auto healing is one of the dominant features available in BizTalk360. When you configured auto correct for your artefacts, the system will try to always maintain the expected state which you have set for those artefacts. When the artefacts state changes then the system tries to bring it back to the expected state. Here, the maximum retry is based on user configuration. So, what happens when it reaches the max retry count? It will not try to auto correct the state. To overcome this problem, we have introduced a new capability called Auto Reset. From this version on, the retry count will get automatically reset as per the user configuration (e.g.: 10 mins).
So when you configured Auto-healing for your artefacts, it is guaranteed the system will always try to maintain the expected state without any downtime with this new capability.
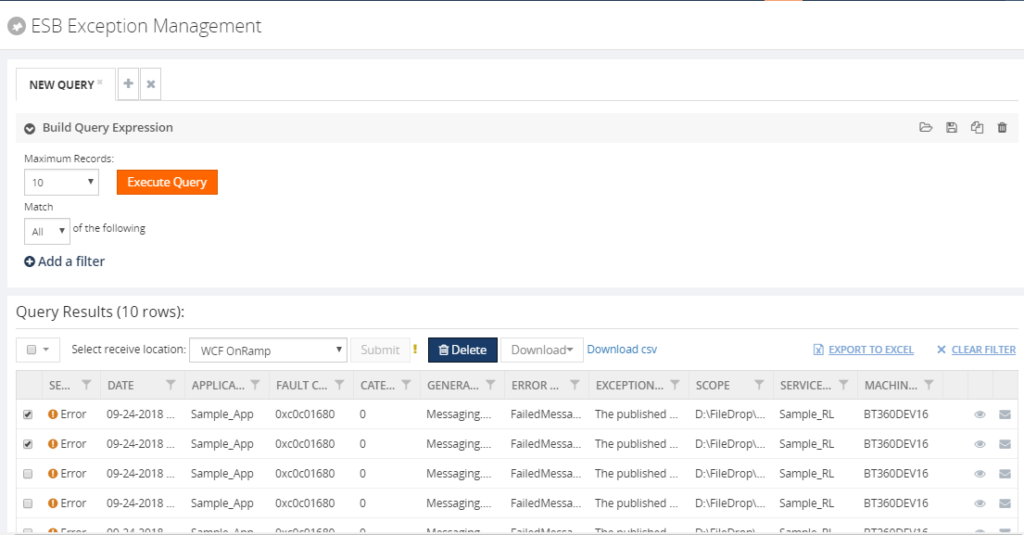
Delete ESB Fault Message
With the ESB Fault Delete functionality, you can delete the fault messages which are not important for resubmission.
Let us consider this scenario, a send port that you are using in your application fails unexpectedly, therefore both the service instance and the message become suspended and the fault information is written into the ESB exception database. Once the exception is corrected and resubmitted for further go, there may be two scenarios which will come into picture:
- Messages which are submitted successfully are residing in the ESB Exception database and are of no further use.
- Messages are rerouted to the ESB Exception database due to recurrent failure. In this specific case, the original message also available in the ESB portal.
In BizTalk360, we have introduced a new option “Delete” to clear the messages which are not required anymore. Additionally, all the deleted activities are audited in both Governance & Auditing and Live feed section to ensure the security.
Custom User Profile Templates
When we work on cutting edge technology, security is one of the important factors we always need to consider. When a new user is created, you can provide access to the corresponding features based on the roles of the user. Consider a scenario where the customer would need to provide similar permissions to multiple users. It could be very time-consuming to make the changes for every user. BizTalk360 made this process very easy for the users by introducing the capability to create custom profile templates. You can create a custom template with the desired features selected and choose the template while creating the users.

Few Enhancements and Bug Fixes
Besides these new features, we have also brought a number of enhancements and bug fixes.
Filter Operators Improvements
BizTalk360 has the capability to query the data from various databases to show important data such as Service Instance details, Tracked/Message service details, ESB and so on. To filter the data from the corresponding database, BizTalk360 provides rich Query Builder capabilities. From this version on, we have added few additional operators in line with the BizTalk Admin console for easy access to the data in both the Operation and Data Monitoring sections.
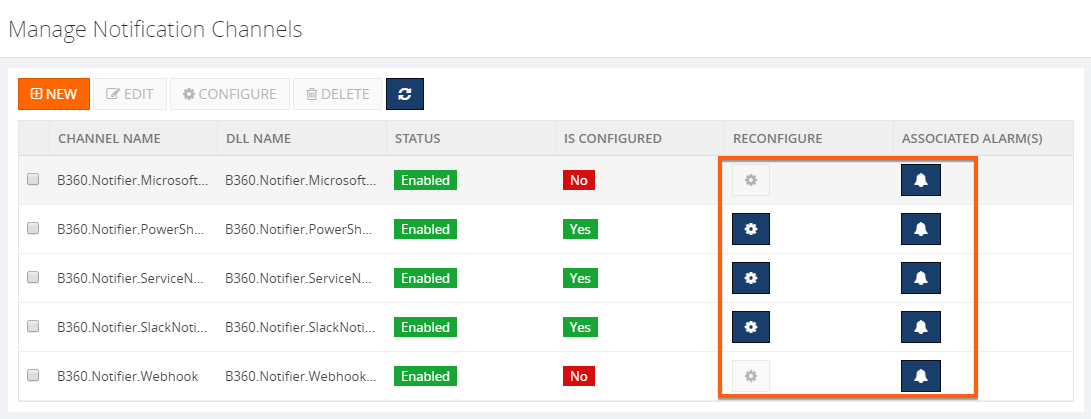
Notification Channel Improvements
Associated Alarm
Imagine a user wants to know about the mapping of a specific notification channel out of all the configured alarms in the environment. This was a tedious task in earlier versions of BizTalk360.
To get the quick status of the notification channel association with Alarms, we brought the new option “Associated Alarms” in the Setting side, to view all the mapped alarms in a single view.
DLL Reconfiguration
There was no option to reconfigure the notification channel, if any changes were made in the existing notification channel DLL. You need to go and change all the properties in all the alarms where the specified notification channel is mapped. Now, the reconfiguration process will be seamless from the UI without touching the database.
License Expiry Reminder
To provide an insight about the type of license and date of expiry , License expiry notification will be shown in UI for all the license types (Commercial, Partner & Product Specialist).
We have closed around 24 support tickets as part of fixing the issues in different areas. Please refer the Release Notes – https://docs.biztalk360.com/docs/v8951122201
Get Started Today !!!
Conclusion
Why not give BizTalk360 a try! It takes about 10 minutes to install on your BizTalk environments and you can witness and check the security and productivity of your own BizTalk Environments. Get started with the free 30 days trial.
by Saranya Ramakrishnan | Jan 17, 2019 | BizTalk Community Blogs via Syndication
Are you new to BizTalk360 ? Now you can easily setup monitoring just in a Single click!
The Monitoring capabilities are a key feature of BizTalk360. Setting up monitoring is a very easy and quick task. With a two-step process, you create an alarm and map the artefact(s) to be monitored. We wanted to make this much easier for our customers. So keeping that in mind we bring the new feature ‘Quick Alarm’ in our upcoming release v8.9.5 .
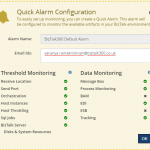
What is a Quick alarm?
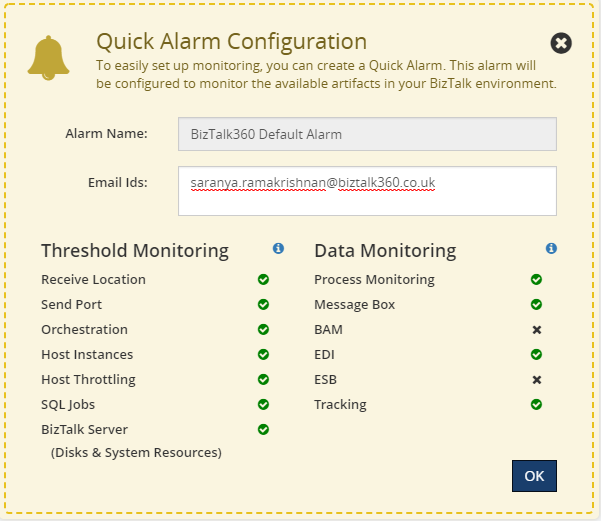
A Quick Alarm is a consolidated alarm which selects a number of artefacts from the BizTalk Applications, which are in the Start/Stop/Partially Started state, and map them for monitoring. Under various categories (Threshold, Data Monitoring, Health Check) a Quick alarm maps the following resources for threshold monitoring:
- Receive Locations
- Send Ports
- Orchestrations
- Host Instances
- Host Throttling
- SQL Jobs
- BizTalk Servers
For Data Monitoring (with basic filter configuration) the Quick Alarm is configured for:
- Process Monitoring
- Message Box
- Tracking
- BAM
- EDI
- ESB
Is a Quick Alarm different from normal alarms?
No, a Quick alarm is not all different from normal BizTalk360 alarms. Quick Alarms have been brought into the product to give an unified experience to the user to easily set up monitoring. A Quick alarm supports all the normal BizTalk360 alarm capabilities, like:
• Reset notification count
• Copy the alarm configurations
• Change status – Enable/Disable Alarm
• Once a Quick Alarm is configured it can be edited or deleted any time
Quick Alarm can be configured in 2 ways
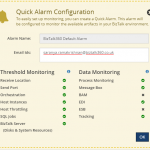
- From the Dashboard
When no alarms have been configured in your environment, you can configure a Quick alarm either from the general Monitoring Dashboard or from the Data Monitoring Dashboard.
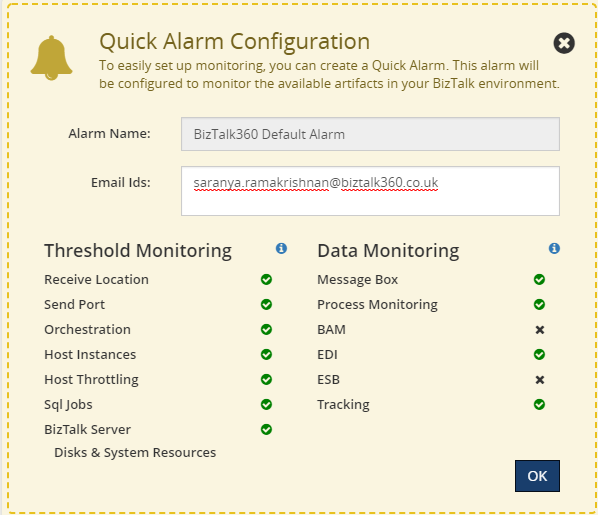 Quick Alarm Configuration
2) From the Manage Alarms section
You can also create a Quick Alarm from the Manage alarms section by selecting the ‘Quick Alarm’ button, even though you have already configured some alarms.
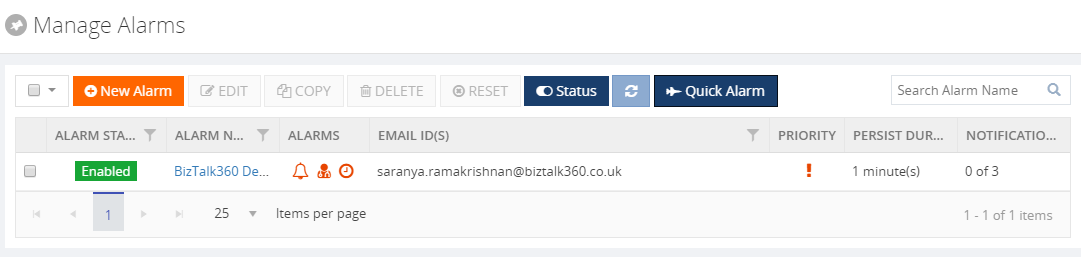 Configure Quick Alarm From Manage Alarm Section
Note: There is no restriction on the number of Quick Alarms you create. You can create any number of Quick Alarms in your environment. Though how many times you create a Quick Alarm with the same set of applications, it will always configure the same artefacts for monitoring.
Once a Quick Alarm has been configured you will be notified through email.
• If there is any threshold violation on the mapped artefacts
• Data monitoring alerts on every 15 mins
• Health check alert on 12 PM everyday
These configurations can be changed later at any point in time.
If in case BAM, EDI,ESB is not configured in the environment, the Quick Alarm configuration skips these and configure the rest of the resources for monitoring.
Who can create a Quick Alarm
A Quick alarm can be configured only by super users. This facility is restricted for normal and NT Group Users.
SMTP Configuration
If SMTP is not configured in the Settings side, the Quick Alarm configuration will automatically update the default BizTalk360 SMTP account.
Note: This default settings can be modified at anytime.
The Quick Alarm configuration will not modify/update anything if you have already configured your SMTP account. It uses your configured SMTP details for sending alerts.
Conclusion
A Quick alarm is an easy and fast way to set up monitoring of the most important artifacts of your BizTalk artifacts. Are you tired of constantly having to monitor your BizTalk environment in a manual fashion? Give BizTalk360 a try and take benefits of Quick Alarms. A trial version of BizTalk360 can be requested here.
by Saranya Ramakrishnan | Dec 5, 2017 | BizTalk Community Blogs via Syndication
Event logs are normally used to inform about an important event in the running applications and subsystems, which plays a vital role in troubleshooting problems.
While monitoring multi-server environments, how many times in a day does your administration team log in to multiple servers to check for the root cause of a problem? Have you ever thought of a tool that could help you avoid this time-consuming process? Yes, BizTalk360’s in-built Advanced Event Viewer (AEV) helps you solve this business problem.
Set-up AEV to retrieve the event data you want from your BizTalk and SQL servers in your environment and display it all in a single screen, where you can use the rich query capabilities to search and analyze the data.
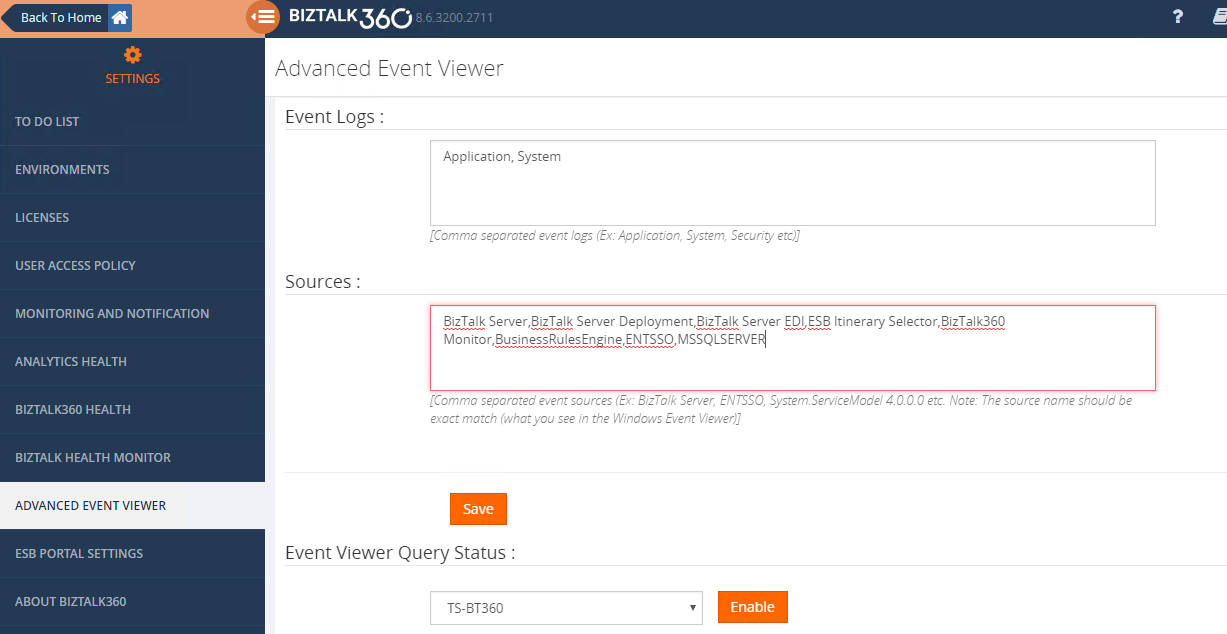
How to Set Up AEV in BizTalk360
As a first step, in BizTalk360 settings, you need to configure event logs and event sources that you want to monitor and then Enable AEV for the environment. Now the BizTalk360 Monitoring service will collect event log data for all the configured servers in that environment and store it in BizTalk360 DB.
What ‘s new in v8.6?
BizTalk360 already supports AEV in operations and monitoring section for a long time. While demonstrating BizTalk360 to customers, we asked for “How to monitor a specific event occurring in BizTalk environments on a specific frequency and get an alert based on Threshold conditions”. So, keeping that in mind we have implemented Event Log Data Monitoring in version v8.6.
Let us take this complex scenario to understand more about Event Log Data Monitoring.
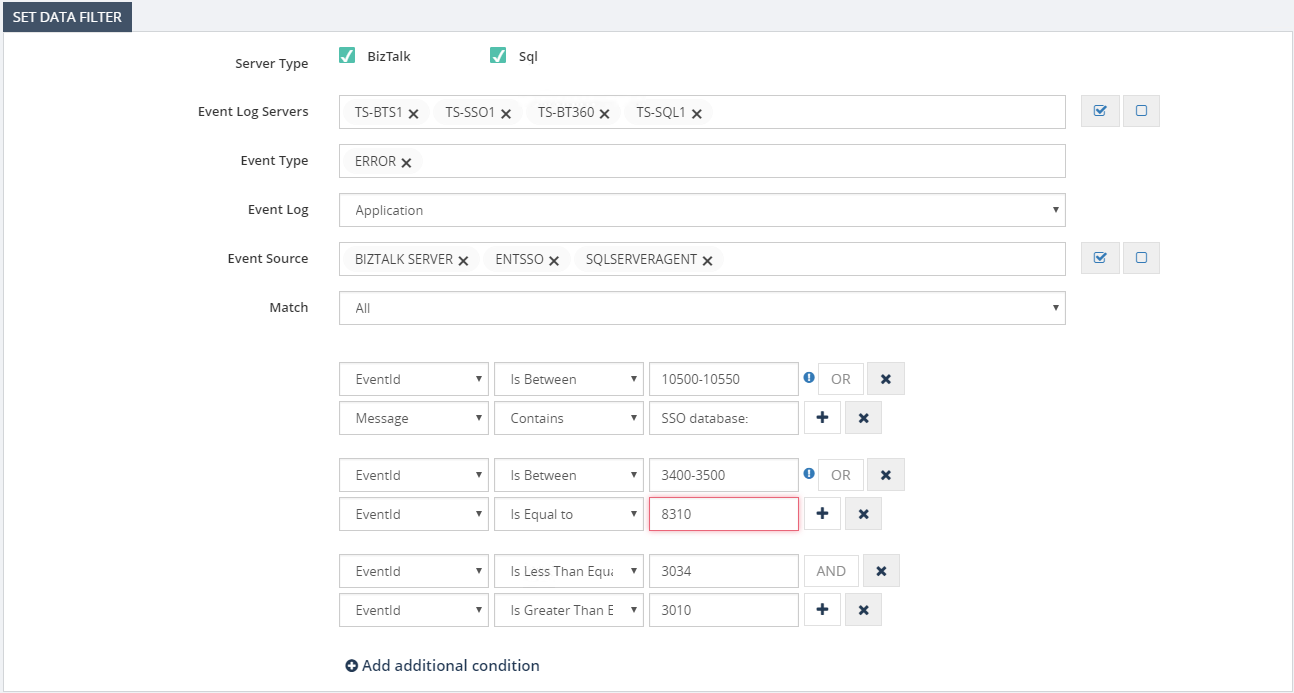
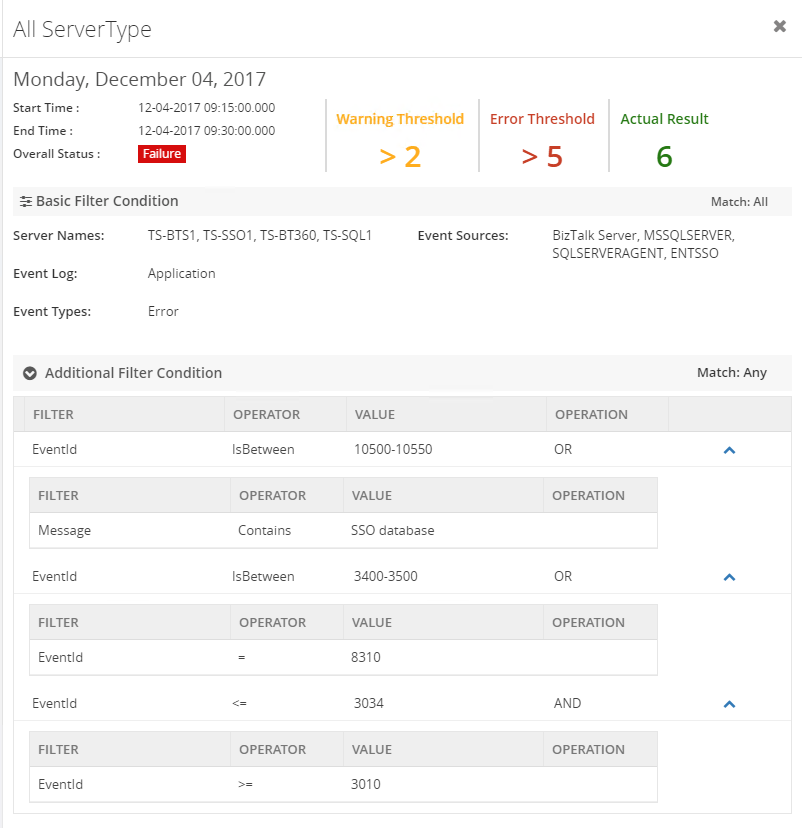
Scenario1: User wants to monitor different event logs for multiple servers. Example: If an administrator wants to monitor ESB events from BizTalk server and also wants to ensure there is no problem in SQL servers and also to monitor ENTSSO events form SSO server.
Start Monitoring Event log Data in 3 Steps:
- Enable AEV for an environment
- Create a Data Monitoring Alarm
- Create a schedule under event log and configure the rich filtering conditions based on your business needs as below.
Server Type : BizTalk, SQL
Server Names :BizTalk Server ,SQL Server,SSO Server
Event Type: Error
Event Sources: ESB Itinerary Selector, ENTSSO , MSSQLSERVER,

And group (All these below conditions are true)

Event ID Greater than or equal to 3010
Event ID Less than or equal to 3034
Message Contains 'ESB.ItineraryServices.Generic.WCF/ProcessItinerary.svc'

EventID IS Between 10500-10550
Message Contains ‘SSO Database’
When we looked in more detail, it would normally take us into running a filtering query against configured event sources in servers and alert them when certain conditions are met.
Scenario 2: To detect the same event occurring on different servers. For example, when a certain instance of an orchestration is firstly executed on server 1 and throwing a certain error and next to another instance of the same orchestration throws the same error, while the instance becomes executed on server 2, this will now easily be detected with event log data monitoring.
BizTalk360 brings all these data into a single console and on top of that provides a powerful capability to set alerts based on various thresholds.
You can also set how frequently you wanted to run the queries based on their business requirements such as the frequency of daily validations (ex every 15 mins, 1 hour etc), end of business day or even monthly events such as month-end processing. With these thresholds, the result from the query will be evaluated and in case of any threshold violation, you will be notified via notification channels/Email.
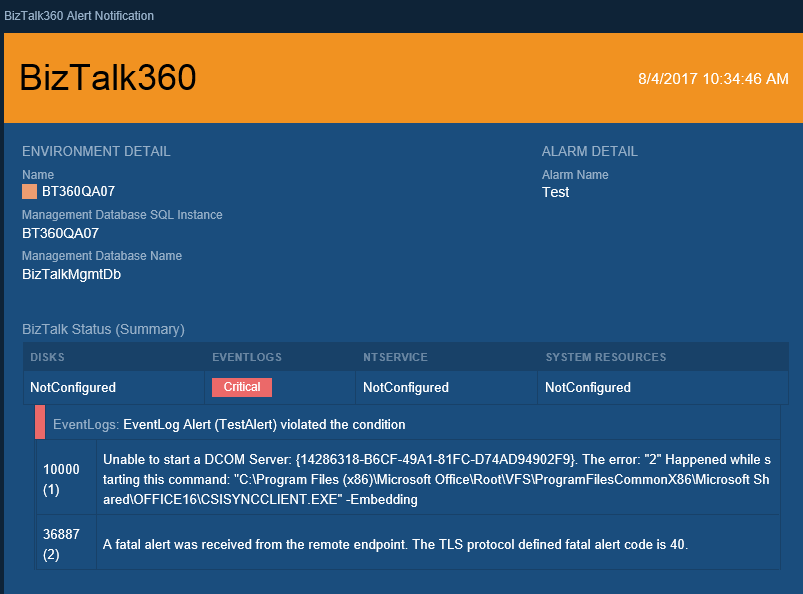
Event Log Details in Alerts
Event Log Details will be listed in alerts by enabling the option ‘Send Event Log details in Mail’ while creating the schedule.
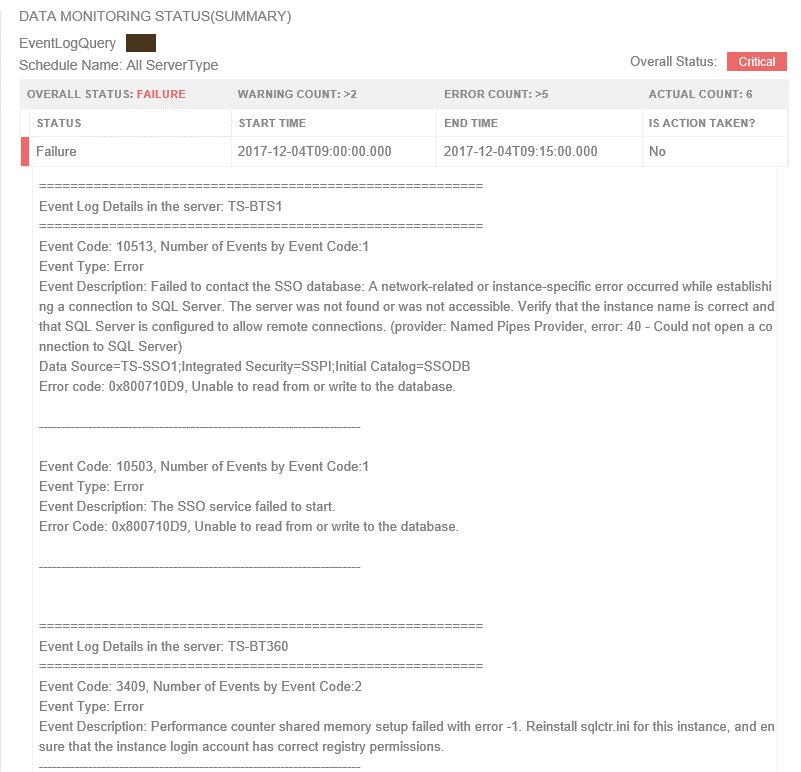
Event Log data in the Data Monitoring Dashboard
Also, the information will be visible on the Data Monitoring dashboard, you can visualize the day calendar view. If you need to understand what happened for an execution, you can click on one of the entries in the day view of the dashboard and view the details as shown below.
Note :
- Maintenance is very simple, once after scheduling event log data monitoring, when you disable AEV for the environment, it will stop collecting Event Log data.
- And you don’t Worry about data growth, BizTalk360 purge policy will take care of it.
- Apart from monitoring BizTalk specific SQL server, you can also monitor other SQL servers simply by adding SQL server names for monitoring in the settings section.
by Saranya Ramakrishnan | Aug 7, 2017 | BizTalk Community Blogs via Syndication
Monitoring and Alert notification is one of the core functionality in BizTalk360. To empower better usability of a user, we have improved the alert notification in the latest release v8.5. The enhancements are typically chosen from our customer feedback based on the impact and the number of requests.
Event Log description:
Event logs can give the early warning of impending system issues and save you from unexpected disasters. It is quite important to monitor the event logs regularly to get proper insights of any windows servers.
BizTalk360 has ‘Advanced Event Viewer’ functionality in which BizTalk360 Monitoring services collect the data from event logs from defined event sources of multiple servers. And the same can be monitored with respect to event log type (Application, Security, System, Windows PowerShell etc…), event sources of each event types and also with the specific event id and texts by configuring threshold conditions.
The best way to monitor event logs is to choose a solution that reports the Windows Event ID as well as the error message. Considering this ideology, we enhanced this in 8.5 release, so that event log will be alerted along with the description. This feature is also enabled with the filter on the number of event logs and size of the description (up to 5000 characters) in the system settings. Now user can get clear insights on any events occurred in the configured BizTalk or SQL server.
Event log monitoring can be done in few easy steps
- Enable Event Log Monitoring in Setting->Advance Event Viewer section
- Define Email Event Log Description character count and List Count in system settings
- Configure Monitoring Threshold conditions for event log monitoring.
Migration Scenario: To use this, the user needs to define the list count and description character count in system setting. By default, the values will be zero after migration.
Data Monitoring alerts in Notification channel
Data Monitoring is one of the powerful features in BizTalk360 which run queries against multiple data sources in BizTalk which include: Message Box Queries, Tracking Queries, BAM Queries, EDI Queries and ESB Queries, Logic Apps based on the configuration how the user wants to monitor data in each of these sources.
Previously Data Monitoring alert can be sent only through static notification end points like SMS, Email, Windows Event log and HP Operation Manager. From v8.5 we have extended custom notification support for data monitoring alert. Using this functionality, the users can get Data Monitoring alert from various external systems like Slack, ServiceNow, Web Hook and they can also build their own custom notification channels to any external systems.
To use this functionality user need to configure notification channel in setting side and enable the same in Data Monitoring alarm.
Migration Scenario: User need to enable Configured Notification Channel in Existing Data Monitoring Alarm to get Data Monitoring alert on custom notification channels.
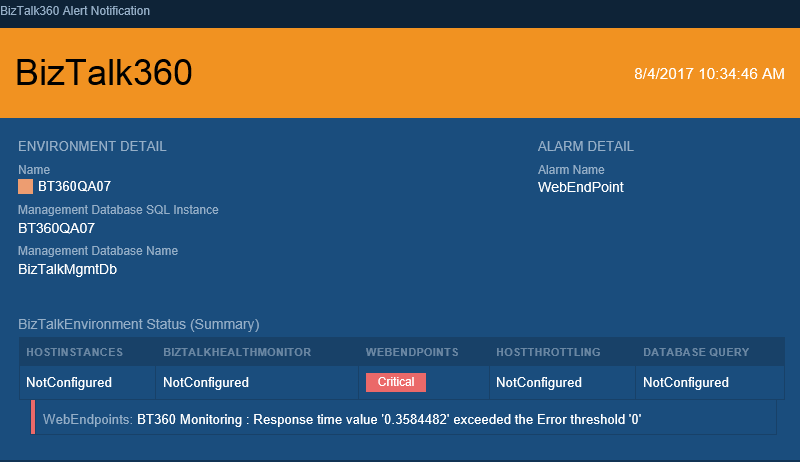
Web Endpoint Monitoring Enhancement
We have web endpoint monitoring (ability to monitor any HTTP based URL’s) for very long time in BizTalk360, right from 6.x. In fact, this is one of the key monitoring component used by a lot of our customers. Web endpoint monitoring allows you to monitor the health of any HTTP based web service. You can monitor:
- Response status codes
- Response Keyword, XML, JSON
- Response Time
You can configure BizTalk360 to trigger an alert notification if the response value is not matching your requirement. We have done following improvements on web endpoint monitoring alerts.
- Many customers suggested to include the endpoint name in an alert email, alert history and also in monitoring graph to easily identify which endpoint has gone down in case of multiple web endpoint configured for monitoring.
- Also Expected Return code and Response Time Alert details are included in alert for more insights.
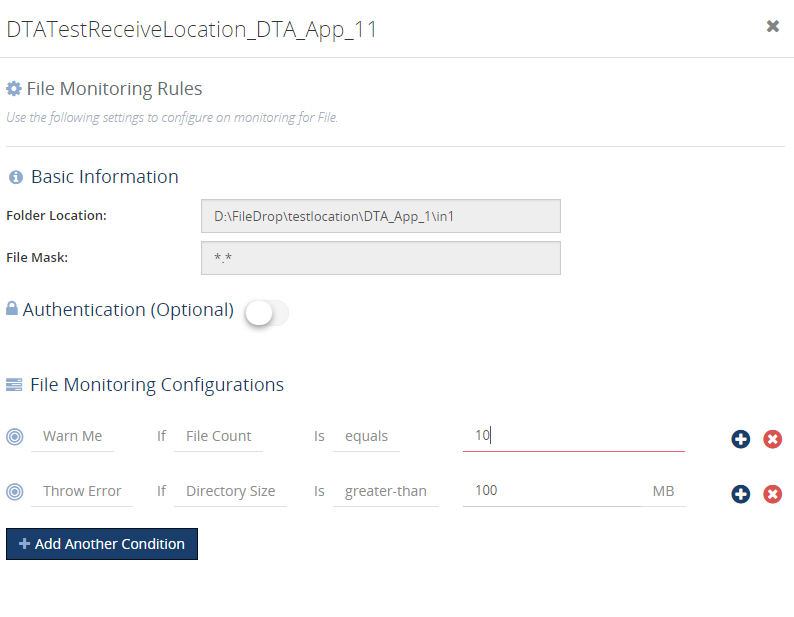
Folder Size Monitoring
In BizTalk360 version 8.4, we introduced the capability of folder monitoring which monitors the file count for File Locations (File, FTP and SFTP) configured in BizTalk artifacts. From 8.5, we are supporting directory size monitoring for file locations which actually monitors the size of entire folder irrespective of file mask. (i.e) the folder may contain various file types XML, txt, png etc but the configured file may be either one of this type so here, folder size means entire folder with all the file types.
With in 2-3 clicks, the user can configure monitoring threshold conditions for folder size and start monitoring and get notified as and when folder size increases/decreases.
Conclusion
BizTalk360 enhances the complex administrative tasks into a modern easier task. This version of 8.5 is being added with more features thinking from a usability perspective of our customers. BizTalk360 continues to provide more such features considering the feedback from our customers and stay tuned for next version.
by Saranya Ramakrishnan | Feb 10, 2017 | BizTalk Community Blogs via Syndication
Azure Logic Apps play a vital role in an integration platform. Keeping this in mind, we introduced ‘Azure Logic Apps Monitoring’ in BizTalk360 Version 8.1. In Version 8.3, we implemented ‘Azure Logic Apps Operations’ capability to improve the ease of use for users using Logic Apps and BizTalk360. With this functionality, users can Operate, Manage and Monitor Azure Logic App(s) from a single place. When you see a threshold violation of Logic Apps, you can rectify the problem from the BizTalk360 UI itself. You can save time to log in to the Azure Portal and manage your Logic Apps.
All the user needs to do to configure Logic Apps Operations capability is to add the Azure subscription in BizTalk360 UI and enable it for monitoring and operation. BizTalk360 also provides an option to work on multiple subscriptions simultaneously. Therefore, by adding the subscription in BizTalk360, users can view the list of available Logic Apps in that subscription along with its name, Access End Point, the current Status (Enabled or Disabled), Last Run, and other details such as Resource Group, Location, Run and Trigger history details and Success/Failure Run count.
Features of Logic Apps Operations
Enable/Disable Logic Apps: From BizTalk360 UI, users can enable/disable the Logic Apps that reflects the corresponding Logic App in the Azure Subscription. You can initiate bulk operations — enable/disable multiple Logic Apps in a single click.
Run Trigger: User can also trigger the Logic App action from the BizTalk360 UI. This action also supports the bulk operations.
Delete Logic Apps: User can delete single or multiple Logic Apps through a single click from BizTalk360 UI.
Note: The Azure Portal UI allows to operate (Enable/Disable, Delete, Run Trigger) on only one Logic App at a time, whereas from BizTalk360 UI user can initiate bulk operation (select multiple logic apps) in a single click.
Run and Trigger History details
Data like History and Runs are huge when it comes to real time scenarios/production use. For each Logic App, Run and Trigger history will maintain the last 30 records. The history details will be displayed in both list and graphical View.
List View
- Start and End time of Run/Trigger. Here the time format and time zone is based on user profile configuration.
- Run/Trigger status such as succeeded/failed, running/skipped/aborted
- Duration of each Run and Trigger
Graphical View
We have simplified the UI view of your Logic Apps details and redefined Runs and Trigger history into Graphical representations. With the graphical view, it becomes easy for the users to navigate and identify the date and time tracking.
The graphical view chart shows Logic Apps Runs in the “Y” axis and Date in the “X” axis. All basic graph operations such as zoom, hover are available in the graphical view. Additionally, you can print/download the chart.
Success and Failure Run count
Based on colour coding, you can know the Success and Failure Run counts instantly within the detail window of your Logic App.
Trigger and Action Status
Users can see the actual design of the Logic App in the Details View, say when it should be trigger and which actions are to be performed.
E.g : Trigger ‘When_a File_Is_created ’ ; Action – Email_File .
Licensing
If you are an existing user of BizTalk360, and using the Platinum tier license, you just need to upgrade to BizTalk360 Version 8.3 to use this feature. For customers using other licensing tier, if you would like to use/try this feature, please send an email to [email protected] to customize your license.
If you are new to BizTalk360 and like to explore the Logic Apps Operations capability, you can get started with the 14 day free trial of BizTalk360.