If everything is a peaceful and relaxing environment, then something is wrong
Introduction to BizTalk360
BizTalk360 has been around for more than a decade in the field of BizTalk Server Administration and Monitoring. This blog shows users how they can streamline their day-to-day monitoring. Besides providing full coverage of your BizTalk Server Monitoring, BizTalk360 also fulfils many other functions. Let us see this in detail.
BizTalk Server Monitoring tools
In this section, you can get a deeper understanding of what you can monitor with BizTalk360.
Application and artifacts monitoring
Host Instance Monitoring
Host Throttling
EDI (Electronic Data Interchange) Agreement Monitoring
Database size
Event Log Monitoring
Event Log Data Monitoring
File Location Monitoring
Queue Monitoring
BizTalk & SQL Server Monitoring
SQL Job Monitoring
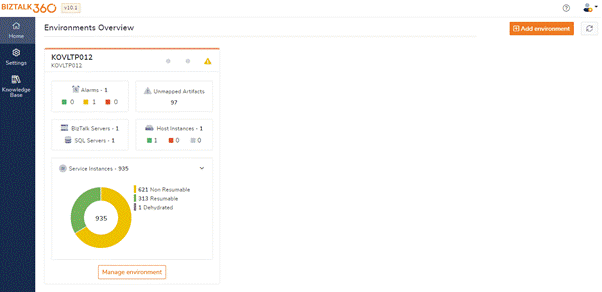
Application and artifacts monitoring
BizTalk360 automatically shows the applications that are deployed in the BizTalk Server environment at hand. All state-based applications artifacts can be monitored, including:
Orchestrations
Receive locations
Send ports
Send port groups
Users can set the expected state of those artifacts. When there is a mismatch between the actual and the expected state, BizTalk360 sends you an email, or a notification to any of the systems such as:
Microsoft Teams
Slack
ServiceNow
PowerShell
Webhook
Twilio
PagerDuty
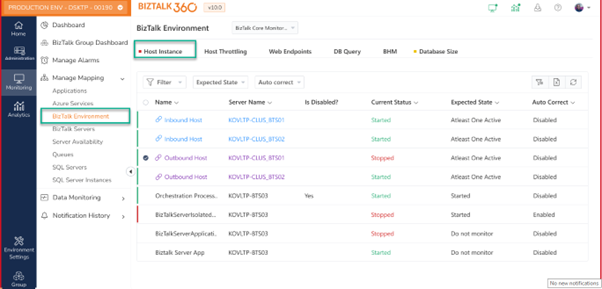
Host Instance Monitoring
In BizTalk, messages can only be processed when the host instance is running. BizTalk360 allows users to manage and monitor BizTalk Host Instances. Additionally, BizTalk360 can also monitor clustered host instances. To learn more about clustered host instances, follow the link.
Host Throttling
Microsoft does not provide any tool to understand whether your BizTalk environment is working efficiently or under throttling conditions. It is typical for administrators to use Windows Perfmon to add all the performance counters associated with throttling and then analyse throttling conditions. This requires extensive knowledge of how the BizTalk Server works, various throttling counters & conditions, whether it is running at an optimum level, etc.
Setting up Host Throttling monitoring in BizTalk360 is just a 5-minute process, where users can monitor the following:
Rate throttling
Process memory
System memory
Database size
Database session
Thread count
User override
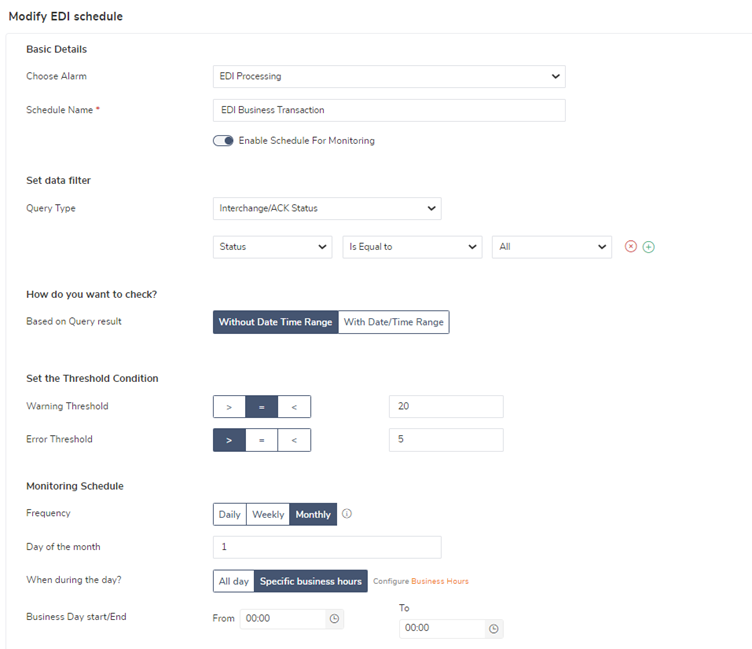
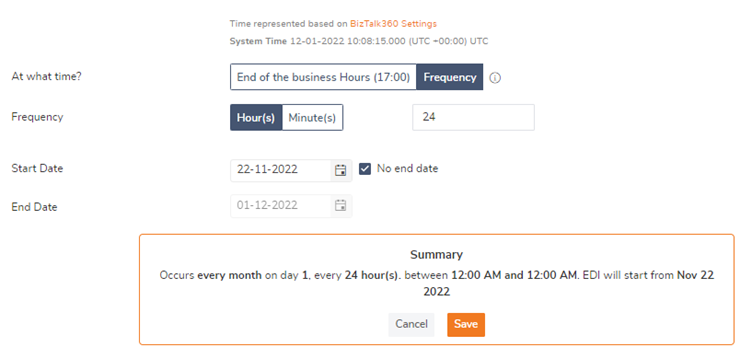
EDI agreement monitoring
Any business trading partners commonly exchange data electronically through EDI. For successful transactions, it is important to maintain the agreement state. Via BizTalk360, users can monitor the states of EDI Agreements.
Database size
For a healthy BizTalk environment, it is essential to monitor the growth of the BizTalk databases. With the Database size monitoring feature, users can monitor the database and log the file size of the BizTalk and BizTalk360 databases. Follow the link to learn more!
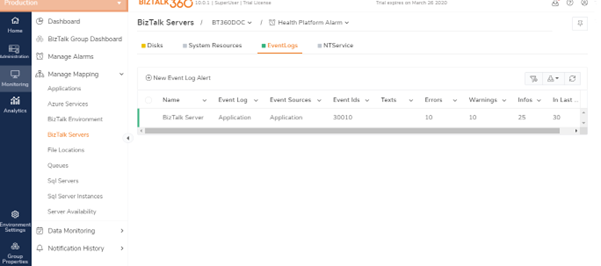
Event log monitoring
What happens when your Windows server gets booted without your knowledge? It may be a good idea for users to check if everything is still in good shape. Without a monitoring product, it requires manual intervention to be aware of the reboot. Wouldn’t it be more convenient if there was a tool to monitor your Event log entries?
BizTalk360 comes with a feature named Event log monitoring that enables users to be alerted about specific events being written to event logs in your BizTalk or SQL servers.
There is also another type of monitoring, which is Event Log Data Monitoring where users can configure a specific value based on conditions. Follow the link to know more.
Before moving on to the next topic, it is helpful to know the difference between Event Log and Event Log Data Monitoring. Let us say you have multiple BizTalk servers and want to correlate and monitor event IDs. In such a scenario, Event Log Data Monitoring will be helpful whereas, in Event Log Monitoring, you need to create two event logs to monitor different event IDs.
Event Log Data Monitoring
BizTalk administrators look first for the Event Logs when something unexpected happens since the Event Viewer contains the exact error information. Logging in each time to the BizTalk and SQL servers to check the event logs would be cumbersome. When BizTalk360 event log data monitoring is enabled, it is easy to check for event logs. You can get the log message count as well as event log message information in the alert email.
Wouldn’t it be helpful if we see all this information in one place? Yes, BizTalk360 provides you with this option where data can be filtered with more options and conditions. An additional filtering option is that the event logs can be filtered based on multiple event ids.
File Location monitoring
BizTalk360 lists all the locations configured in the BizTalk artifacts (Send Ports and Receive Locations) for the Transport types (File, FTP, SFTP) respectively, which helps users to monitor all the File Locations mapped with Receive Locations/Send Ports.
Queue Monitoring
BizTalk360 monitors the health of the IBMMQ and MSMQ along with other parameters, including Queue Size, Active Messages, Dead Letter messages, and Journal Messages. Monitor your local and remote queues and set threshold conditions to get notified of any violations.
SQL Jobs Monitoring
BizTalk Server heavily relies on SQL Server databases. The health of these databases is crucial for the health of the BizTalk Server. Out of the box, BizTalk Server comes with several SQL Server jobs that perform all kinds of maintenance tasks, thereby contributing to the health of those databases. BizTalk360 allows you to monitor those SQL Jobs.
BizTalk & SQL Server monitoring
This feature helps the users to monitor the availability of
Disk space
CPU and Memory usage
Event Log entries
Windows NT Services
Azure Serverless Monitoring
To support hybrid integrations, BizTalk360 becomes aligned by supporting Azure Serverless technologies. Hereby, the product prevents you from switching between BizTalk360 and the Azure portal. Let’s see what Azure Services can be monitored by BizTalk360:
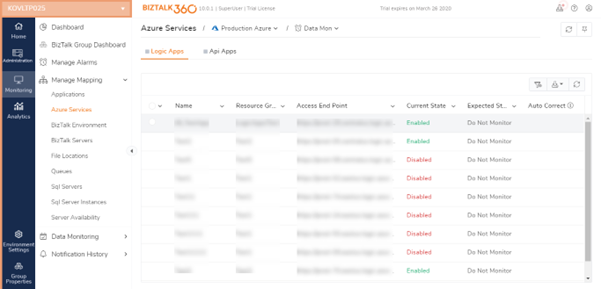
Azure Logic Apps
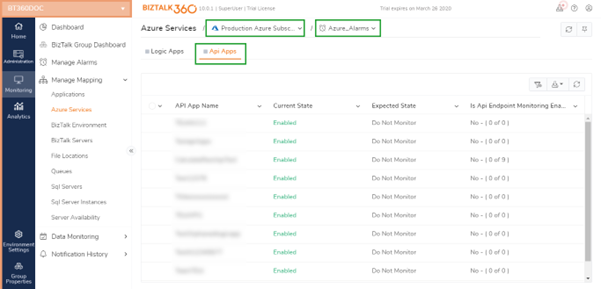
Azure API (Application Programming Interface) Apps
Azure Logic Apps
With BizTalk360, Logic Apps can be monitored and ensure they are running correctly. You will gain deeper insight into when the expected number of runs is met and the number of failures that occur.
Azure API apps
Users can monitor the health of their API apps and the configured endpoints. Monitoring API apps includes endpoints and provides a seamless monitoring experience.
Azure Service Bus Queue monitoring
Azure Service Bus allows applications and services to communicate with other applications in the cloud, on-premises, or both and ensures message exchange occurs smoothly. With BizTalk360, configure alarms for various parameters like
Queue Size
Status
Messages
Active Messages
Scheduled Messages
Transfer Messages
Dead letter Messages
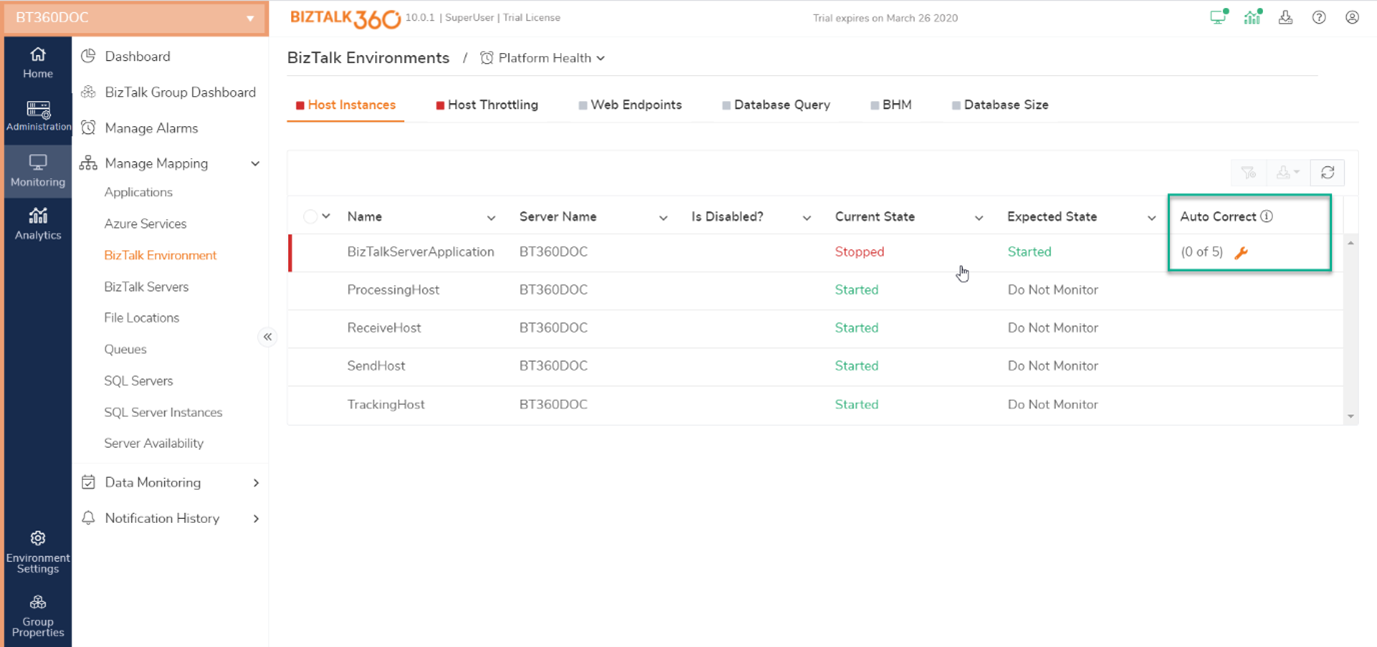
Auto Correct
Administrators can set up monitoring on “State-based” artifacts and let the monitoring service automatically heal the artifact at any time. For example, administrators can monitor the receive locations of applications and set up auto correct functionality for the Expected state of the artifact. Whenever the receive location goes down or gets disabled, there will be a mismatch and the auto correct will try to bring the artifact back to the Expected state within the next monitoring service cycle. The feature applies to the following artifacts:
Send ports
Send port groups
Receive locations
Orchestrations
Host Instances
NT Services
SQL jobs
Logic Apps
EDI Agreements
Pricing Structure of BizTalk360
There are one-year and three-year subscription options available for BizTalk360. Depending on the number of BizTalk servers in the BizTalk group, the BizTalk edition (Standard or Enterprise), and the BizTalk360 feature-based license tier (Silver, Gold, Platinum), users will pay a different license fee. A license comes with unlimited users and unlimited customer support, also users can customize their license according to business requirements. A free trial is also available.
If everything is a peaceful and relaxing environment, then something is wrong
The BizTalk360 team is always there for customers when they need Product support. They frequently reach out to each customer, to update them on the latest release, and to make sure they are using the product to the fullest.
Ask for Support
When setting up BizTalk360 monitoring, you are not alone. Whenever you have a problem, the BizTalk360 technical support team is there to help. They are knowledgeable about the product and can share their experiences with other customers as well. Directly ask them to review your setup before it fails, and you find out it was set up incorrectly.
Documentation Help
It is crucial to document exactly how users have set up their business requirements and assist team members in the future. In BizTalk360, users can easily locate any information they need through the documentation portal.
Demo & Free Trial
Currently the product contains over 80 features, but Product Consultant team of BizTalk360 provides a fully customized product demo based on business needs, so please do contact the support team without any obligation. Users can either request a demo or take a free trial.
Introduction
BizTalk Server Monitoring tools
Azure Serverless Monitoring
Pricing Structure of BizTalk360
If everything is a peaceful and relaxing environment, then something is wrong
After twelve years of working as a BizTalk Server consultant in The Netherlands and working with BizTalk360 at his customers, Lex Hegt joined Kovai.co/BizTalk360 in 2016. We interviewed Lex about the life cycle of the BizTalk Server and why BizTalk360 is needed more than ever.
Do you think Microsoft BizTalk Server 2020 is a game-changer?
Yeah, especially with Microsoft’s announcement about extending support for BizTalk Server to 2030, you can consider BizTalk Server 2020 as a game-changer. It gives customers the confidence that until that time, they don’t need to be worried about receiving support when that would be required. Also, when customers migrate from an older version of BizTalk Server, like 2013 (R2), the new cloud-connectivity capabilities open a wealth of new possibilities and integration scenarios.
What do you think about BizTalk Server 2020 and Microsoft’s end-of-support announcement?
Microsoft recommends organizations move to the cloud for their integration platform. Their announcement could mean that we won’t see the release of a newer version of BizTalk Server anymore. However, at least this gives existing (and even new) customers confidence that until the end of this decade, they won’t run unsupported with their BizTalk Server environments.
Please share some thoughts on the BizTalk Server end of life.
Although the future of integration is in the cloud, it still happens that organizations choose BizTalk Server as their integration platform. Reasons for selecting an on-premises platform include organization or industry strategy, or most integrations are happening on-premises. However, Azure Serverless is very powerful and winning in popularity. So, we expect that BizTalk Server will still be around for several years but will slowly fade away. Given the limited offerings in the market, it makes even more sense to use a powerful product like BizTalk360 to run your BizTalk environments more efficiently.
Do you think Azure can be a replacement for BizTalk Server?
Both platforms have a lot of similarities and capabilities, but each platform also has its strengths and weaknesses. In the end, we choose a platform based on the requirements. We don’t expect many new developments in BizTalk Server, while Azure Serverless gets stronger and richer every single release cycle. Over time, Azure Serverless also supports features not available in BizTalk Server, making Azure Serverless the better choice as an integration platform. Although there still is a place for BizTalk Server, it will fade to the background.
What is the ultimate advantage of using BizTalk360 for a BizTalk Server user?
BizTalk360 has over 80 features focused on streamlining your BizTalk Server operations, administration, and monitoring. Some of them are technically focused, and some of them are business-focused. Out-of-the-box BizTalk server comes with BizTalk Admin Console for everything, from development, deployment, support, operations, configuration changes, diagnosis, etc. It is a potent tool in some aspects, but it is very weak in certain aspects, especially around user security access, governance, auditing of who did what in the environment, etc. Our goal here at BizTalk360 is to provide one solid tool to solve all the operational and monitoring pain points that arise once your BizTalk applications get to production.
App registrations is a mechanism in Azure AD allowing to work with an application and its permissions. It’s an object in Azure AD that represents the application, its redirect URI (where to redirect users after they have signed in), its logout URL (where to redirect users after they’ve signed out), API access and custom application roles for managing permissions to users and apps.
As a matter of fact, through an app registration, you can restrict access to an application to only a specific group of users, if needed. An example of this is a solution I built a few years ago where we had two separate apps: a customer-facing app and a management app. Each had its app registration. I’ve restricted access to only a select group of people responsible for managing the system for the management app.
Associated with an app registration is a service principal, which is the identity of that application. As you undoubtedly know, a service principal has credentials. However, you may not know that these credentials have an expiry date (end-date). If you’re not aware of that and don’t monitor and manage that, you may end up with applications and services that stop working.
The Microsoft identity platform handles identity and access management (IAM) only for registered applications. Registering an application creates trust between the application and the Microsoft identity platform.
The trust is unidirectional which means that the registered application trusts the Microsoft identity platform, but not the other way around.
In Azure AD, applications can be represented in two ways:
Application objects – Application objects define the application for Azure AD and can be viewed as the definition of the application. This enables the service to understand how to issue tokens to the application based on its settings.
Service principals – The instance of the application in the user’s directory that controls connections to Azure AD is known as a service principal.
Monitoring
Serverless360 is an out-of-the-shelf platform to keep track of the expiration of client secrets for specific app registrations and delivering notifications prior to the expiration date, prompting you to renew it.
Navigate to the Monitoring section of the resource to specify the number of days before which the expiry alert must be received, that’s pretty much the user has to configure and the rest of the work the platform will take care for you.
Can you achieve the same from the Azure portal?
In this section, we’ll see how we can define an Azure Automation runbook that we can run periodically to detect and get a list of those credentials that are either expired or about to expire.
Setting up the automation runbook
Creating an Azure Automation runbook can be done through the Azure portal or a CLI. We’ll show the portal way here.
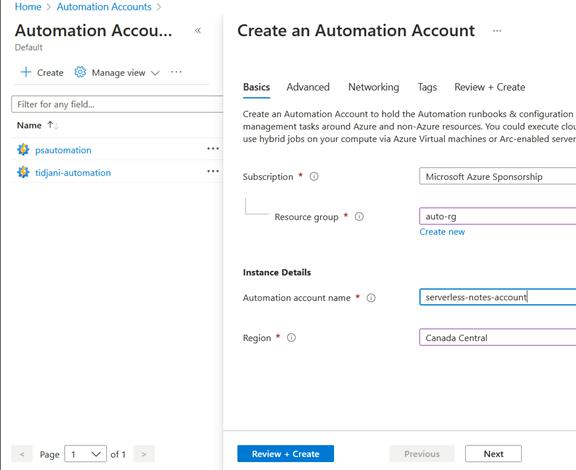
We first start by creating an Automation account. In the Azure portal, look for “Automation accounts”, then create a new instance:
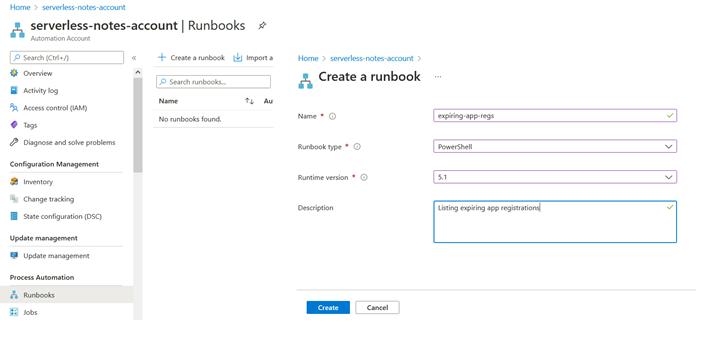
Once the account is created, we need to make a runbook (Use an Automation account to do many tasks where each runbook will handle a given task).
Go to the “Runbooks” section, then click “Create a runbook” and enter the requested information
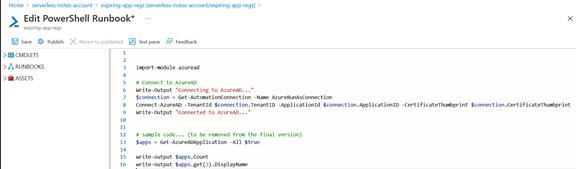
You’re then presented with a screen to enter the code for that runbook. Our code will be in PowerShell. We’ll get to the complete source code in the next section.
For now, I’ve displayed some sample codes:
You can notice, in line 3, that we import the “AzureAD” PowerShell module to interact with Azure AD. We use it at line 13 to get the list of all app registrations.
You can notice that, too, between lines 6 and 9, we are authenticating to Azure AD before getting the list of app registrations (again, at line 13).
From the toolbar (above the text editor), you can save the runbook, test it, publish it (you need to do that before you can use it in production), and revert to the previous version (in case the new version doesn’t work as expected).
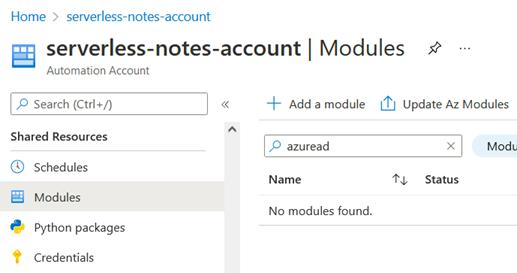
We need first to install it since we’re importing a module (here, “AzureAD” at line 3).
For that matter, at the Automation account level, we click on “Modules”, and we look for “AzureAD”:
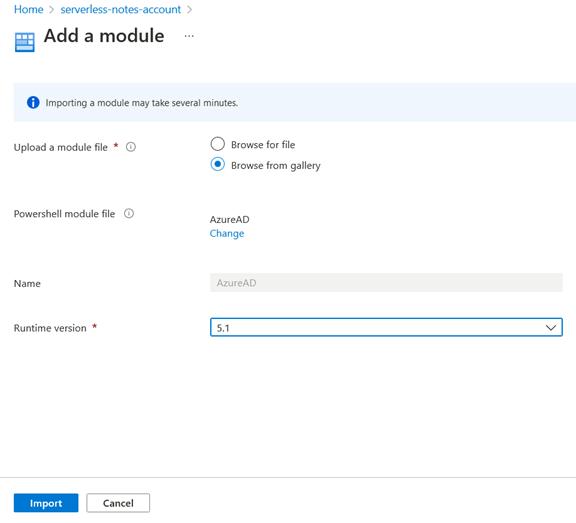
Since that module isn’t installed, we need to install it from the gallery by clicking on “Add a module”. We’ll pick 5.1 as the runtime version:
The code
The PowerShell code to be added to the runbook is listed?here. Replace the previous code with this one.
The code is pretty easy to understand. One thing worth mentioning is the $daysToExpire variable that you’ll have to set to an appropriate value for your scenario. It’s intended to detect the service principals whose credentials are about to expire in the x coming days.
Configuring the permissions for the runbook
At this point, if you execute the runbook, you’ll notice that it might not work. That’s because the identity under which the runbook runs doesn’t have permissions to interact with Azure AD.
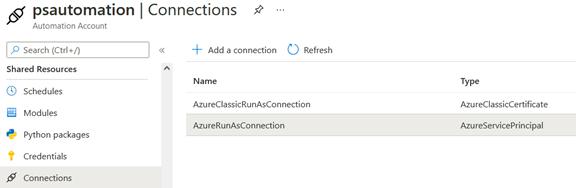
An Azure Automation account has an associated identity. Find it in the “Connection” section under “Shared resources” in the Azure portal.
I’ll choose the “AzureRunAsConnection”, which is of type “Service principal”, and give it the appropriate
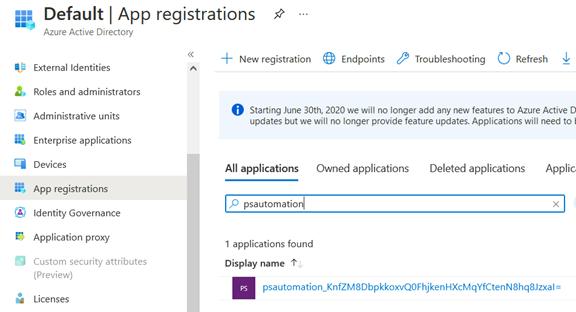
To find that service principal in Azure AD, I need to search for the name of the Automation account in the list of “All applications” under “App registrations”: Since we want to list app registrations from the Azure AD, we need to assign the directory role “Directory readers” to the service principal associated with our Automation account (the one that will execute the runbook) following the least privileges principle.
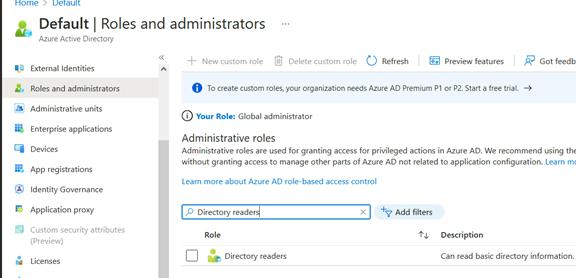
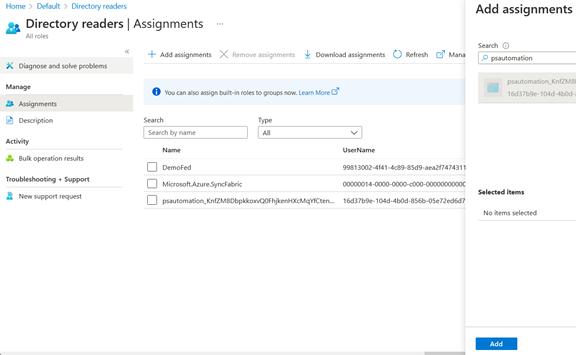
So, we go to “Roles and administrators” in our Azure AD tenant and select “Directory readers”: Then, we add an assignment to our service principal: And we’re done.
The post Azure AD application registration monitoring: All you need to know appeared first on Steef-Jan Wiggers Blog.
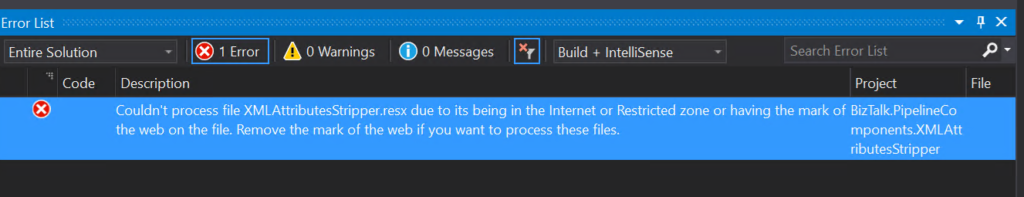
One error never comes alone! Following the error reported in my last blog post while working last week with one of my clients, I was able to catch an error that I never saw during these long years working with BizTalk Server while trying to build a BizTalk Server Visual Studio solution in this specific case a custom pipeline component:
Couldn’t process file XMLAttributesStripper.resx due to its being in the Internet or Restricted zone or having the mark of the web on the file. Remove the mark of the web if you want to process these files.??????????????????
Indeed I download that resource from the Internet, from my GitHub page, like I do thousands of times for many clients and projects!
Cause
This issue happens due to the fact that you downloaded from the web these files/resources from a machine with security restrictions configured. So, when Visual Studio attempts to build the project, this error occurs because The .NET Framework resource compiler honors this marker and refuses to compile those resource files for security reasons.
The underlying cause is that the respective resource file has the so-called mark of the web applied to it. This is a marker that browsers place on downloaded files so that other applications can make informed decisions on whether to trust that file or not.
Solution
To fix this issue, the solution is quite simple. Nevertheless, there are many ways to solve or avoid this issue.
Solution 1: Fix the issue
To solve this issue, we need to remove the mark of the web, to do that, we need to:
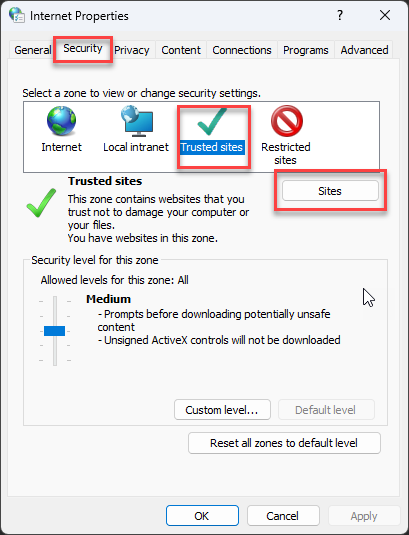
Right-click on the file in windows explorer and select Properties.
On the General tab, at the bottom under Security, there is a check box to remove mark of the web.
Unselect the Unblock check box and click OK.
Note: This needs to be done with Visual Studio closed.
Solution 2: Fix the issue with PowerShell script
We can also do the same functionality as Solution 1 using the following PowerShell script:
On the folder for the project, run the following script
dir -Path . -Recurse | Unblock-File
or
Get-ChildItem -Path . -Recurse | Unblock-File
Solution 3: Fix the issue from Visual Studio
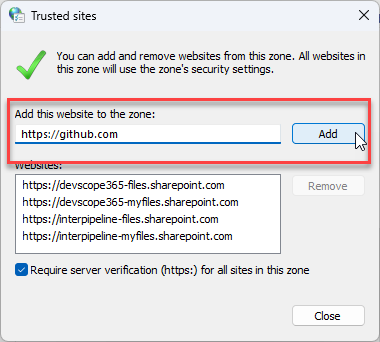
Didn’t try this approach, but apparently, we can also fix this issue directly from Visual Studio by:
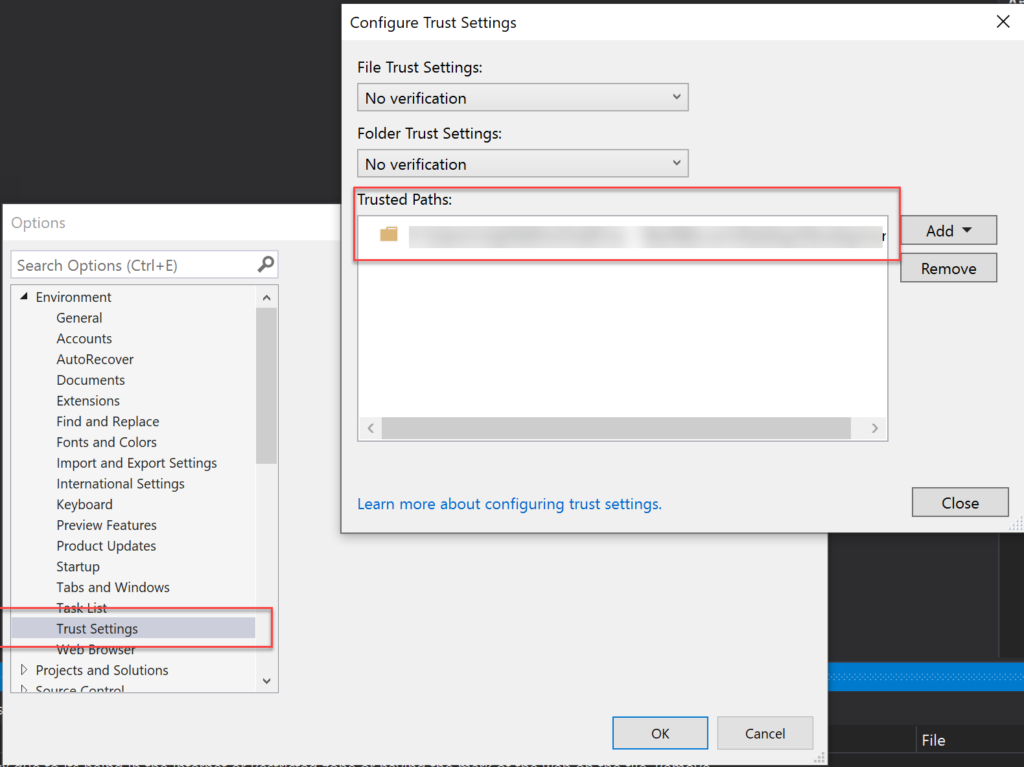
Select the menu option Tools > Options
From the Options windows, select the option Trust Settings under Environment and add the project path as a trusted path.
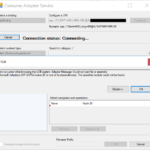
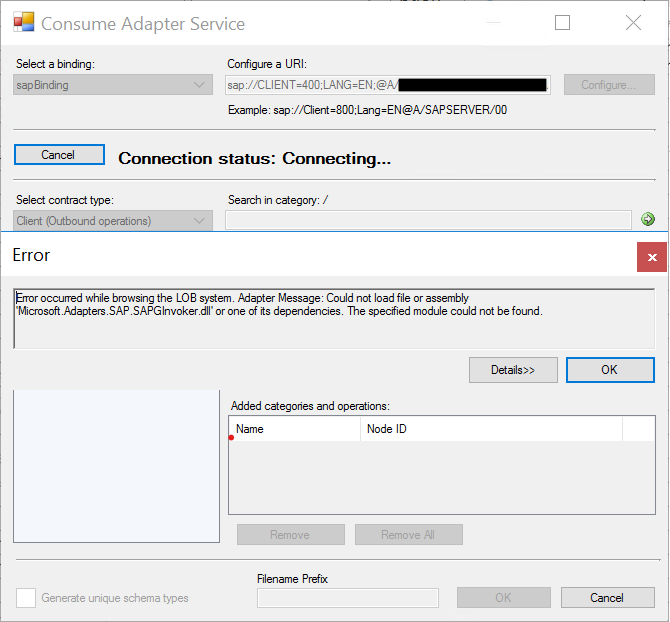
Last week I was adding new processes to an existing and old project for a client, a project that I started a few years ago, and I was caught by surprise with the following error while trying to generate a new SAP schema from Visual Studio:
Error occurred while browsing the LOB system. Adapter Message: Could not load file or assembly ‘Microsoft.Adapters.SAP.SAPGInvoker.dll’ or one of its dependencies. The specified module could not be found.
At first sight, the cause for the error is simple, and I will explain above the main causes, but in my case, the problem was that I had all the pre-requirements for the WCF-SAP adapter to work, and again that was an existing project where I had already generated several SAP Schemas.
Cause
Normally the main reason for this error is that the pre-requirements to run the WCF-SAP adapter are not installed in the environment. Even if you see the WCF-SAP adapter present and configured in the BizTalk Server Administration console, it doesn’t mean that it is ready to work. This adapter requires you to install the following SAP resources to run the adapter in the BizTalk Server box:
NCo3018_Net40_x64.msi
NCo3018_Net40_x86.msi
You can download these resources from the SAP Service Marketplace.
It is required (mandatory) to install the x86 version of the SAP Connector for Microsoft .NET. However, if you want to run the adapter under a 64-bit Host Instance, you need to install both the x86 and x64 versions of the SAP Connector for Microsoft .NET (recommended).
But once again, I knew that I had all these resources installed, and I doubled check that they were installed.
In my case, for some unknown reason, some of these DLLs got corrupted, and for that reason, I was getting this error.
Solution
To fix this issue, the solution is quite simple:
Reinstall the x86 and x64 versions of the SAP Connector for Microsoft .NET.
NCo3018_Net40_x64.msi
NCo3018_Net40_x86.msi
When asked, repair the installation of the components.
After that, I was once again able to generate SAP Schemas from my BizTalk Server Visual Studio project.
Do you feel difficult to keep up to date on all the frequent updates and announcements in the Microsoft Integration platform and Azure iPaaS?
Integration weekly updates can be your solution. It’s a weekly update on the topics related to Integration – enterprise integration, robust & scalable messaging capabilities and Citizen Integration capabilities empowered by Microsoft platform to deliver value to the business.
Building an application with different deployment models, resources, and tools in Azure is not the end of the road. The ultimate goal of end-user experience, sustainability, and increased visibility could be achieved only with observability.
There are a lot of different tools available in the market. Azure has built-in tools, but many third-party solutions are available that stay on top of the native tooling to advance the observability functionality.
Today, I’ll take you through the common traits among the available tools and what you should consider while choosing an Azure observability tool.
What is the difference between monitoring and observability?
Before I go deep into observability, I would provide better clarity about its supplementary compatriot, monitoring. In fact, observability and monitoring are tightly connected, and you cannot achieve observability without monitoring.
Let us understand what they are, why they are essential, and when they are crucial to consider in your Azure ecosystem.
Monitoring
A monitoring system or tool actively tracks your application and continuously assesses it for any anomalies, flaws, or problems.
Monitoring gathers metrics and properties from the available sources like APIs and logs.
It passively tracks the performance and the amount of data it generates usually drowns the admin personnel.
Monitoring usually focuses on a point observation like integrations, infrastructure, and networks.
The data available through monitoring is often considered the final expected outcome.
Observability
The data collected from monitoring, like metrics and properties, set the base for observability. While monitoring focuses on incident reporting, observability provides insights into why the issue happened.
It collects various data like metrics, logs, and traces, which sets up the system to extract crucial insights into why things are happening.
It provides refined information after processing various data sources that pinpoint the exact root cause of the issue or incident.
Observability holistically focuses on both application and infrastructure to identify the root cause.
It collects data from sources contributing to the analytical process, representing the incident state.
At the bottom line, while many observability tools are available in the market, all of them have a shared data source platform: Azure Monitor.
Can you achieve better observability with Azure Monitor?
While Azure monitor could only generate metrics and logs, the users cannot achieve the advanced version of the monitoring, which is observability.
The platform should be able to refine various data sources like metrics, logs, and traces to focus on the relevant data, such as the factors that drive operations decisions and actions to fix incidents faster.
What should you consider while choosing an observability tool?
While many third-party and open-source solutions in the market utilize Azure Monitor export API to provide an upgraded experience beyond the threshold determined by the Azure cloud, I will explain the critical features that are expected to be present in any observability tool.
Analyze and predict anomalies in Azure
Leveraging custom algorithms to predict anomalies in Azure resources allows users to be proactive with critical performance issues. In addition, it correlates issues across hybrid and microservice architecture.
Real-time dependency mapping
This provides a sufficient view of the resources as a Line of Business Applications. Users can derive relationships between the resources that comprise the Business Application using this as a physical representation of the architecture with real-time health status.
Business KPI dashboard
Ability to auto-populate the dashboards that aggregates and presents the data to show the business goal achievements and bottlenecks.
Deep Analytical tool
Without switching between tabs, drill down into Azure services, components, or parameters using robust in-built tools to identify root causes.
Automatic remediation
The advanced automation capabilities help fix trivial incidents that may not require manual intervention.
List of Azure Observability Tools
Given the volume of tools available in the market, it might be daunting to compare every product and choose the wise one that suits your needs. Hence, we have hand-picked the top 5 observability tools that have advanced capabilities.
#1 Serverless360 (Best Overall)
Serverless360 is best for achieving advanced observability and end-to-end correlation tracking.
Serverelss360 is the provider of advanced monitoring and observability. It advances observability with contextual information, end-to-end correlation, and automation. It helps remove blind spots, resolve issues rapidly with minimal MTTR and deliver a superior customer experience.
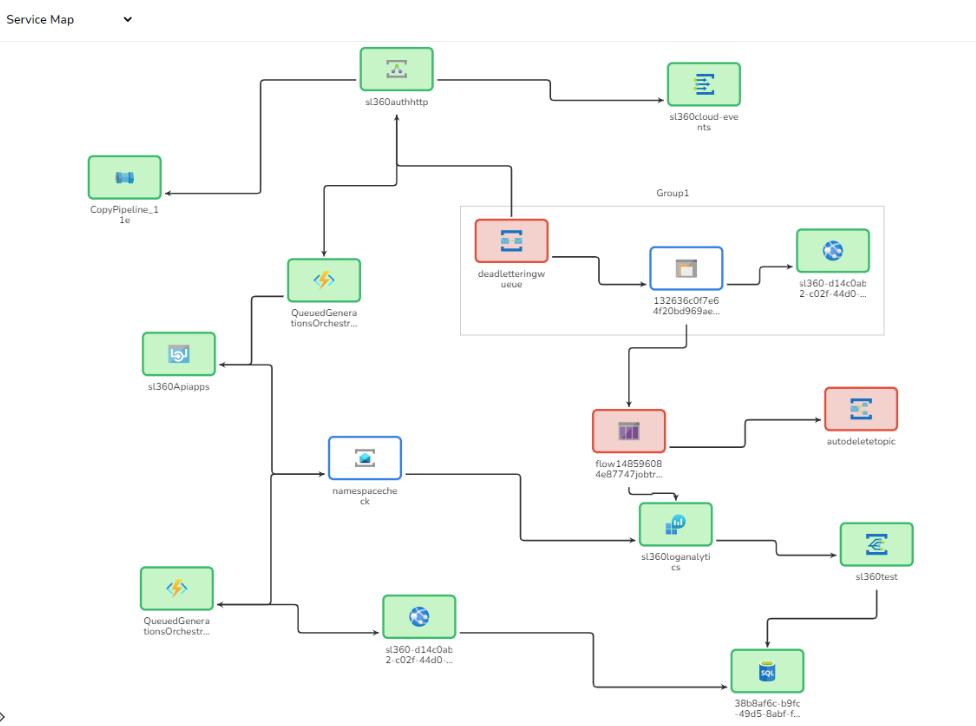
It extends the three core pillars of observability with a topology map that correlates the dependencies between applications to provide contextual information.
It provides actionable answers rather than just producing severity alerts which could be more helpful. With advanced automation, you can ensure high scalability by auto-remediating trivial issues without manual intervention.
Features
Contextual information from the observed data about business goals impact
Precise answers to reduce Mean time to recovery
End-to-end correlation between the Azure service dependencies
Service map to get the real-time health status of the application architecture
Granular user access permission and team collaboration
Desperate notification channels like slack, service now, teams, and more
Price
Its base price starts at $150/month for 25 Azure resources. You can try their 15 days free trial.
#2) Dynatrace
Dynatrace is a comprehensive enterprise SaaS tool for a wide range of enterprise monitoring needs. Distributed Tracing provides a technology called Purepath that combines distributed tracing with code-level insight.
Features:
Automatic injection and collection of data
Code-level visibility across all application tiers for web and mobile apps together
Always-on code profiling and diagnostics tools for application analysis
#3) SigNoz
SigNoz is a full stack open source APM and observability tool. Collect both metrics and traces with log management, currently included in the product roadmap. Logs, metrics, and traces are considered the three pillars of observability in modern distributed systems.
Features:
User requests per second
50th, 90th, and 99th percentile latencies of microservices in your application
Error rate of requests to your services
#4) Honeycomb
Honeycomb is a full-stack cloud-based observability tool with support for events, logs, and traces. It provides easy to use UI for unified observability and some of its features includes:
Features:
Quickly diagnose issues and tweak performance with a top down approach to understand how your system is processing service requests
Full-text search over trace spans and toggle to collapse and expand sections of trace waterfalls
Provides Honeycomb beelines to automatically define key pieces of trace data like serviceName, name, timestamp, duration, traceID, etc.
#5) Datadog
DataDog is an enterprise APM tool that offers a variety of monitoring products from infrastructure monitoring, log management, network monitoring to security monitoring.
Features:
Out of box performance dashboards for web services, queues, and databases to monitor requests, errors, and latency
Correlation of distributed tracing to browser sessions, logs, profiles, network, processes, and infrastructure metrics
Can ingest 50 traces per second per APM host
Service maps to understand service dependencies
Observability in Azure: Wrap up
Many tools are available at your disposal, while Azure Monitor is a solid out-of-the-box place to start if your organization decides to work with Azure. But at scale, you may need advanced and custom functionalities that go beyond the limitations of the native tool to help you understand the health of your application at a glance which will keep your business up and running.
The post Top 5 Azure Observability Tools in 2023 appeared first on Steef-Jan Wiggers Blog.
In today’s world, APIs have definitely advanced the way how applications communicate with each other. However, when several APIs are utilized in a business scenario, it would be challenging to retain insight into each API to make sure they work as intended.
This is where an Azure service like API Management turns out to be a significant aspect. It offers a centralized interface to publish, transform and manage numerous APIs, guaranteeing that they are secure and consumable.
Significance of Monitoring your Azure APIM
Since Azure APIM instances manage such business-critical APIs, monitoring them and their operations is crucial to better know their health and efficiency. Here are the top benefits that can be achieved with Azure APIM Monitoring,
Eliminate Bottlenecks:?Monitoring how your APIM APIs and Products (group of one or more APIs) perform is essential to quickly spot problems that might adversely affect the end-user experience.
Reduce latency gaps: API response time has a profound effect on the performance of an application. So with APIM monitoring, get to identify in case of response time delays, thereby eliminating latency gaps.
Ensure availability: When there are any API-related issues, an effective APIM monitoring setup will send instant alerts, allowing you to take the required remedial actions.
Detect failure anomalies: Rapidly figure out if there are outages or abnormal deviations like sudden rise in the rate of failed requests.
Understanding the importance, Azure itself offers its own suite of built-in tools for monitoring Azure APIM Instances.
Wide range of monitoring options available for Azure APIM
Native-Azure monitoring tools (Azure Monitor)
Azure Monitor is one of the primary built-in tools for monitoring Azure APIM instances. Basically, it enables the collection of metrics and logs from APIM, which can be further used for monitoring, visualizing, and alerting.
Capabilities
Monitor your APIM Instances on metrics like capacity and request rate
Set up alert rules based on metrics to get notified of critical issues
Provides dashboards for visualizing monitoring metrics
Get insights into the operations performed on your APIM Instances with Activity logs
Integration with App Insights lets you know the dependencies between APIM instances and other services.
Moreover, Azure Monitor focuses more on reactive monitoring – you get to react only after an incident has occurred.
But when it comes to APIM monitoring, business tends to be more proactive, constantly attempting to spot and fix potential issues before they have an impact on end users.
The limitations in using Azure Monitor for APIM
Azure Monitor allows you to configure only a limited number of metrics per alert rule
Monitoring an APIM instance on various metrics demands configuring a number of alerts, resulting in a cost spike.
No consolidated error reporting for multiple APIM instances
Doesn’t support visualizing how an API call traverses through various Azure services
It would be hard to perform root cause analysis in case of a performance or latency issue without end-to-end tracing.
Lack of automated features to execute remedial actions without manual intervention
This is where the necessity of having enterprise-grade monitoring tools comes in place. One such tool that can assist you in overcoming the above-listed drawbacks and help proactively monitor your Azure APIM is Serverless360.
How to be proactive and overcome limitations in Azure Monitor?
Serverless360 is an advanced cloud management platform that enables managing and monitoring different Azure services involved in your application from a unified view.
Considering APIs are critical in simplifying how an end user interacts with your application, Serverless360 offers out-of-the-box monitoring support for Azure APIM APIs, operations, and products.
Here is how Serverless360 can be extensively used for Azure APIM Monitoring.
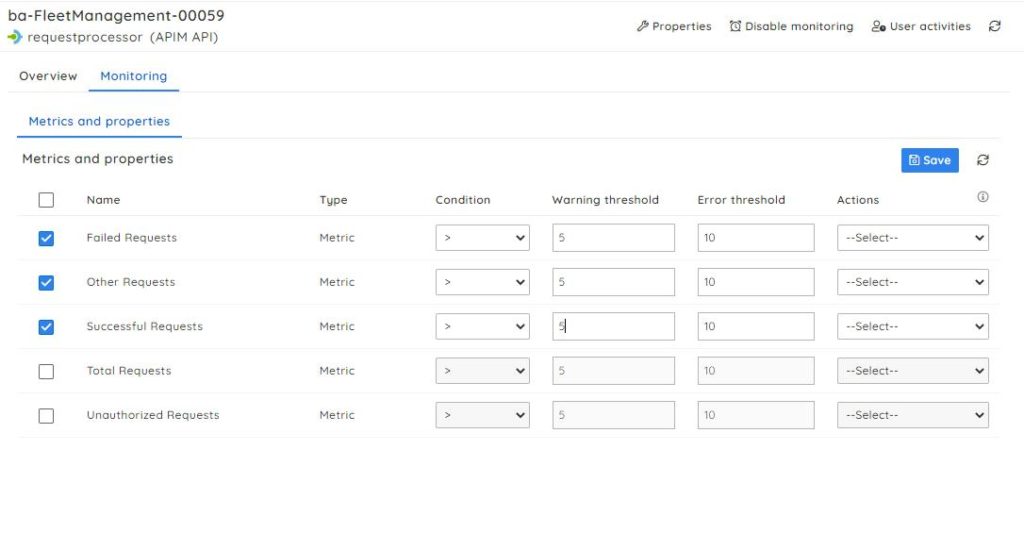
Proactive monitoring for Azure APIM: Monitor all your APIM instances on multiple metrics and properties (Failed Requests, Successful Requests, etc) at no additional cost by setting up maximum thresholds to get an alert whenever there is a violation.
With this, get to overcome one of the major limitations in Azure Monitor – The restriction to monitor only countable metrics under a single alert.
Real-time consolidated error reports: In any sort of traditional monitoring, error reports will be generated for each APIM API, operation, or product, making it very difficult to identify the root cause of an issue.
But Serverless360 can mitigate the challenge by sending you a consolidated report on all the APIM Instances at desired time intervals, eliminating false or alert storms.
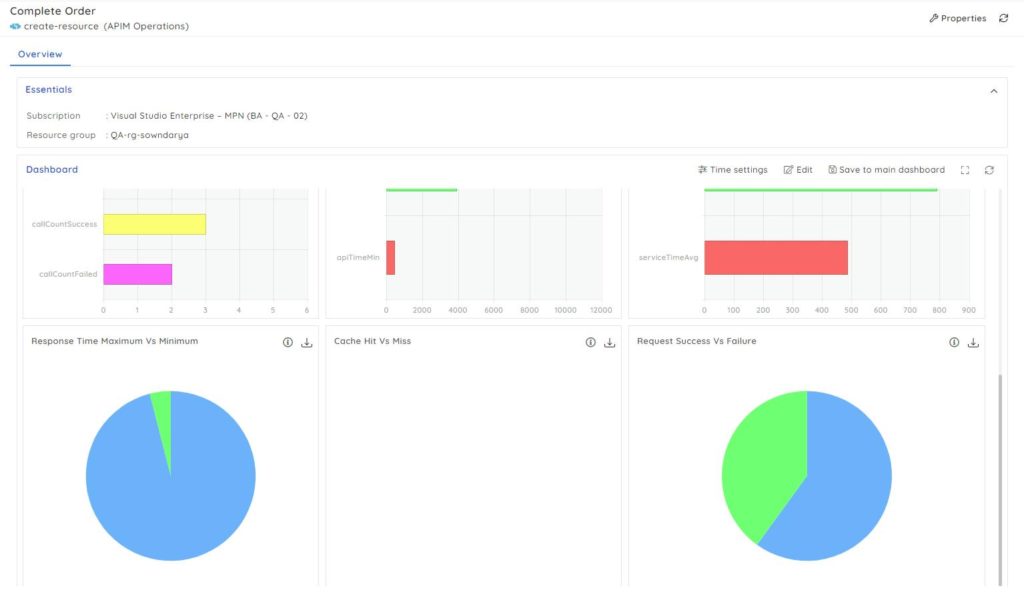
Discover failure trends: Serverless360 offers customizable, plug-and-play dashboards to provide a unified view of the metrics monitored. For instance, Visualize business-centric metrics like the response rates of APIs in a single place to avoid latency issues.
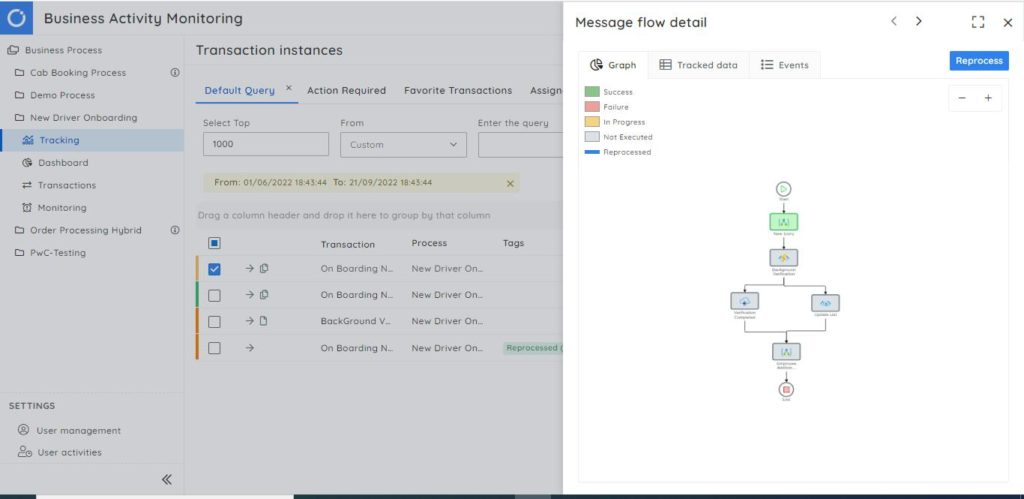
End-to-end tracking: An Azure application will have various Azure services along with other APIM Instances, so tracking how an API call flows through each of those services is required to perform root cause analysis and troubleshoot issues faster than ever.
App Insights in Azure Monitor just lets you visualize how services interact with each other whereas Serverless360 supports end-to-end tracking along with dependency mapping.
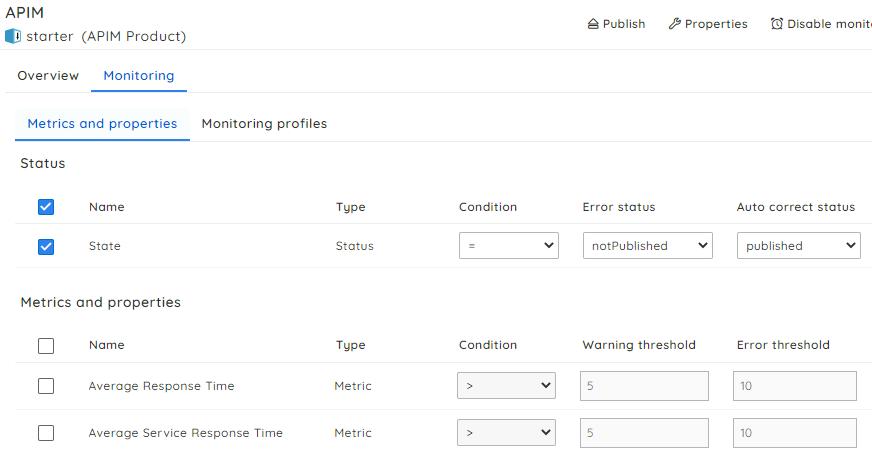
Auto-correct the status of APIM Products: Automationis very crucial to reduce themanualworkloadinvolved in resolving recurring incidents.
Serverless360 offers unique functionality to monitor the status of APIM products and auto-correct them during unintended interruptions. Also, it lets you configure various automated actions to be triggered whenever there is a threshold violation.
Optimize costs associated with APIM Instances: Save time and cost by auto-generating documentation on your entire Azure environment/infrastructure. These documents help keep track of the costs associated with your APIM APIs, operations, and products. They enable you to compare the costs incurred across various time periods and to gain a full analysis of the expenditures made for each of those components.
No room for security breaches: Understanding the importance of governance and auditing in enhancing security, Serverless360 comes with features to audit every action performed on your APIM instances and enable advanced role-based access control.
Decode App Insights and Log Analytics: Enabling App Insights and Log Analytics can derive useful data on the APIM performance, however, Serverless360 can make this information more usable to the support team. Refer to this blog to learn more: Serverless360 to enable your Security Manager to Azure WAF data
Offload support: Serverless360 offers an operation-friendly interface simple and straightforward for support users to infer the status of the resource and remediate identified issues. This can facilitate offloading support from the Azure team allowing them to innovate in business.
Conclusion
Having a solid tool for Azure APIM monitoring is mandatory for any organization, as the failure of an API could result in critical performance issues for the whole application.
But there are plenty of choices available for Azure APIM monitoring and it is important that you choose the most apt one for your business. Thus, this blog discusses the features of native-Azure monitoring tools, their drawbacks, and a solution (Serverless360) to overcome them with consolidated monitoring for Azure APIM APIs, Products, and Operations.
The post Azure API Management Monitoring and Alerting made simpler appeared first on Steef-Jan Wiggers Blog.