by Gautam | Jul 28, 2019 | BizTalk Community Blogs via Syndication
Do you feel difficult to keep up to date on all the frequent updates and announcements in the Microsoft Integration platform and Azure iPaaS?

Integration weekly update can be your solution. It’s a weekly update on the topics related to Integration – enterprise integration, robust & scalable messaging capabilities and Citizen Integration capabilities empowered by Microsoft platform to deliver value to the business.
If you want to receive these updates weekly, then don’t forget to Subscribe!
Microsoft Announcements and Updates
Community Blog Posts
Videos
Podcasts
How get started with iPaaS design & development in Azure?
- Robust Cloud Integration with Azure
- Microsoft Azure for Developers: What to Use When
- Serverless Computing: The Big Picture
- Azure Logic Apps: Getting Started
- Azure Logic Apps: Fundamentals
- Microsoft Azure Developer: Creating Enterprise Logic Apps
- Microsoft Azure API Management Essentials
- Azure Functions Fundamentals
- Cloud Design Patterns for Azure: Availability and Resilience
- Architecting for High Availability in Microsoft Azure
Feedback
Hope this would be helpful. Please feel free to reach out to me with your feedback and questions.
by Senthil Kumar Palanisamy | Jul 25, 2019 | BizTalk Community Blogs via Syndication
Introduction
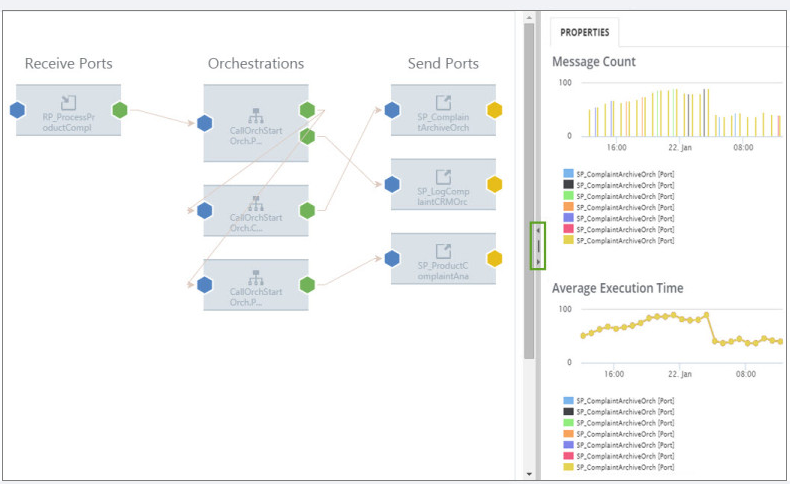
In complex BizTalk environment, it is important to visualize the patterns of how messages are processed within the system or integrate with multiple disparate systems to handle the message transfer from one point to another. It could be a simple direct transfer between the two ports, or through a complex messaging route passing through orchestrations to perform certain validations, etc. It is helpful to BizTalk Administrators or Business users to track the flow of messages in different stages. For this purpose, the BizTalk Admin Console has the capability to view the workflow of messages, although that feature will mainly be of use for BizTalk Administrators.
BizTalk360 has the functionality to allow users to view the graphical flow of the messages within your BizTalk Group. However, the challenge with the Graphical Message Flow Viewer is that, for instance, if there are 100 messages passing through the system at a point of time, each message is tracked at the service instance level with a unique id. The problem with this approach is that every single transaction is logged into the database. In an environment where there are lots of messages passing through the BizTalk system, there is every chance that the database will get filled up quickly.
Message pattern is to visualize interactive message flows with additional capabilities like the number of messages processed and Average Execution Time in the artifacts.
Message Pattern using Tracking Data
In BizTalk360 v8.0 introduces the “Messaging Patterns” capability to visualize a list of unique message flows that are being processed by the system. The key difference from Graphical Message Flow Viewer is that, in the Message Flow list, only the unique messaging patterns get recorded. As in the previous case, if there are 100 messages passing through the system at a point of time, not all the 100 message flows are recorded in the Messaging patterns. Only the unique message patterns are recorded, which could be just, say, 15 or 20.
For Messaging Patterns to work, a backend service (called Mapping Data) is responsible for keeping track of the unique message flows. That Mapping data service will collect the tracked message in the DTA DB.
Note: Make sure you have enabled Tracking at the ‘Pipeline’ level for the unique data flow data to be captured.
Challenges in determining the Message Patterns
Determining the message flows using tracking data has some challenges. As BizTalk Developers and Administrators might be aware that the BizTalk DTADb has its own challenges. For example, few customers, face performance issues with the tracking database when the BizTalk360 Analytics service fetches message flows using the MessageInout table;
-
Query Time out
In the initial version of Message Pattern, we have seen that query timeout issues have happened while retrieving message service instance data.
-
Temp Database Growth
To address this issue of query time outs, since BizTalk360 Version 8.5, the relevant data is fetched in a temporary table in the tracking database. However, with a few customers, this approach causes temp database growth.
Alternate Technique (BizTalkMgmt Database)
To overcome this challenge, in BizTalk360 9v.0 Phase2, we bring an alternative mechanism to determine the message patterns. The alternate way of finding the message patterns uses the BizTalk Management database relational data. It has the advantage that here the flow is determined without enabling the pipeline tracking at the artifact level.
Message Flows have been determined by the following models:
-
Publish-Subscribe Model
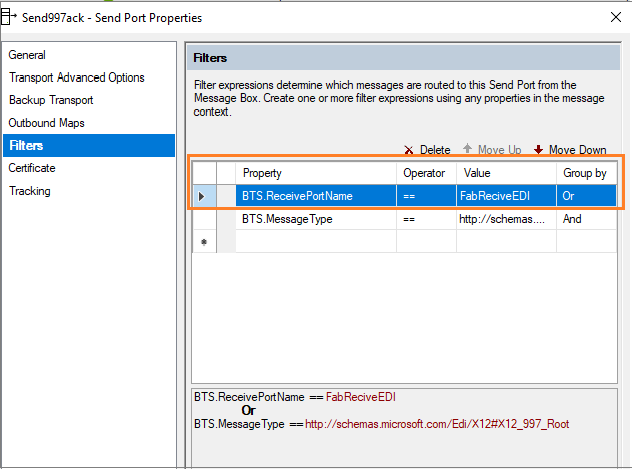
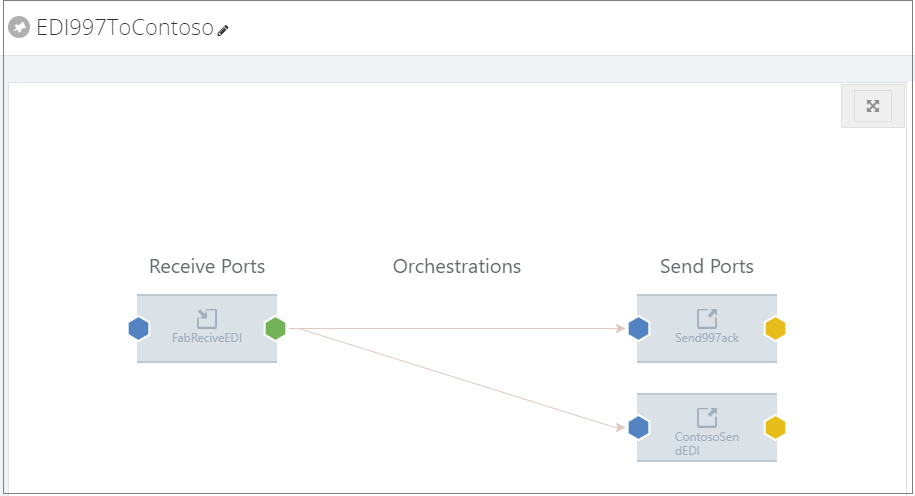
This method is used to determine the message flow between ports without any orchestration being involved. It uses the Filter property in send ports to understand the start and endpoint of the flow.
-
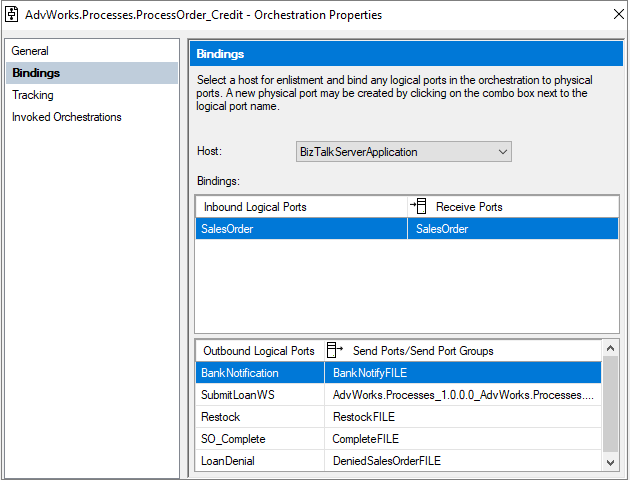
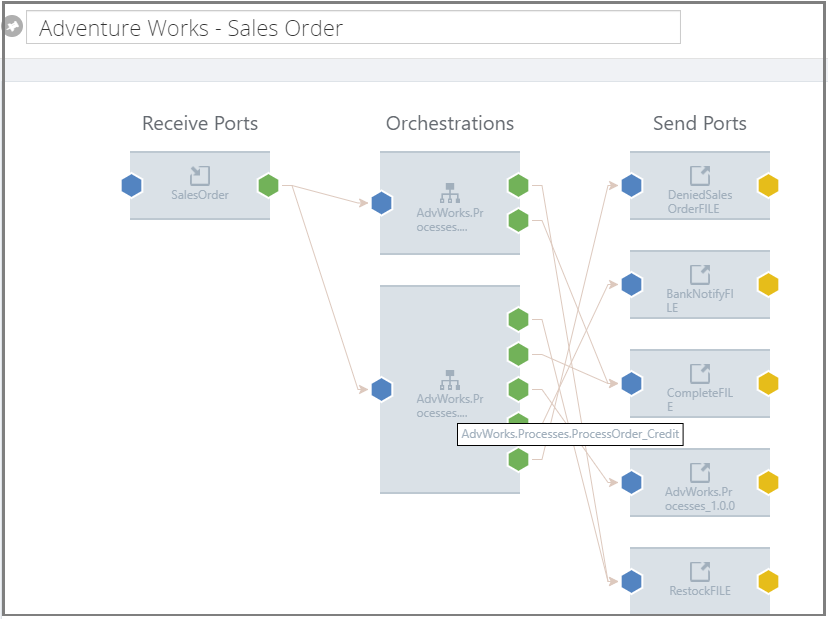
Orchestration Port Binding Model
The Orchestration Port Binding model uses the orchestration port binding relational data to determine the message flows. Using BizTalk Artifact tables (adm_ReceiveLocation, bts_receiveport, bts_sendport, bts_pipeline, bts_application) with orchestration port and orchestration port binding.
SELECT 'Pipeline' as fromServiceType,FROMPL.Name as fromServiceName,
RP.nvcName as fromPortName,
RP.uidGUID as fromUIdServiceId,
RPAPP.nvcName as fromAppName,

'Orchestration' as toServiceType, ORCH.nvcFullName as toServiceName, ORCH.uidGUID as toUIdServiceId, OP.nvcName as toPortName, '' as toAPPName

FROM [dbo].[bts_orchestration] ORCH

INNER JOIN  [dbo].[bts_orchestration_port] OP ON ORCH.nID = OP.nOrchestrationID

INNER JOIN [dbo].bts_porttype PT ON PT.nID = OP.nPortTypeID

INNER JOIN  [dbo].[bts_orchestration_port_binding] OPB ON OPB.nOrcPortID = OP.nID

LEFT OUTER JOIN [dbo].[bts_receiveport] RP ON RP.nID = OPB.nReceivePortID

LEFT OUTER JOIN adm_ReceiveLocation RL ON RL.ReceivePortId = RP.nID

LEFT OUTER JOIN bts_pipeline FROMPL ON FROMPL.Id = RL.ReceivePipelineId

LEFT OUTER JOIN bts_application RPAPP ON RPAPP.nID = RP.nApplicationID
WHERE OP.nPolarity = 2 AND RP.nvcName
IS NOT NULL AND (OP.nvcName  IS NOT NULL AND RP.nvcName IS NOT NULL)
Message Pattern Configuration
Users can choose the message flow determination technique by enabling or disabling the Dynamic pattern option. When Dynamic pattern option is enabled, then the Message pattern will be determined using the tracking database. If it is disabled, it will use the BizTalk Management database to find the message patterns for the BizTalk Group.
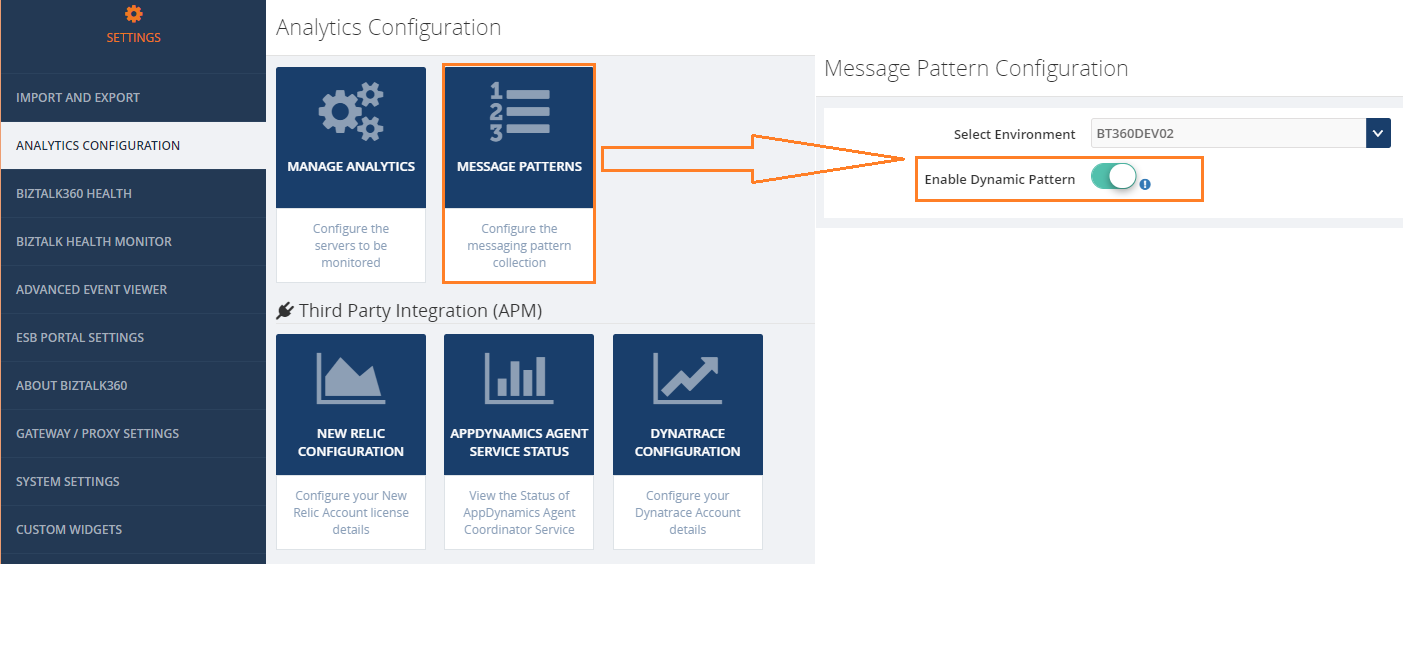 Few Points to be remembered to use this new mechanism (Dynamic Pattern – Disabled).
- Pipeline tracking needs to be enabled to see the message count and average execution time
- This mechanism will be able to determine the possible flows. In case a Port uses other filter criteria than Port Names, they are not determined
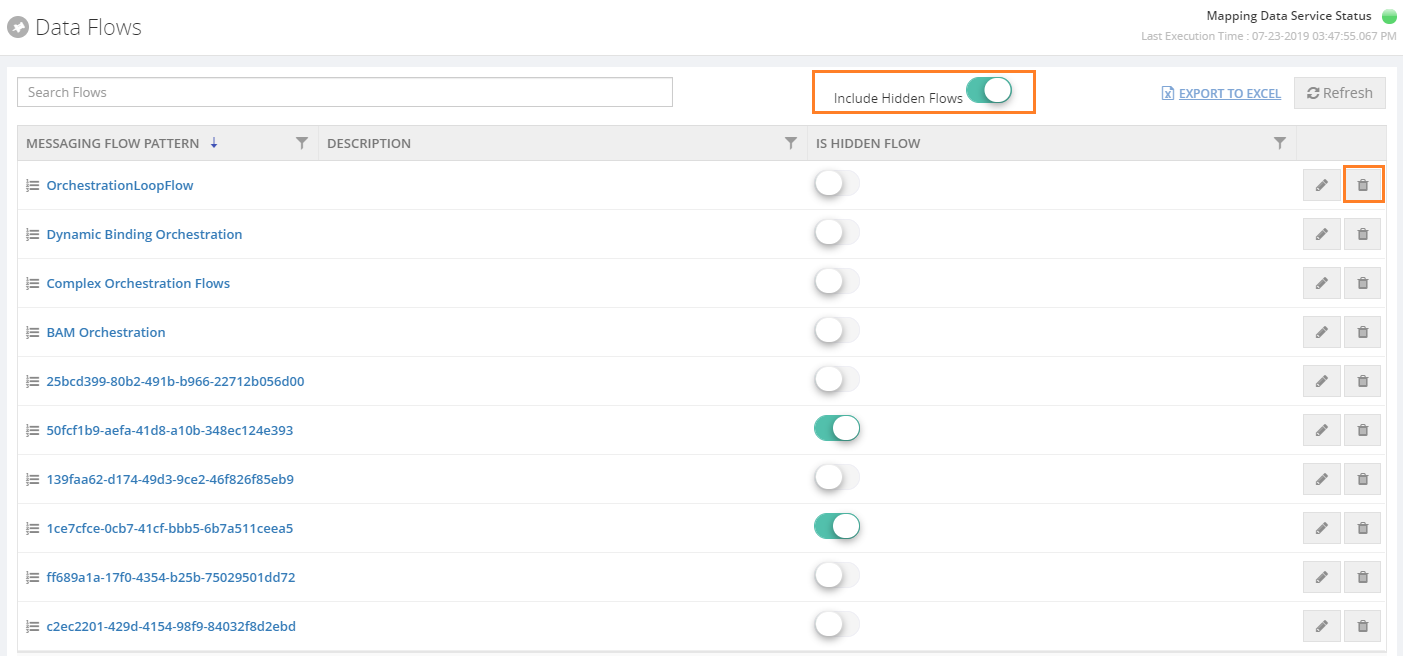
Other Improvements
In the upcoming version of BizTalk360 v9.0 phase 2, we are bringing management capabilities like hiding and deleting of message flows.
The Hide Operation can be used on the message patterns that are decommissioned or less frequently used. The Delete Operation can be applied on the flows that are no longer used in BizTalk Group.
Conclusion
We hope these improvements will bring a new way to determine the message flows in your BizTalk environments. You can expect these improvements to be available in the upcoming version of 9.0 phase 2. We are constantly improving on customer feedback. Please share your requests through the feedback portal.
The post Challenges in determining the Message Pattern using tracking database appeared first on BizTalk360.
by Sandro Pereira | Jul 22, 2019 | BizTalk Community Blogs via Syndication
Recently on Serveless360, a community blog that I contribute, I explain how you able to expose an Azure Logic App as an API using Azure API Management (APIM) you can see more details about it here: How to Expose and protect Logic App using Azure API Management (Part 1) – Exposing the Logic App. Today’s question is: Can we do the same with Microsoft Flow? Can we expose a Microsoft Flow that exposes an HTTP endpoint as an API on APIM?
And the short answer is… yes yes! It not as easier as Logic Apps because you don’t have a direct and seamless way to do it, but it can manually be done. And the goal of this blog post is explained to you how to accomplish that.
What is Azure API Management?
Is not the goal of this blog post but for you to be contextualized, if you are not familiar with APIM, in a simple way, Azure API Management is a fully managed service that enables customers to publish, secure, transform, maintain, and monitor APIs.
And it will allow you in a matter of a few clicks in the Azure Portal, most of the times, for you to create an API façade that acts as a “front door” through which external and internal applications can access data or business logic implemented by your custom-built backend services, running on Azure, for example, Logic Apps, App Services, or other many services or running on-premises in your organization. The APIM then will be able to handle all the tasks involved in mediating API calls, like request authentication and authorization, rate limit and quota enforcement, request and response transformation, logging and tracing, and/or API version management.

APIM is made up of the following components:
- The API gateway is the endpoint that:
- Accepts API calls and routes them to your backends.
- Verifies API keys, JWT tokens, certificates, and other credentials.
- Enforces usage quotas and rate limits.
- Transforms your API on the fly without code modifications.
- Caches backend responses were set up.
- Logs call metadata for analytics purposes.
- The Azure portal (old Publisher Portal) is the administrative interface where you set up your API program. Use it to:
- Define or import API schema.
- Package APIs into products.
- Set up policies like quotas or transformations on the APIs.
- Get insights from analytics.
- Manage users.
- The Developer portal serves as the main web presence for developers, where they can:
- Read API documentation.
- Try out an API via the interactive console.
- Create an account and subscribe to get API keys.
- Access analytics on their usage.
Note: in this blog post, I will not explain how you create an API Management resource on Azure.
Exposing a Microsoft Flow on Azure API Management
Triggered using an HTTP based trigger
The important thing, it needs to be triggered using an HTTP based trigger like the Request trigger.
Like Logic Apps, you can only expose a Microsoft Flow that is triggered using an HTTP based trigger like the Request trigger. Basically, that exposes an HTTP endpoint, on your APIM.
Exposing Microsoft Flow on Azure API Management
I told earlier that exposing a Microsoft Flow, it is not as easier as Logic Apps because you don’t have a direct and seamless way to do it.
The Microsoft APIM team has done a very good job and they created an intuitive and quite easy experience that quickly allows developers or administrators to add new APIs to APIM based on an Azure Logic Apps, if you try to add a new API you will get a “wizard” that you can actually choose to import a Logic App, and it will do everything for you:

So, for us to replicate the “Add Logic App” wizard and accomplish the goal of exposing a Flow on APIM we need to:
- First, we need to access to our Flow by accessing the Flow portal: https://flow.microsoft.com/ and sign in with your account
- In flow.microsoft.com, select My flows in the top navigation bar, and from the list of Flows, choose the flow you want to expose on APIM and select the Edit button.

- On the Flow Designer (or editor) click on top of the HTTP trigger to expand it and copy the HTTP POST URL property

We will need that URL in order to expose it in APIM.
Now that we have our Flow URL we can go ahead and start configuring our APIM:
- Access to your APIM on the Azure Portal (old Publisher Portal that is now built-in inside the Azure Portal;
- And on the left menu, under API Management section, click the API option

- By doing that under the All APIs section you will see the list of all APIs that you are already available, and on the main panel you will find several different options to add a new API to your list:
- From scratch – Blank API;
- Export based on an OpenAPI, WADL or WSDL specification;
- Or based on an Azure Service:
- Logic App
- API App
- Or a Function App
- In our case, we will be creating from the scratch, so go and press Blank API option

- And then let’s fill the creation form like this:
- On the Display name property give your API a name. I will call it “My Flow Demo”
- On the Name property, you may change the “internal” name. I will suggest leaving like that: “my-flow-demo”
- On the Web service URL property, paste the HTTP POST URL that we get from the Flow but only until the “triggers” word – Do not place the full
- https://{name}.azure.com:443/workflows/{GUID}/triggers
- You can put the full URL, but in this post, we will try to emulate almost all the steps that the APIM Logic App wizard does
- On the API URL suffix property, give a prefix to your API, for example: flowdemo
- On the Products property, you can bind this API to a product at this time or leave it blank. I will set mine as “Started”
- And finally, press Create

- What we need to do now is create our “manual-invoke” operation, to do that we need to do:
- Under our “My Flow Demo” API Design section, click + Add operation button

-
- And:
- On the Display name property give a name to the operation, I will call it “manual-invoke
- By the way, it doesn’t need to call this name, once again, we will use it just to emulate the API Logic App wizard behavior
- On the Name property, leave the default value: “manual-invoke”
- On the URL property:
- Set the operation to POST
- And set the URL like “/manual/paths/invoke”
- On the Description property, you may give a proper description for the operation, in our case, let’s put: Trigger a run of the Flow.
- Leave the rest of the configurations, we will deal with them later and go ahead and press Save

- Now that we have the basic outline of our operation let’s go ahead and configure it properly. To do that we need to:
- Select the “manual-invoke” operation and then click on the Frontend edit button

-
- And from the Frontend panel, select the Request option and them + Add representation button

-
-
- Set the Content type as “application/json”
- Provide a sample request on the Sample property
- And in the Definition property, select + New definition
- This will take your provide sample and generate the schema for you
- Just give a definition a name on the Definition name property: request-manual

-
-
-
-
- And then click Create definition button
- Go ahead and press Save once again
- Now let’s do the same for the Response. Once again, click on the Frontend edit button
- And from the Frontend panel, select the Responses option and them + Add response button
- Because my Flow doesn’t return any message back, instead of selecting the normal 200 OK HTTP Status, I will change that to be a 202 Accepted instead. So, on the response type select from the dropdown the 202 Accepted status and then press Save.
- Now that we have our Request and Response defined, the only thing we need to configure our policy properly, remember that in the API URL, we didn’t configure the entire URL. To do that we need to:
- Select the “manual-invoke” operation and then click on the Inbound processing Policies code editor button

-
-
- And in the Inbound policy we need to rewrite the URI, here is a sample of the policy you need to implement
<policies>
    <inbound>
        <base />
        <set-method id="apim-generated-policy">POST</set-method>
        <rewrite-uri id="apim-generated-policy" template="/manual/paths/invoke/?api-version=2016-06-01&sp=/triggers/manual/run&sv=1.0&sig=7xX3_XxX57XX-xXXXx-xXXXxXXxx5XXxXXxxxxXXXxx" />
        <set-header id="apim-generated-policy" name="Ocp-Apim-Subscription-Key" exists-action="delete" />
    </inbound>
    <backend>
        <base />
    </backend>
    <outbound>
        <base />
    </outbound>
    <on-error>
        <base />
    </on-error>
</policies>
Note: The only thing we didn’t do that the APIM Logic App wizard does is to create a key/value containing the “sig” property of the URL
Now we are all set to test our API.
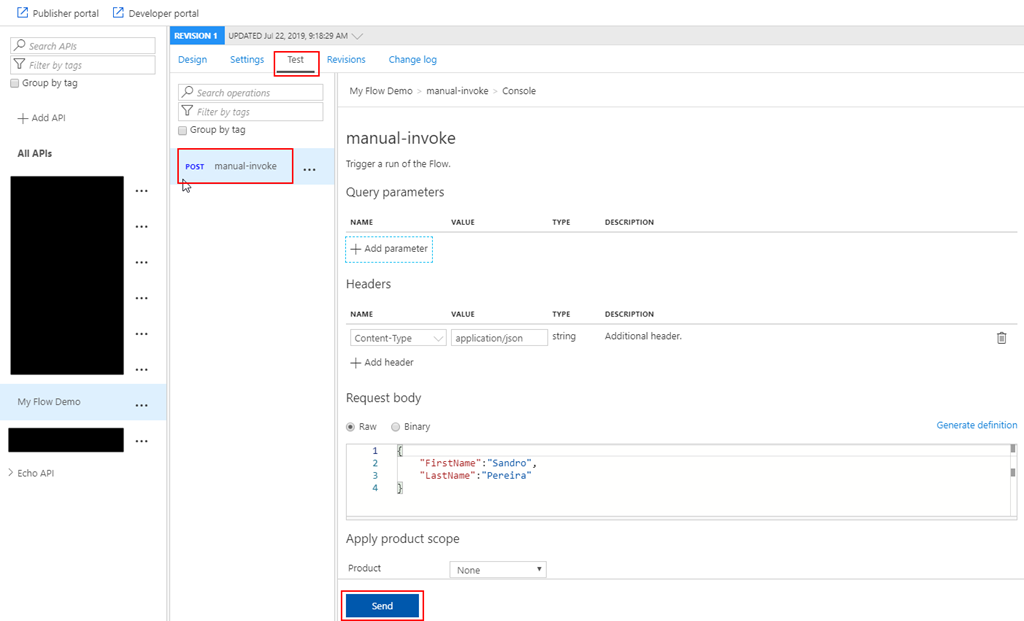
Testing the Microsoft Flow exposed in Azure API Management
After all the above steps, the next step is for us to test the Logic App expose as an API on APIM before we give access to our developers, teams, or partners. And the easier way to do that is directly on the Azure Portal.
To do that you need to:
- Under the API top options menu, select Test option, and in this case, there is only one operation, so automatically is selected;
- On the Request body section, select Raw option and insert a valid and expected request to be sent to your Microsoft Flow;
- And finally, press Send.
And after that, you will see an expected response from the Microsoft Flow.
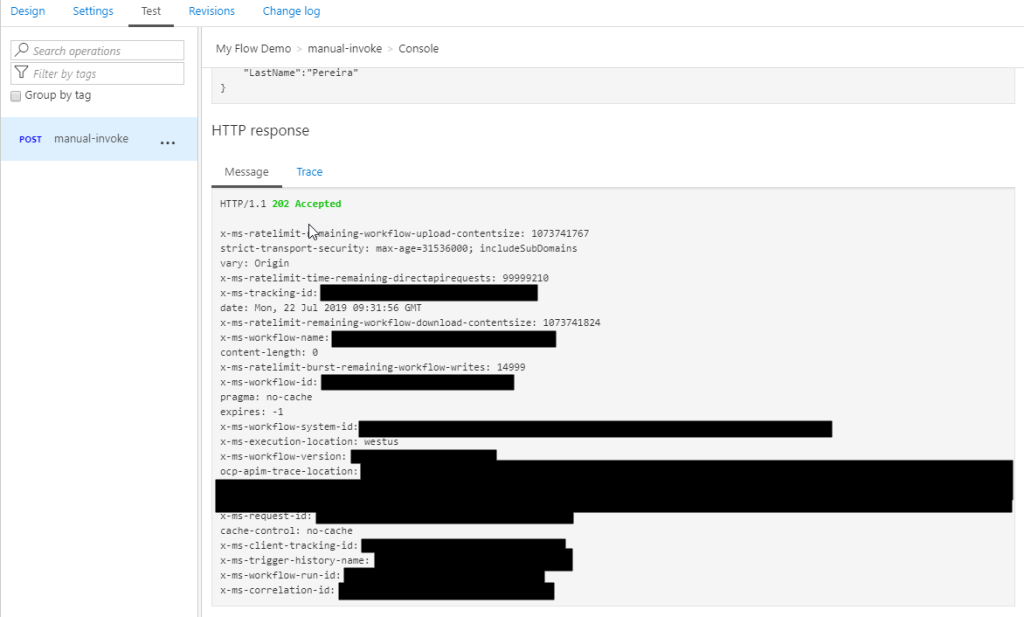
And we can check that the Flow was executed.
It failed because the payload is incorrect but other that everything is ok. We successfully exposed and trigger the Microsoft Flow from Azure API Management.
The post How to Expose Microsoft Flow thru Azure API Management appeared first on SANDRO PEREIRA BIZTALK BLOG.
by Gautam | Jul 21, 2019 | BizTalk Community Blogs via Syndication
Do you feel difficult to keep up to date on all the frequent updates and announcements in the Microsoft Integration platform and Azure iPaaS?

Integration weekly update can be your solution. It’s a weekly update on the topics related to Integration – enterprise integration, robust & scalable messaging capabilities and Citizen Integration capabilities empowered by Microsoft platform to deliver value to the business.
If you want to receive these updates weekly, then don’t forget to Subscribe!
Microsoft Announcements and Updates
Community Blog Posts
Videos
Podcasts
How get started with iPaaS design & development in Azure?
- Robust Cloud Integration with Azure
- Microsoft Azure for Developers: What to Use When
- Serverless Computing: The Big Picture
- Azure Logic Apps: Getting Started
- Azure Logic Apps: Fundamentals
- Microsoft Azure Developer: Creating Enterprise Logic Apps
- Microsoft Azure API Management Essentials
- Azure Functions Fundamentals
- Cloud Design Patterns for Azure: Availability and Resilience
- Architecting for High Availability in Microsoft Azure
Feedback
Hope this would be helpful. Please feel free to reach out to me with your feedback and questions.
by Sandro Pereira | Jul 18, 2019 | BizTalk Community Blogs via Syndication
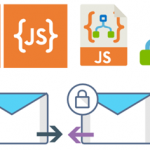
Due to personal requests from some members of the community, I decided to release another minor version of my stencils pack that will include the following features:
- New shapes: new shapes were added to existing modules like:
- Logic App Inline Code (square – original that you can find in Logic App design)
- Logic App Inline Code JS (square – original that you can find in Logic App design)
- Logic App Inline Code (Custom shape version 1)
- Logic App Inline Code (Custom shape version 2)
- Secure Message Input
- Secure Message Output

Microsoft Integration, Azure, Power Platform, Office 365 and much more Stencils Pack it’s a Visio package that contains fully resizable Visio shapes (symbols/icons) that will help you to visually represent On-premise, Cloud or Hybrid Integration and Enterprise architectures scenarios (BizTalk Server, API Management, Logic Apps, Service Bus, Event Hub…), solutions diagrams and features or systems that use Microsoft Azure and related cloud and on-premises technologies in Visio 2016/2013:
- BizTalk Server
- Microsoft Azure
- Integration
- Integration Service Environments (ISE)
- Azure App Service (API Apps, Web Apps, Mobile Apps, and Logic Apps)
- Event Hubs, Event Grid, Service Bus, …
- API Management
- IoT, and Docker
- Machine Learning, Stream Analytics, Data Factory, Data Pipelines
- and so on
- Microsoft Power Platform
- Microsoft Flow
- PowerApps
- Power BI
- PowerShell
- Infrastructure, IaaS
- Office 365
- And many more…
- … and now non-related Microsoft technologies like:
You can download Microsoft Integration, Azure, BAPI, Office 365 and much more Stencils Pack for Visio from:
 Microsoft Integration, Azure, Power Platform, Office 365 and much more Stencils Pack for Visio
GitHub
Or from:
Microsoft Integration and Azure Stencils Pack for Visio 2016/2013 v4.0.2 (22,6 MB)
Microsoft | TechNet Gallery
The post New Logic App Inline Code icons are now included in Microsoft Integration (Azure and much more) Stencils Pack v4.0.2 for Visio appeared first on SANDRO PEREIRA BIZTALK BLOG.
by Yuvaranjani Kalichamy | Jul 18, 2019 | BizTalk Community Blogs via Syndication
At the moment we are working on release v9.0.2 of BizTalk360. As always, we have many exciting features and enhancements coming up with this release.
One of the main sections in BizTalk360 is the Analytics section. BizTalk360 Analytics offers a visual display of the most important performance counters that are consolidated and arranged on a single screen so that the information can be monitored in a glance. In addition to that, we have the Reporting feature in BizTalk360 where users are able to generate PDF documents of critical performance metrics and send emails to the user at specific time periods, depending on the requirement. This feature is available only to the platinum licensed BizTalk360 environments.
In the new version v9.0.2 of BizTalk360, you can add Secure SQL Queries which can be mapped to a schedule to get the SQL query output as a report.
Note: BizTalk360 consists of 6 default queries which the user can only execute. In addition to that, the user can create new custom SQL queries as per their business need.
Secure SQL Reports in Analytics Reporting
Scenario 1:
Consider the scenario where you have a list of messages that ware not received during the past few hours/days and you want to know the details of these unprocessed messages. Usually you will be checking this by executing the query manually, however, this can be difficult on your busy schedule as you need to switch between different tools. Luckily, this can now be done simply with the new “SQL Reports” feature under Reporting. Just create a query, map it to the schedule according to your needs and then you will start receiving the query output as a report.
Scenario 2:
Consider another scenario: in BizTalk360, you have many users using the application. It’s important that an administrator should be aware of who did what. This can be seen in the Governance and Auditing section manually, but you might need to filter the records every time. Instead of filtering the records manually each time, you can create a Custom SQL Query and map the query to the Reporting Schedule which will send a periodic report to the configured admin email address. With this, the admin can easily get a report with regards to the actions performed by the other users. You can schedule this report and get the query output as a PDF document in the Analytics Reporting.
User permissions required to Process the Secure SQL Query Reports in BizTalk360
By default, the Superuser will have access to all the queries and also to the BizTalk reporting feature.
In case of a normal user, as a first step of processing the Secure SQL Query Reports, the user should ensure that the below permissions are provided.
The user should have permissions to:
- BizTalk Reporting
- Secure SQL Queries
Note: whenever a new query is being created, the user should ensure that, the normal user will be provided access to the newly created query (BizTalk360-> Settings-> User Access Policy-> Manage Users-> Secure SQL Queries-> Advanced).
Once all permissions set, the next step is to create a Reporting Schedule.
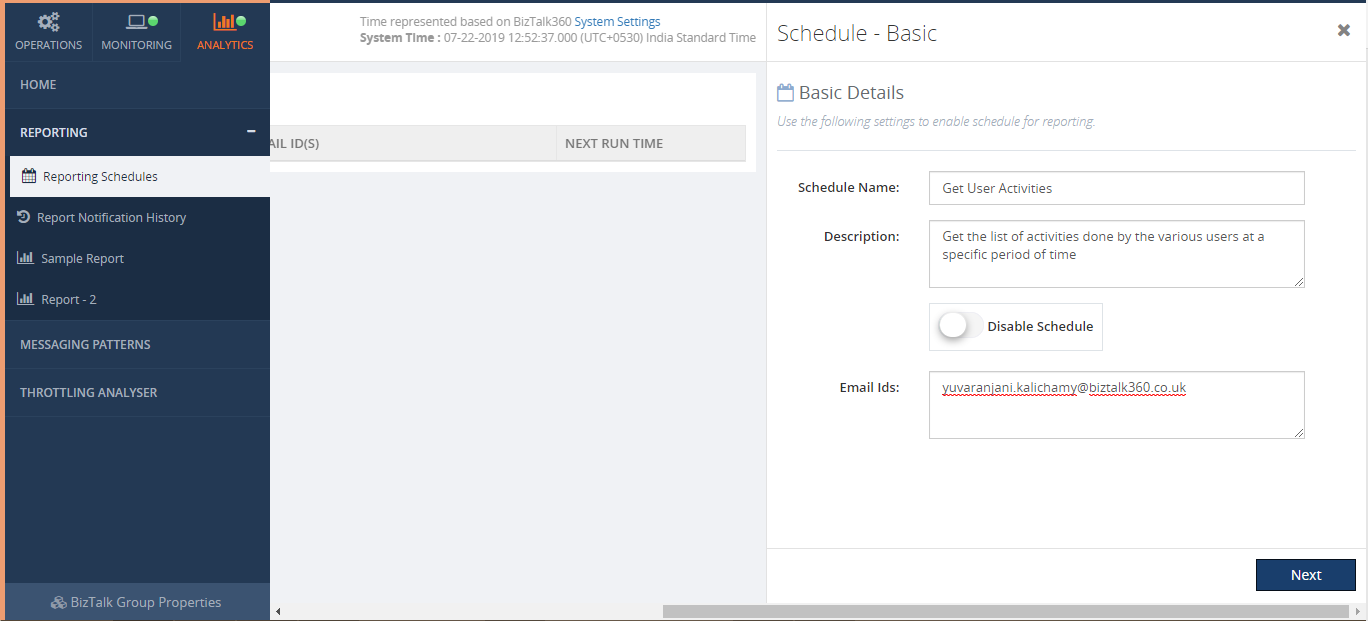
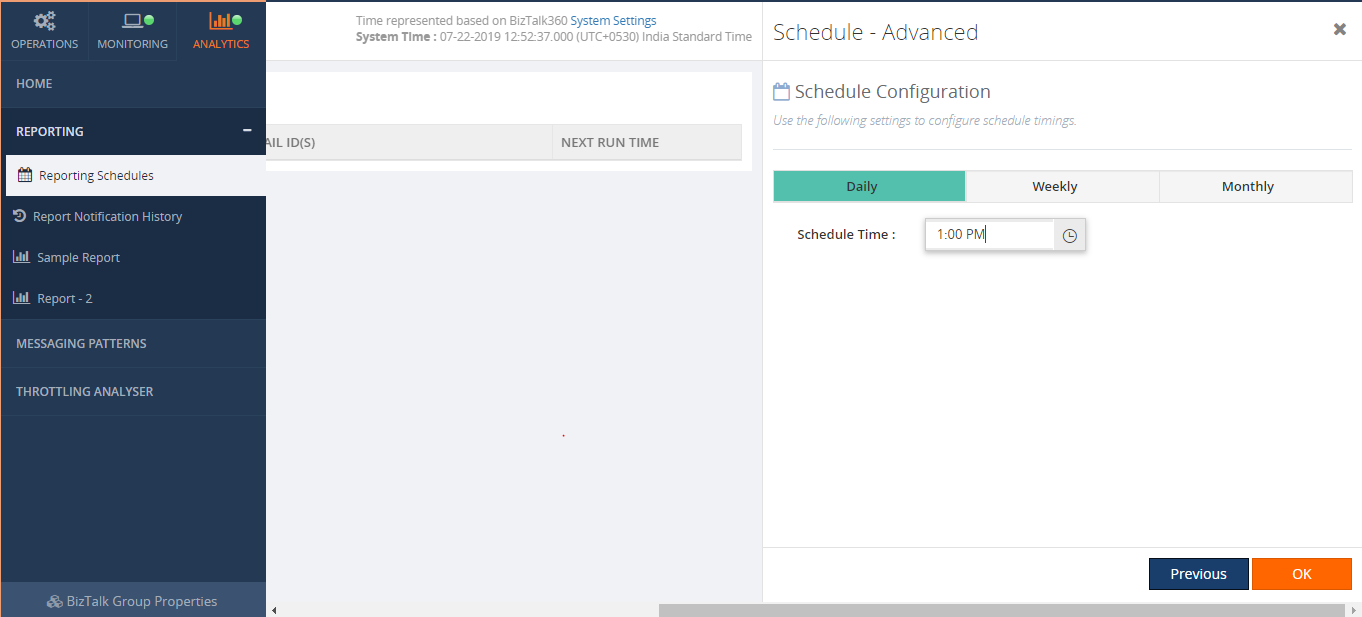
From the schedule configuration screen, you can define when you want to generate a report. The available options are Daily, Weekly and Monthly. Say, for instance, if the user wants to get a report on a daily basis, the user can choose Daily and set the time as per their need. This way the user will get the report on the scheduled time on a daily basis.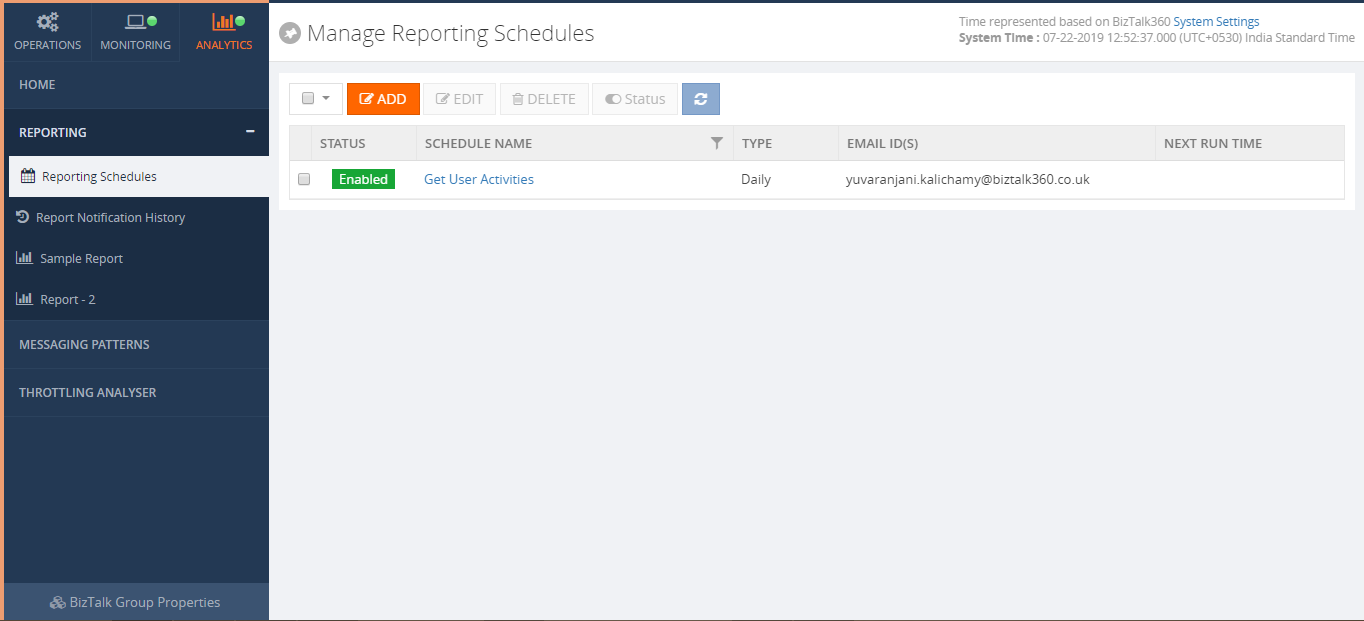
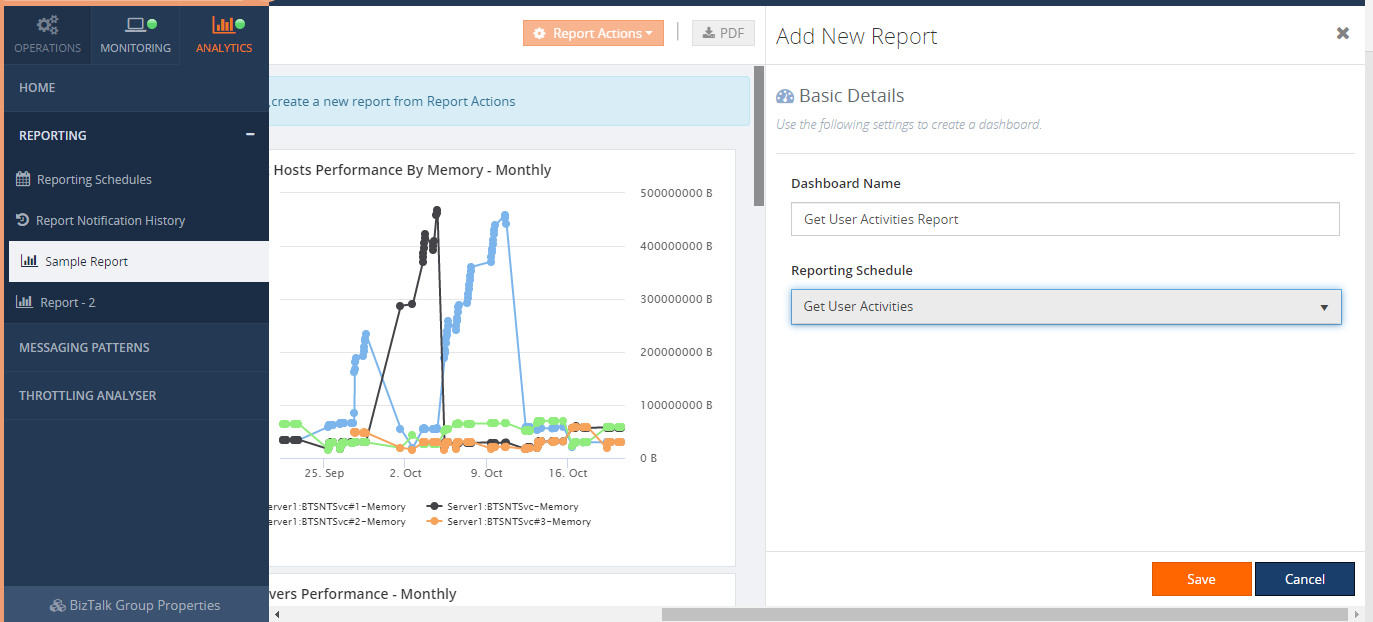
Once you have created a schedule, the next step is creating a report and map that report to the reporting schedule.
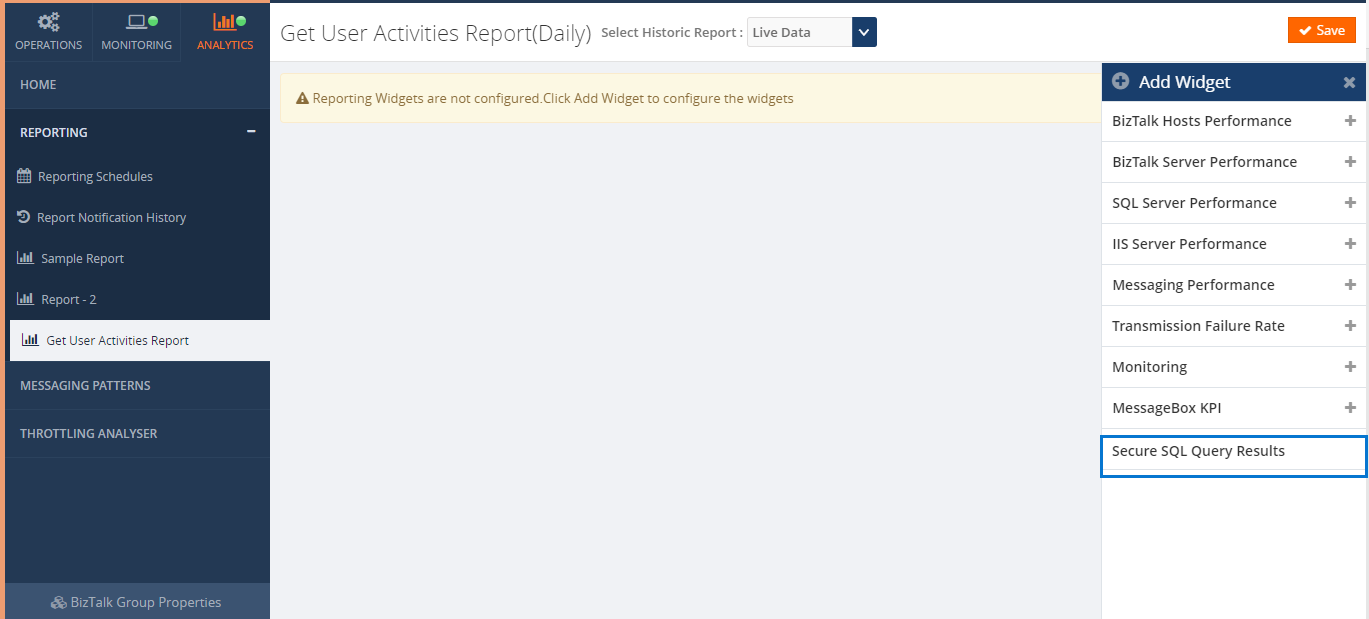
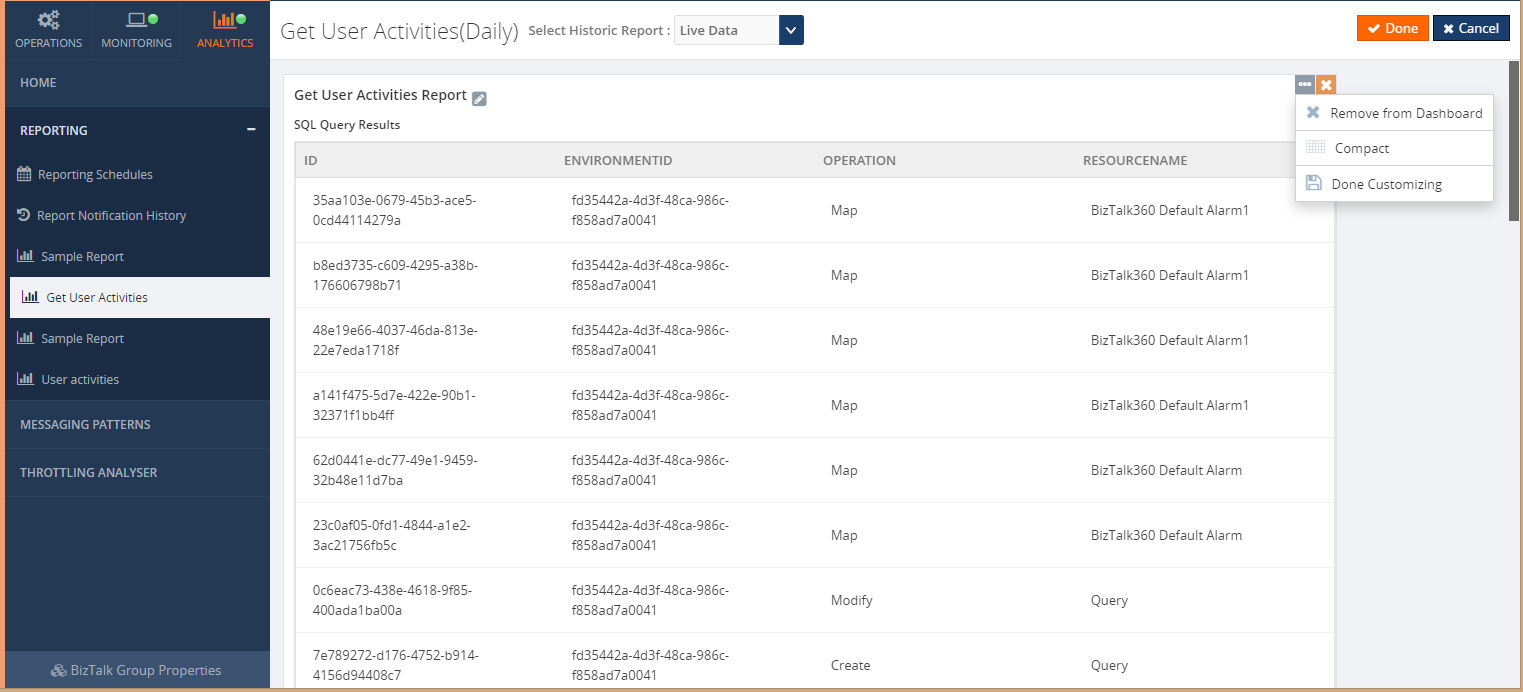
Once all is done, add a SQL Query widget by clicking ‘Secure SQL Query Results’ in the right panel.
When you click on ‘Secure SQL Query Results’, it opens the blade where you can enter the widget title and select the query from the list (List of Saved queries created in BizTalk360-> Operation-> Data Access -> Secure SQL Queries section).
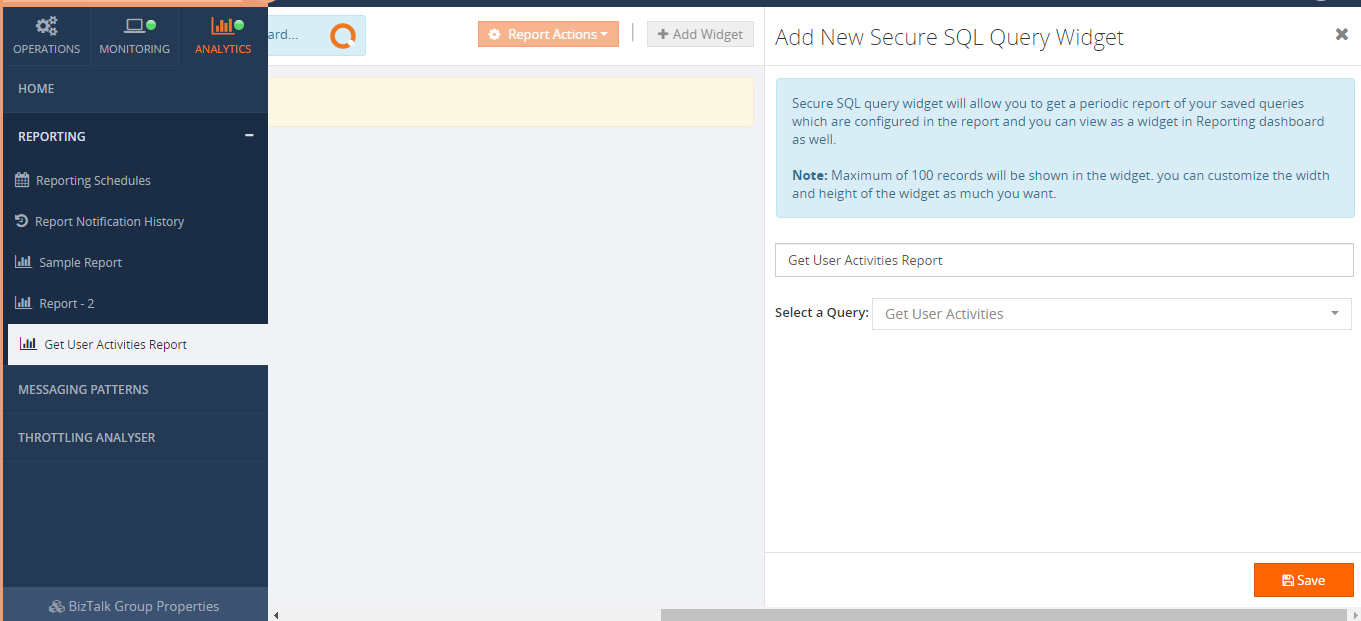
Once you click on ‘Save’, the widget will be added in a reporting dashboard.
When the widget is added to the dashboard, it gets added with the maximum width and height. In the case of having a bigger number of records, space might not be enough to view all the records. For that, we have provided the option to customize the widget. You can expand the widget as much as you want. For now, we are allowing a maximum of 100 records (top 100 records) in the widget.
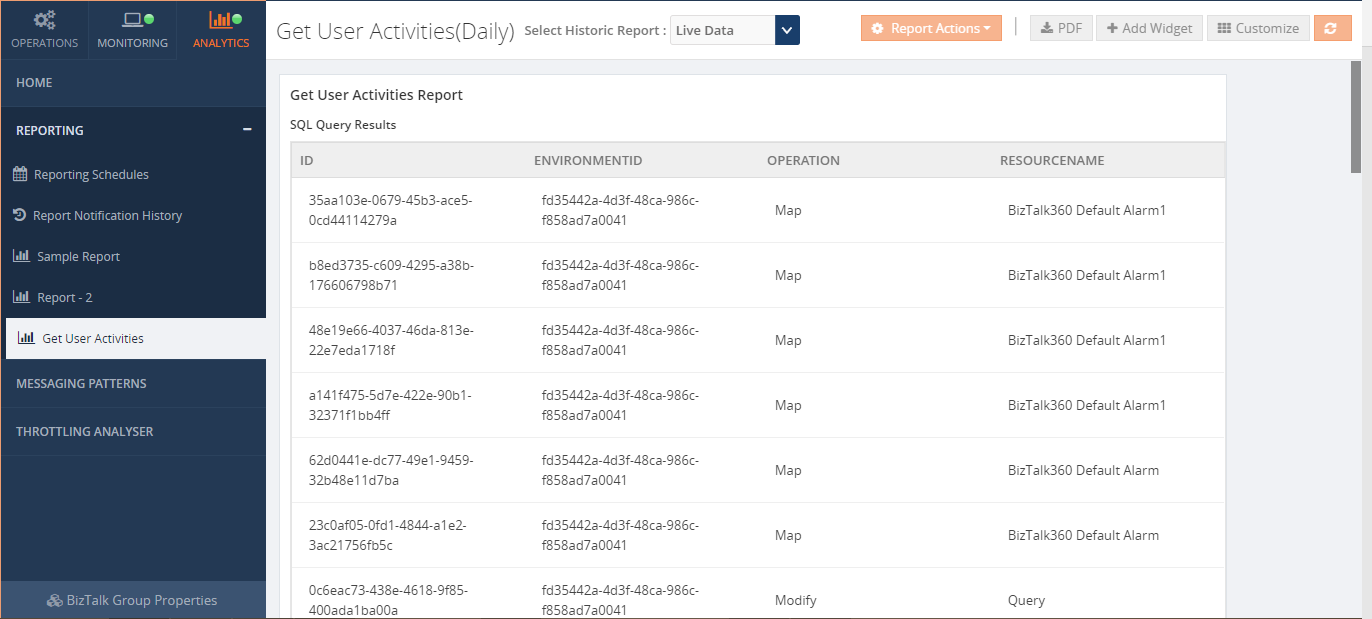
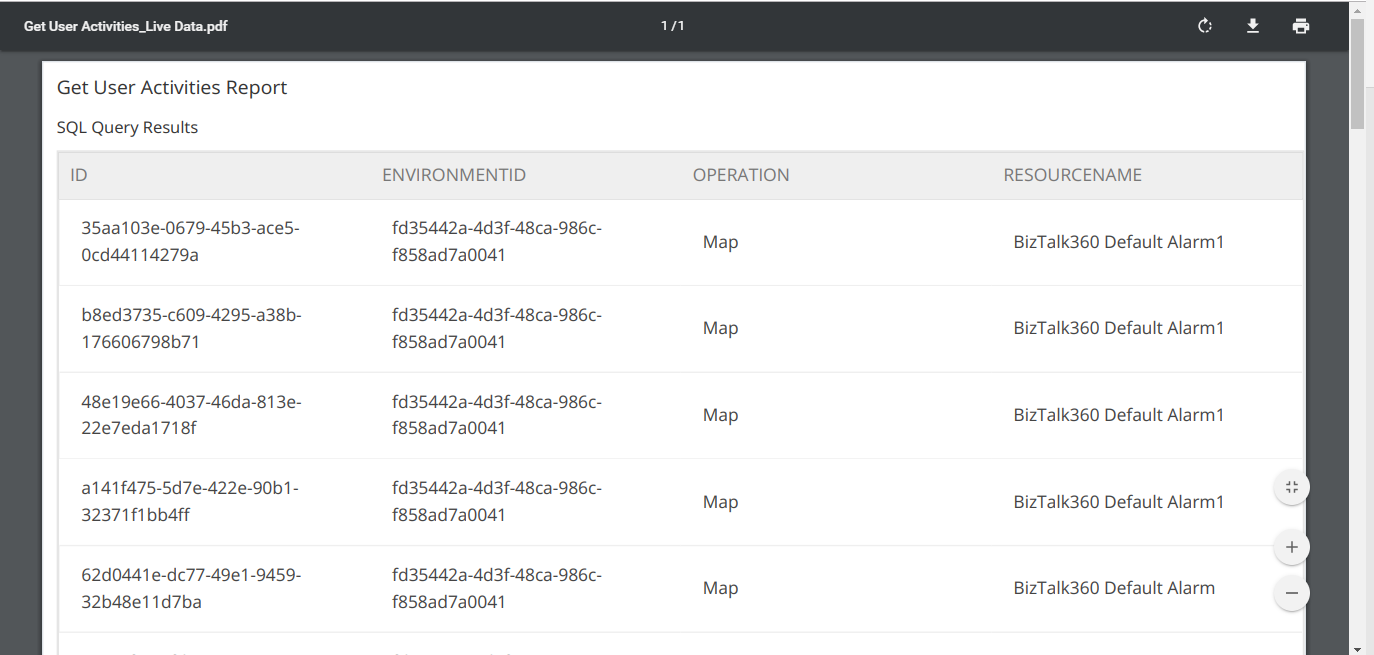
When you click on the ‘PDF’ button, the downloaded PDF document will look like below. The same will be sent to the configured email ids.
Conclusion
SQL Reports makes your work easier, you will get in time report summaries of what you want to know about your BizTalk environment.
The post Secure SQL Query Reports appeared first on BizTalk360.

by Gautam | Jul 15, 2019 | BizTalk Community Blogs via Syndication
RRDo you feel difficult to keep up to date on all the frequent updates and announcements in the Microsoft Integration platform and Azure iPaaS?

Integration weekly update can be your solution. It’s a weekly update on the topics related to Integration – enterprise integration, robust & scalable messaging capabilities and Citizen Integration capabilities empowered by Microsoft platform to deliver value to the business.
If you want to receive these updates weekly, then don’t forget to Subscribe!
Microsoft Announcements and Updates
Community Blog Posts
Videos
Podcasts
How get started with iPaaS design & development in Azure?
- Robust Cloud Integration with Azure
- Microsoft Azure for Developers: What to Use When
- Serverless Computing: The Big Picture
- Azure Logic Apps: Getting Started
- Azure Logic Apps: Fundamentals
- Microsoft Azure Developer: Creating Enterprise Logic Apps
- Microsoft Azure API Management Essentials
- Azure Functions Fundamentals
- Cloud Design Patterns for Azure: Availability and Resilience
- Architecting for High Availability in Microsoft Azure
Feedback
Hope this would be helpful. Please feel free to reach out to me with your feedback and questions.
by Sowmiya Subramanian | Jul 11, 2019 | BizTalk Community Blogs via Syndication
Monitor Host Instances in Clustered/High availability environment
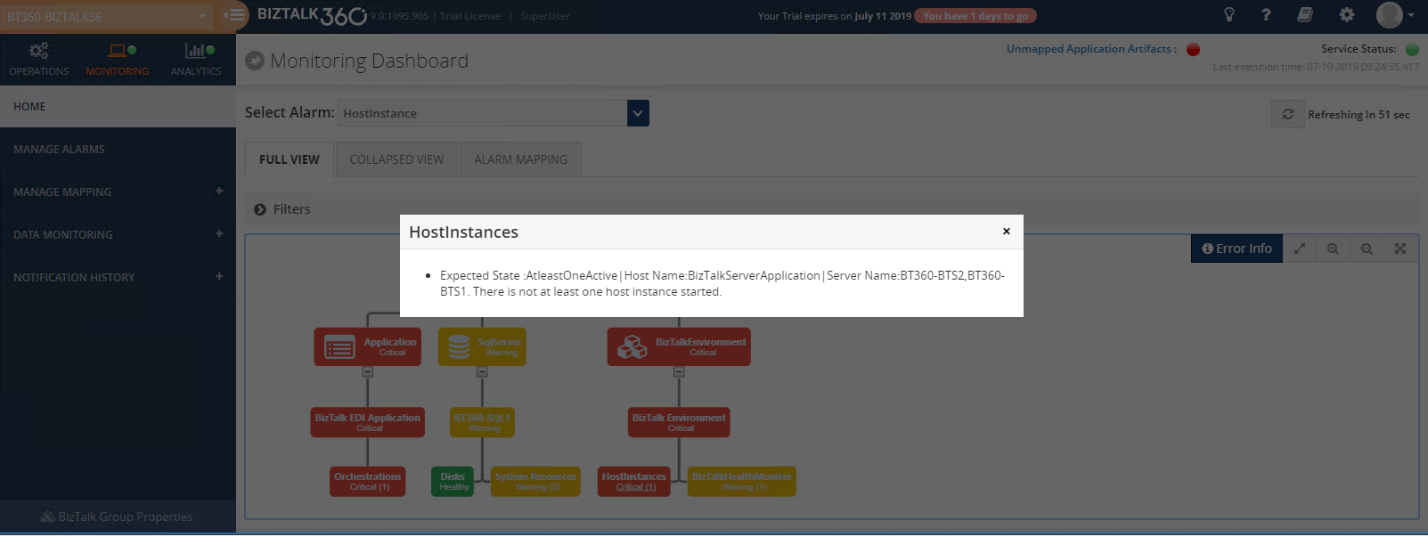
A BizTalk Server Host is a logical container that contains the BizTalk Server runtime processes in which you deploy items such as adapter handlers, receive locations (including pipelines), and orchestrations. The host instance is the runtime process where the message processing, receiving, and transmitting occurs. Obviously, it is very important to ensure your host instances are running in your BizTalk environment. BizTalk360 already made it easy for its customers by introducing the Host Instance Monitoring functionality. In BizTalk360, you can monitor the BizTalk host instances by setting the Expected State. If the expected state doesn’t match with the current state of the host instance, you will get notified.
Out of the box, BizTalk360 allows users to monitor the Clustered Host Instances using the “AtLeastOneActive” state.
If this state is assigned as the Expected State, then the monitoring service will verify that across all the instances for the respective clustered host, at least one host instance is active, guaranteeing that the server is running, and no downtime happened for that host/server. To know more about Clustered Host Instance monitoring, follow this blog link.
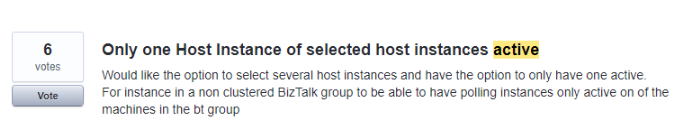
In the upcoming BizTalk360 version 9.0 Phase 2, we have extended this core functionality to monitor the host instances for high availability environment, as per the customer feedback and voting as below.
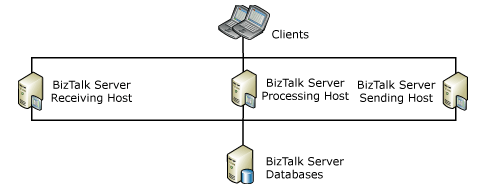
BizTalk Server High availability
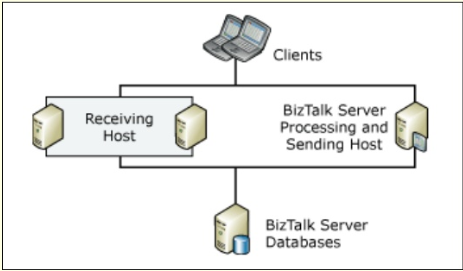
The following figure shows a BizTalk Server deployment that provides high availability for the receiving host by having two host instances on different computers. Note, that in this figure the processing and sending host is not highly available, because there is only one host instance processing the BizTalk items assigned to the host.
How BizTalk360 helps to monitor the Host Instances in clustered/High availability Environments?
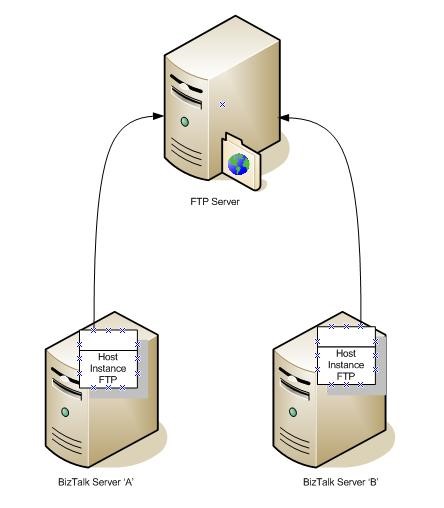
In a business scenario, if you have two BizTalk servers and they both have a Host Instance on them called “FTP”, both Host Instances will trigger a connection to this FTP server. If a file exists on the FTP server that matches your Receive Location’s file mask, both of these host instances will attempt to retrieve a copy of this file, as shown below.
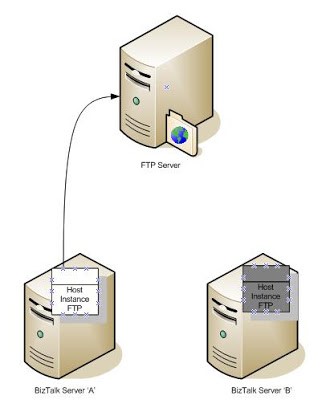
To avoid processing duplicate messages from the high availability, organizations may use the Windows Clustering. This will guarantee that only one host instance is running at a time.
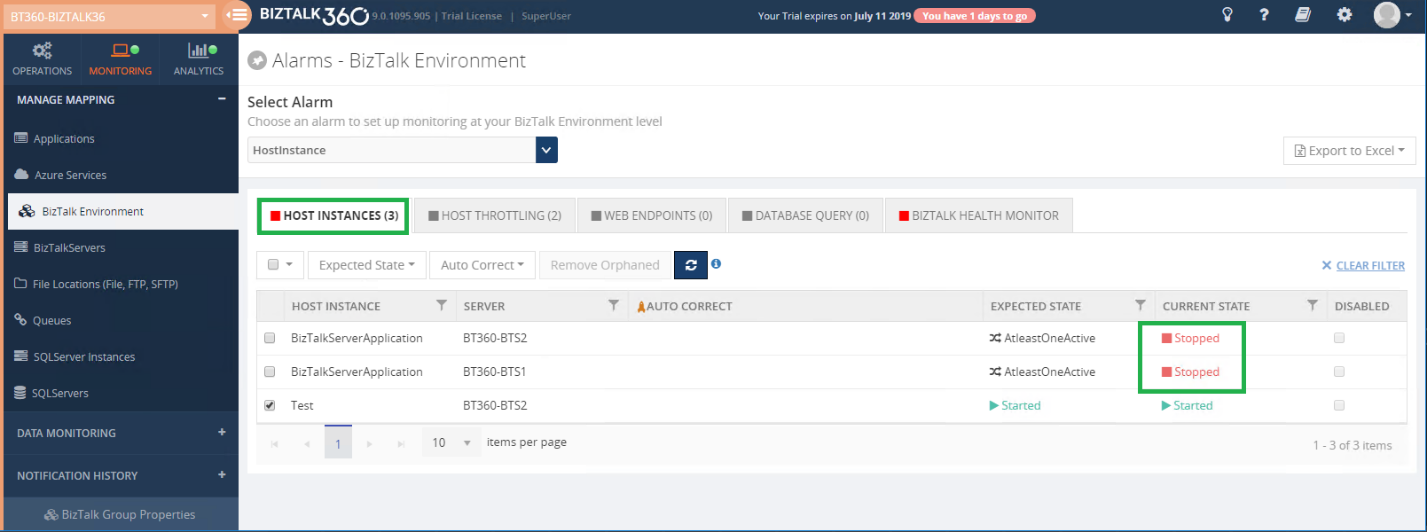
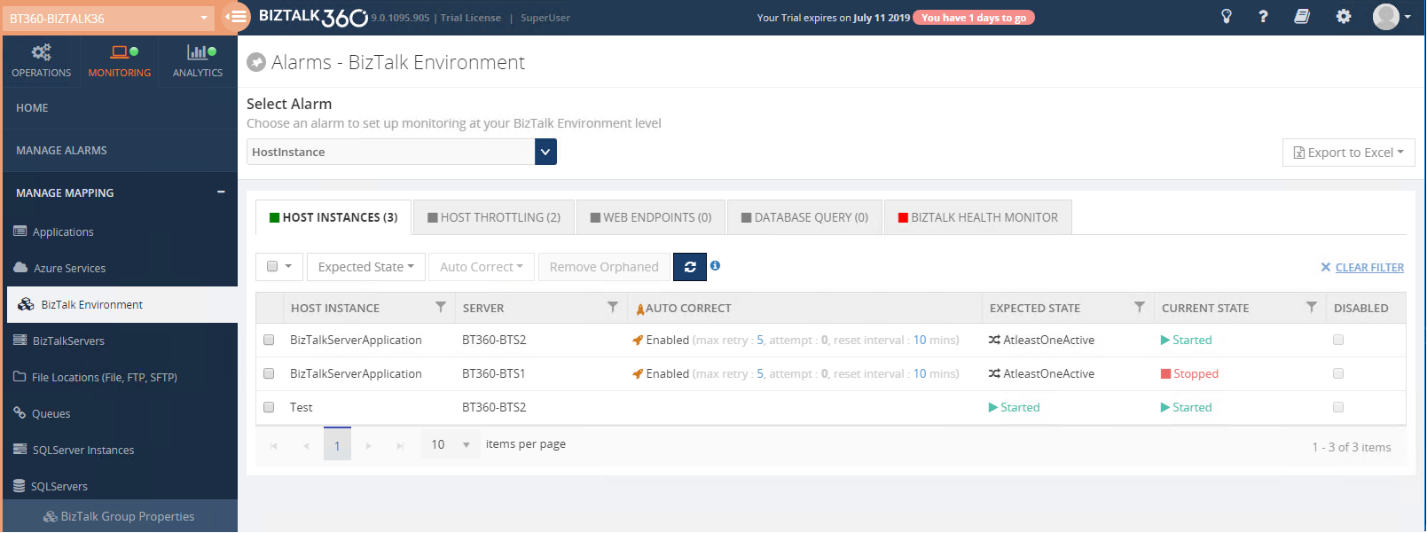
In the above cases, any one of the BizTalk servers needs to be in the active state to receive the file, if both the server is down, then the file will not get received. With BizTalk360, a user can monitor both the host instances in different servers, by setting up the “AtleastOneActive” State as shown below.

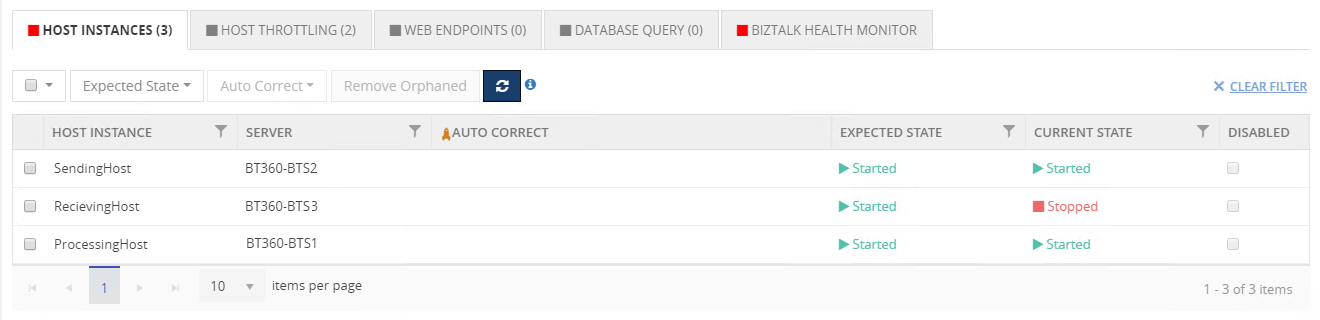
In High Availability environments, users can have all the host instances to be Active. For example, if you have 3 BizTalk Host Instances, in multiple BizTalk servers, used for different purposes like receiving, processing and sending the files.
You can set up monitoring for the above scenario in BizTalk360, by setting the expected state to Started for all the three Host Instances as you can see below. When any of the host instances goes down, you will be notified.
Setting up the “AtleastOneActive” state for Host Instances
The “AtleastOneActive” state is mainly used to monitor the Active/Passive clustered and Non-clustered host instance monitoring. The user can set the “AtleastOneActive” state only for clustered host instances and non-clustered host instances in high availability environment.
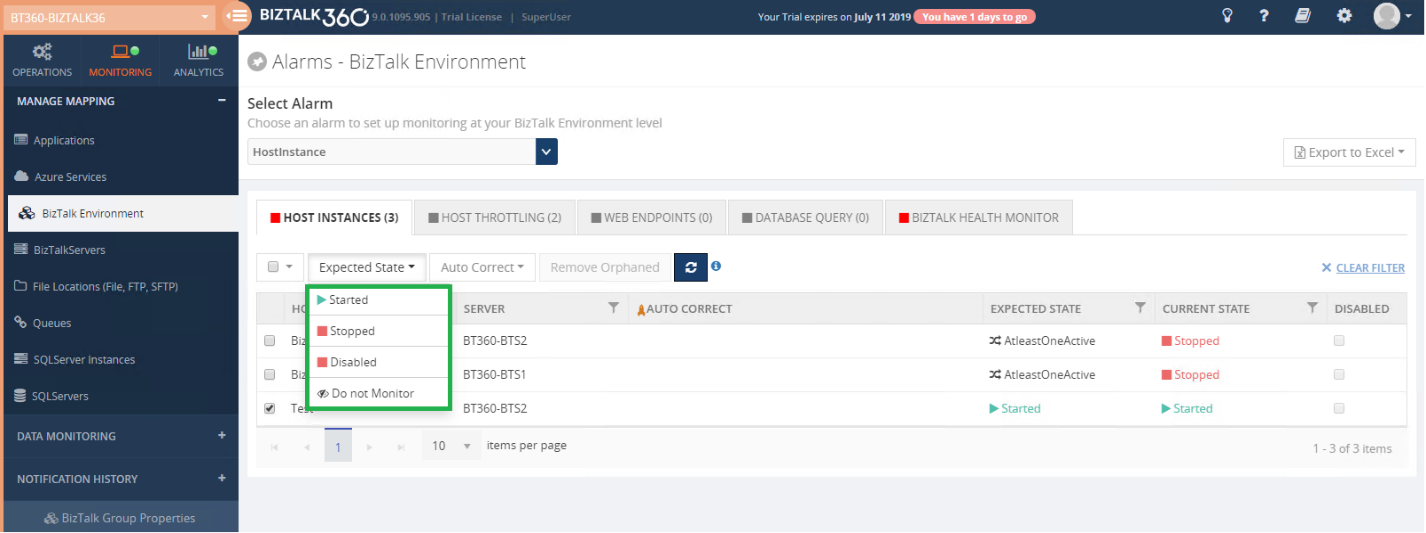
Setting the “AtleastOneActive” state will monitor across all the configured host instances of the same host and check if any one of the host instances is active. If so, the monitoring state will be healthy.
If all the configured host instances are down or stopped state, then the host instance monitoring will turn to Critical state.
The monitoring status of the host instances will get reflected in the BizTalk360 Monitoring dashboard and the same will be notified in detail in the alert email.
How does AutoCorrect functionality work for the AtleastOneActive state of the host Instance monitoring?
Do you feel frustrated to manually start host instances, when all the host instances become down in clustered/High availability environment?.
BizTalk360 comes up with another solution with its Auto Healing capability.
For Example, if you have 2 BizTalk host instances running under Clustered/high availability setup, from 2 host instances any one instance needs to be in the active state for performing file transactions. If both the host instances are down, then you need to start the host instances manually. This requires continuous monitoring, which can be handled by BizTalk360 itself, by configuring the AutoCorrect functionality to the clustered or non-clustered host instances.
In the above screenshot, the auto-correct functionality is enabled for 2 host instances in different BizTalk servers BTS1 and BTS2. If both the host instances are down, from next monitoring cycle BizTalk360 will try to auto-heal any one of the host instances from these servers. On the first attempt, it will try to start the host instance in BTS1 server. If the instance is started successfully then it skips auto-healing the next server BTS2. In case BizTalk360 fails to start the instance in BTS1, then it tries to start the host instance on the server BTS2. BizTalk360 will try to start any one of the host instances until it reaches the maximum attempt count. You can also reset the auto-correct by setting the reset interval. To know more about the auto-correct feature click here.
Conclusion
Monitoring the Host Instances in Clustered and High availability environment is a must for a healthy BizTalk environment. BizTalk360 monitors those host instances in an easy and simple manner. It also manages the host instances and ensures they are up and running, by using the auto-correct functionality. The upcoming version of BizTalk360 will ease your way of monitoring the host instances in clustered and high availability setup.
The post Monitor the Host Instances in Clustered/High availability environment appeared first on BizTalk360.
by Senthil Kumar Palanisamy | Jul 9, 2019 | BizTalk Community Blogs via Syndication
Introduction
BizTalk360 is the one-stop tool to manage operations, monitoring and analytics of your BizTalk environment. Over 80+ features in the product bring all the BizTalk Tools like EDI, ESB, Business Rules, BAM, and the BizTalk Health Monitor. It is a matured product with these features included of which there have been 50+ iterations of product updates. User Access Policies with governance audit (Security), Operational Tool Integration, Monitoring, and Analytics are among the BizTalk360 core capabilities. BizTalk360 has brought important business scenarios into the product like:
- Auto-healing of BizTalk Artifacts
- Automated actions on Suspended Instances
- Process Monitoring and Data Monitoring
These capabilities make BizTalk360 the must-have tool to manage the BizTalk Server.
Customization in BizTalk360
BizTalk360 has provided solutions to common Integration scenarios (BizTalk, Azure). In addition to the above-mentioned features, BizTalk360 has provided the opportunity to integrate custom solutions into the product through:
- Custom Notification Channels
- Custom Widgets
- Create Alarm Tool
Custom Notification Channels and Custom Widgets are bundled into the product, during the major update of v8.0. Users are taking advantage of these features, by customizing alert notification to their preferred channels and visualize their important data in BizTalk360 Dashboard through Custom Widgets.
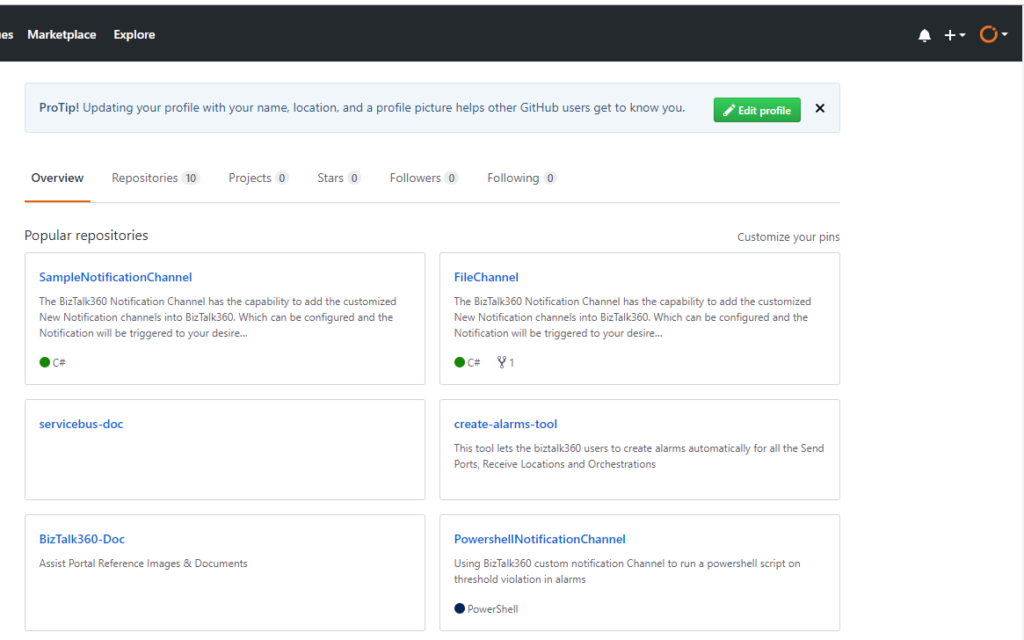
The source code of such customized solutions (Notification channels, Widgets and Alarm Creation Tools) is available in our GitHub Project.
Users can utilize the source code to create new customized solutions or extend their existing solution to meet their business requirements.
Users can commit their solutions into BizTalk360 GitHub which will benefit other users who follow this channel.
Custom Notification Channels
Custom Notification Channels provide a platform to send alerts to an external system, like your ticketing system, internal databases, calling a REST endpoint, executing a PowerShell script, etc. If you want to know how you can create, customize and configure new or existing custom notification channels, read this article.
BizTalk360 has out of box solutions for the following Custom Notification Channel:
Users can create their own customized solution for their ticketing systems rather than ServiceNow or trigger activities (PowerShell) based on their business needs. We can see some of the use cases that users can take by customizing the notification channels:
- ServiceNow – Customers can extend the BizTalk360 ServiceNow notification channel to add more fields to meet the business process
- PowerShell Notification – Users are utilizing this capability to trigger actions when monitoring conditions are violated
-
Start/Stop Host Instances
-
Terminate dehydrated service Instances
-
Terminate messages after X number of days
-
Manage Maintenance mode during BizTalk Deployments
- Microsoft Teams – Enhance the Microsoft Teams notification channel to include a message card
- SMTP Notification – Users can improve on default notification by using the SMTP Notification Channel to configure Up, AutoCorrect Email separately.
The source code in the GitHub project can be pulled, customize the code to meet your business scenario and then configure it in BizTalk360 to be able to use your custom solutions.
Custom Widgets
Custom Widget is a powerful feature by which users can take advantage in BizTalk360. Customers can integrate their business process flows by using Custom widgets. This allows integrating solutions with BizTalk360 own API’s, as well as third-party API’s (like SalesForce, Power BI, Azure, etc.) and database queries by using the Secure SQL Queries.
Use Cases:
- Business Process – Few customers are integrating their business flows using their internal API’s and created custom widgets by which business users take advantage of BizTalk360 dashboard integration
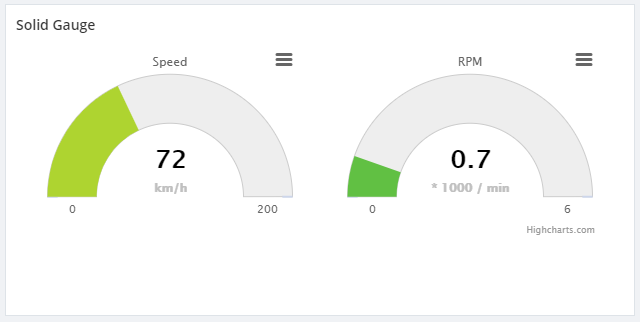
- Graphical Representation – Visualize the reports in Solid gauge using High Charts, which is available in BizTalk360
- Consolidated View of Monitoring Dashboard – Users are able to customize their monitoring dashboard to a single view, by grouping type of monitors
- Secure SQL Query – This provides the opportunity to pull data from other databases into the BizTalk360 dashboard through Secure SQL Queries
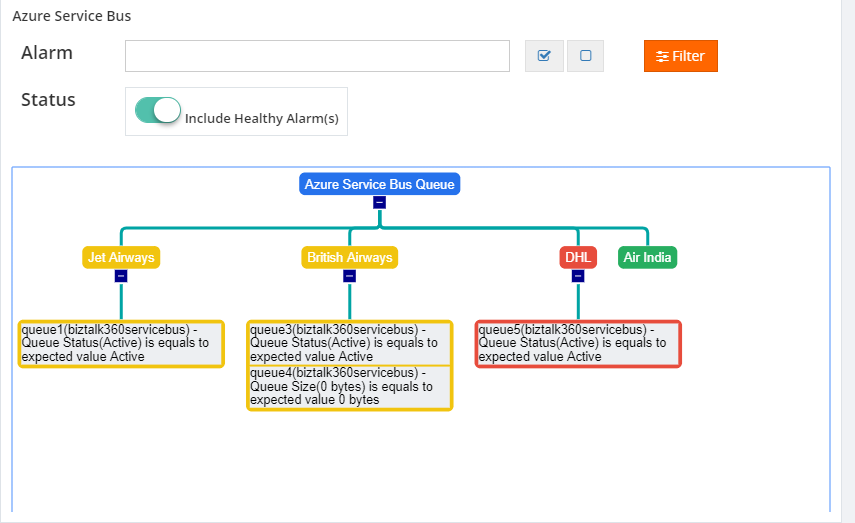
- Monitoring Status– Many of our users are using dashboards to monitor their business flow integrations. They can create a custom widget and pin it to a dashboard to monitor the integration. You can think of showing the following:
-
Errors & Warnings of an Alarm in a Grid
-
Last Date Time of Errors & Warnings
-
Web Endpoint Monitoring status of an integration
-
Number of Suspended Instances in an alarm
-
Number of messages processed in an application
- Monitoring SQL Jobs – SQL Jobs are monitored through BizTalk360 API’s by creating a custom widget
Alarm Configuration
Another example of running third-party executables is the creation of BizTalk360 alarms. Normally, you’ll have to do this manually after each deployment of a new or changed BizTalk application. This too can be a time-consuming and error-prone task.
By using BTDF and a tool called BT360Deploy, you can automate the creation of alarms during the deployment of your BizTalk application.
In complex BizTalk environments, creating Alarms and mapping artifacts to monitor is a tedious process. To overcome this challenge, our Technical Lead (Lex) has written an article to configure BizTalk Artifacts for monitoring through the Alarm Creation Tool. In that article, he explained how the BizTalk Deployment Framework (BTDF) is integrated with BizTalk360 Monitoring.
Conclusion
Users can take advantage of custom solutions using Custom Notification Channel, Custom Widgets and Alarm Creation Tools. Customers get the maximum benefits out of BizTalk360 when creating custom solutions.
The post BizTalk360 GitHub Project appeared first on BizTalk360.

by Gautam | Jul 8, 2019 | BizTalk Community Blogs via Syndication
Do you feel difficult to keep up to date on all the frequent updates and announcements in the Microsoft Integration platform and Azure iPaaS?
Integration weekly update can be your solution. It’s a weekly update on the topics related to Integration – enterprise integration, robust & scalable messaging capabilities and Citizen Integration capabilities empowered by Microsoft platform to deliver value to the business.
If you want to receive these updates weekly, then don’t forget to Subscribe!
Microsoft Announcements and Updates
Community Blog Posts
Videos
Podcasts
How get started with iPaaS design & development in Azure?
- Robust Cloud Integration with Azure
- Microsoft Azure for Developers: What to Use When
- Serverless Computing: The Big Picture
- Azure Logic Apps: Getting Started
- Azure Logic Apps: Fundamentals
- Microsoft Azure Developer: Creating Enterprise Logic Apps
- Microsoft Azure API Management Essentials
- Azure Functions Fundamentals
- Cloud Design Patterns for Azure: Availability and Resilience
- Architecting for High Availability in Microsoft Azure
Feedback
Hope this would be helpful. Please feel free to reach out to me with your feedback and questions.