by Sowmiya Subramanian | Oct 22, 2019 | BizTalk Community Blogs via Syndication
From the upcoming BizTalk360 version 9.0 phase 3 on, we extend our support to monitor SQL Server clusters. By configuring the SQL Server Network Name for monitoring, BizTalk360 will start monitoring the current active node and in case of failover scenario, BizTalk360 will automatically take the active server for monitoring.
It’s important to make sure the physical infrastructure of your SQL servers like disks, CPU, memory, etc., are healthy for proper functioning. BizTalk360 made this simpler by having the SQL Server Monitoring capability.
BizTalk360 will alert to the user when the configured disk space, CPU, memory usage exceeds the set percentage.
Challenge
In existing BizTalk SQL Monitoring, we came across a few challenges on monitoring the clustered SQL Server
- The user could not find the active node while monitoring the clustered SQL Server.
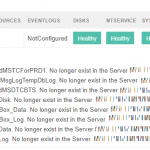
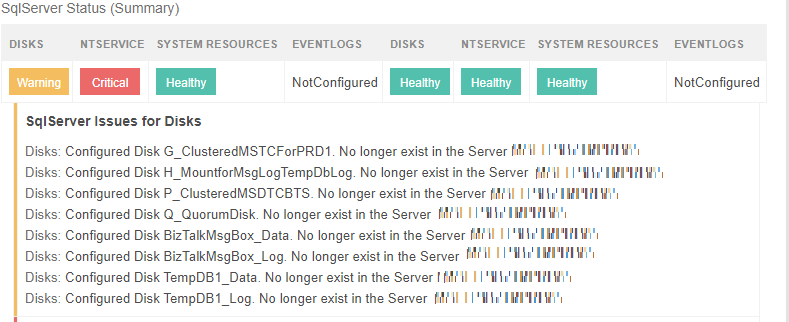
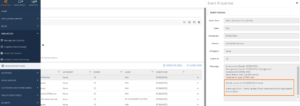
- When the Failover happens, the disk monitoring could not identify the disks of the failover node and an error message was displayed as below.
Scenario 1 (Active/Active): As the same as the previous version of BizTalk360, you can monitor the Clustered SQL Server (Active/Active) or a non-clustered SQL Server, by simply adding the SQL Server physical node in the “Add SQL Server For Monitoring”.
Scenario 2 (Active/Passive): In BizTalk360, you can monitor the Clustered SQL Server (Active/Passive), by adding the common “SQL Server Network Name” for the physical node into the “Add SQL Server For Monitoring”. It will automatically pick up the active server node for monitoring and then it will start monitoring the active node. If a Failover happens, then it will automatically switch to the failover node (Active Node).
Let’s take a quick look at how you can monitor Non-Clustered/Clustered SQL Server (Active/Passive) using BizTalk360.
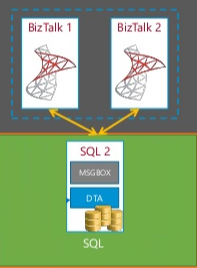
Non-Clustered SQL Server
The BizTalk server database will be pointed to one SQL server Instance as below.
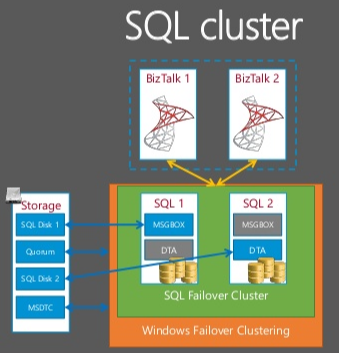
Failover Clustered SQL Server
Windows Failover Clustering is a high-availability option which is designed to increase the uptime of SQL Server instances. A SQL Server cluster includes two or more physical servers, called nodes. One is identified as the active node, on which a SQL Server instance is running the production workload, and the other is a passive node, on which SQL Server is installed but not processing the workload. If the SQL Server instance on the active node fails, the passive node becomes the active node and begins to run the SQL Server production workload with some minimal failover downtime.
The SQL Server Network Name is used to identify a failover cluster (active node) on the network. This was known as the virtual SQL Server name.
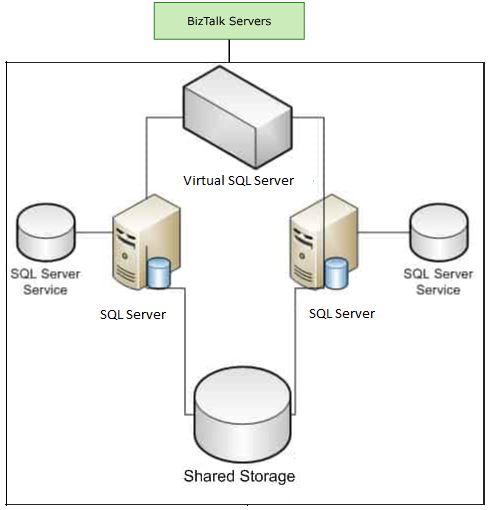
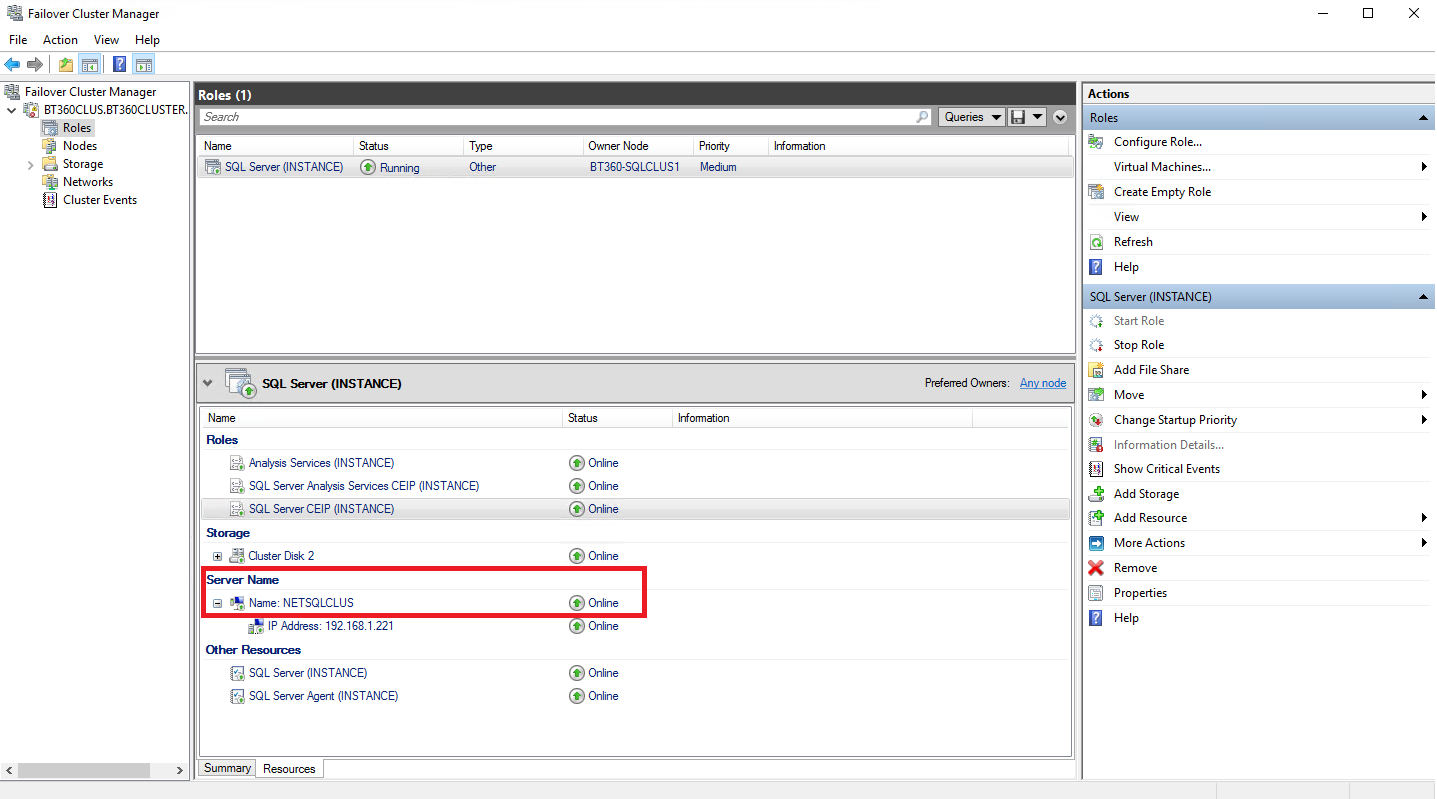
The virtual SQL Server will automatically connect to the currently active node. You can find the SQL Server Network Name as below in the Failover Manager.
Prerequisites or Permissions required to monitor the Non-Clustered/Clustered SQL Server in BizTalk360
- MSDTC should be enabled in the BizTalk360 server and SQL Server. In the case of Clustered SQL Server, MSDTC should be enabled in all the SQL Servers which belong to the cluster. Follow the link to enable the MDTC.
- If BizTalk360 is installed using the service account, then the service account should get added to the Administrator group in the SQL Server node. In the case of a Clustered SQL Server, the service account should get added to both physical SQL Server Nodes(active & passive node).
How the (Non-Clustered) SQL Server is monitored in BizTalk360
Let’s have a detailed look at how you can monitor a non-clustered SQL server using BizTalk360.
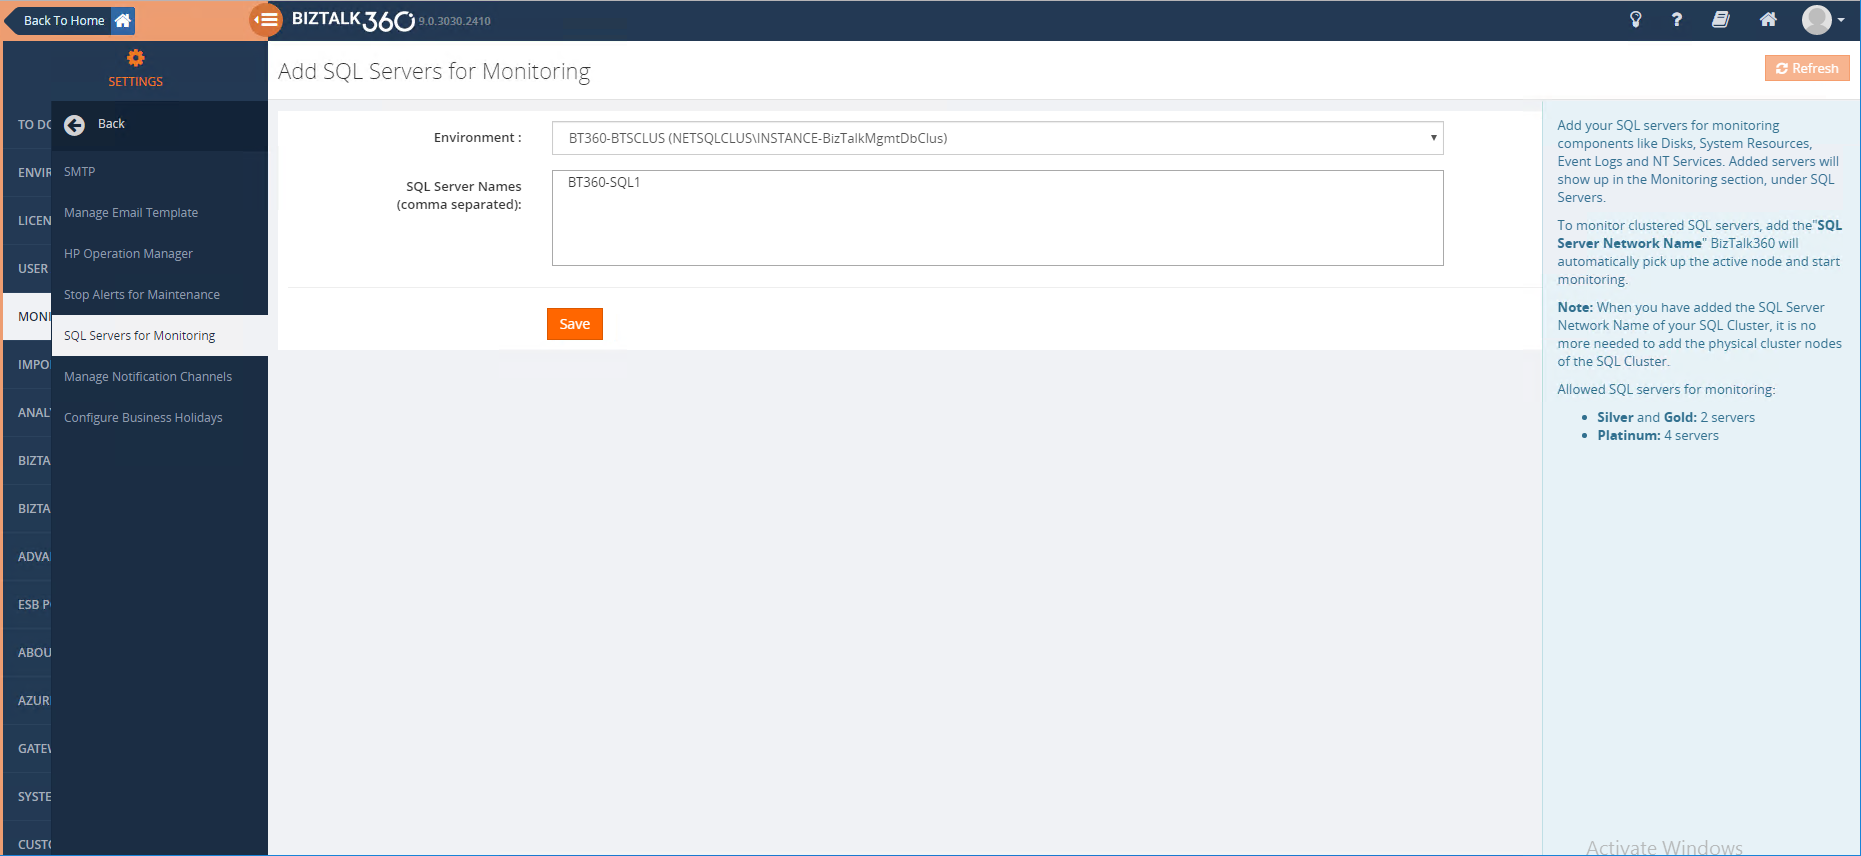
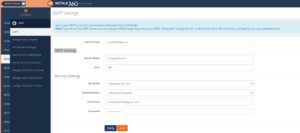
By adding the Physical SQL server name for Monitoring, you can monitor the disks, CPU, memory, etc. You can add the SQL Server name under BizTalk360->Settings ->Monitoring and Notification ->Add SQL Server for monitoring.
Note: For non-clustered SQL servers you must add the physical SQL Server name for monitoring.
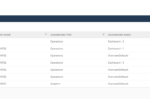
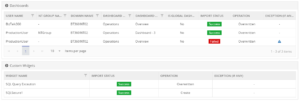
Once the above configuration is done, the added SQL servers will get available for monitoring as below.
The configured server will be listed for monitoring under BizTalk360->Monitoring ->Manage Mapping->SQL Servers. By clicking on the Server name you can configure Disks, System Resources (CPU, memory), Event Logs and NT Services of the specific SQL server for monitoring.
Disk Monitoring
A click on the Disks tab, will automatically pick up all the disks in the configured SQL server and show a graphical view of the disk properties with total and available disk space. To monitor the disk, you can simply set the appropriate warning and error threshold level for each disk in percentage (%), as shown below. For more detailed information, follow the article link.
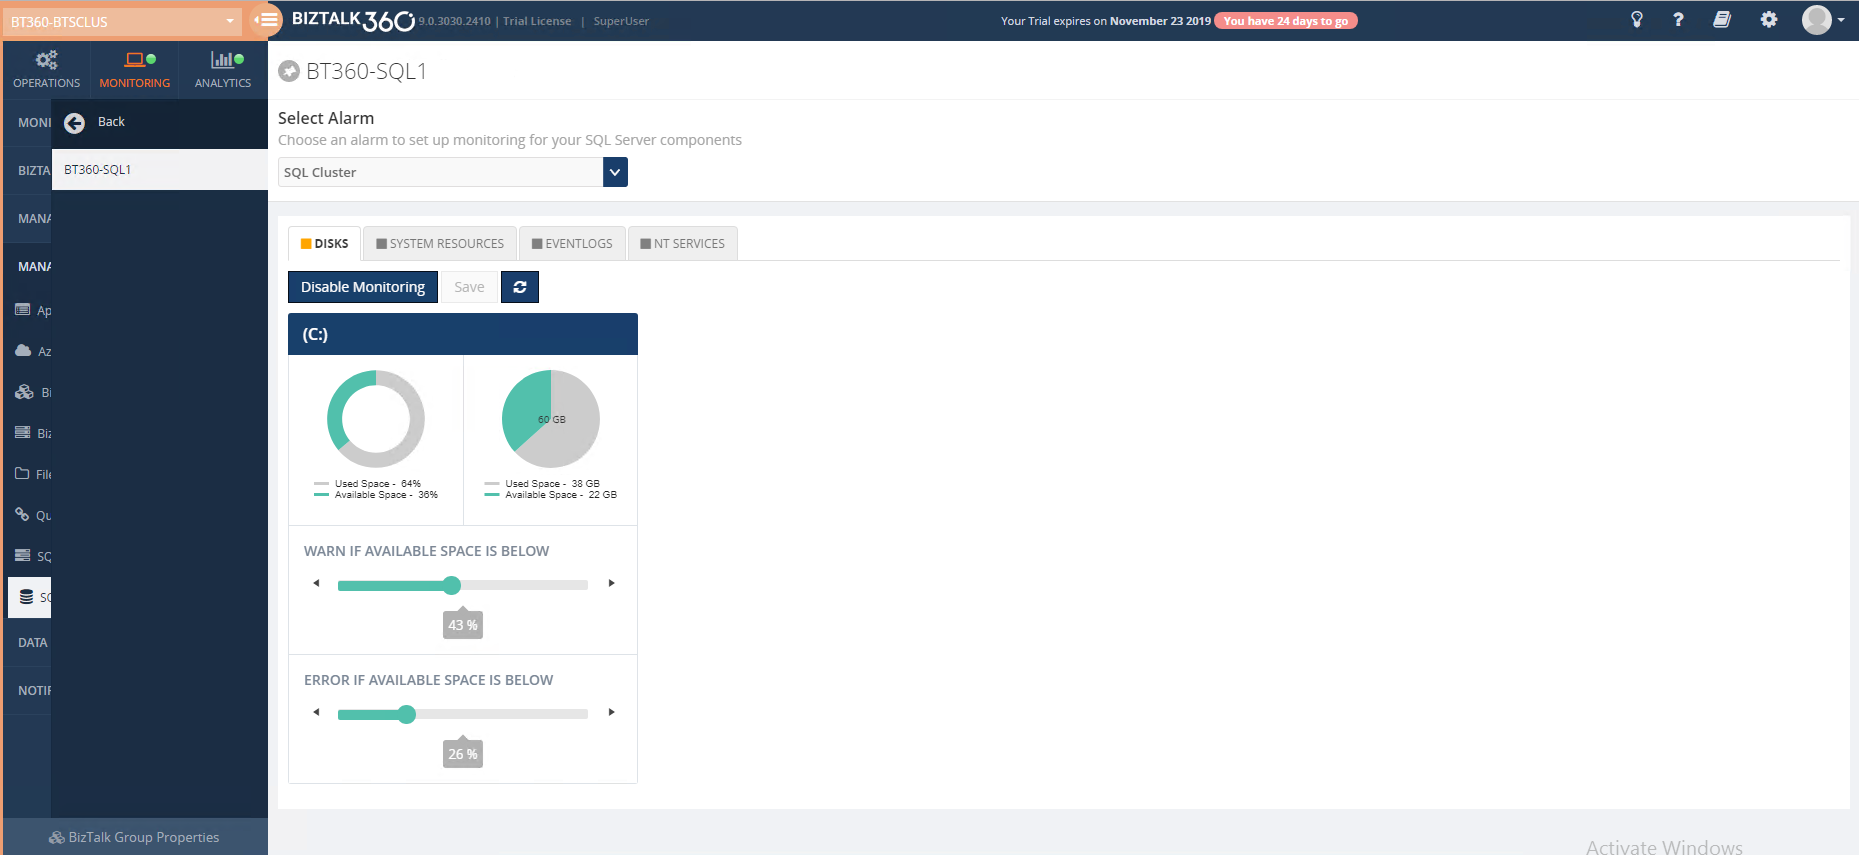
Note: The system reserved and the unpartitioned disk will not be available for monitoring.
System Resource Monitoring
Click on the System resource tab to monitor the CPU usage and Memory consumption. Next, configure the appropriate warning and error thresholds for CPU and memory. The system will start alerting if the system condition hits the configured warning/error level for the persisted duration, which you can see below. For more detailed information about the CPU and Memory, follow the article link.
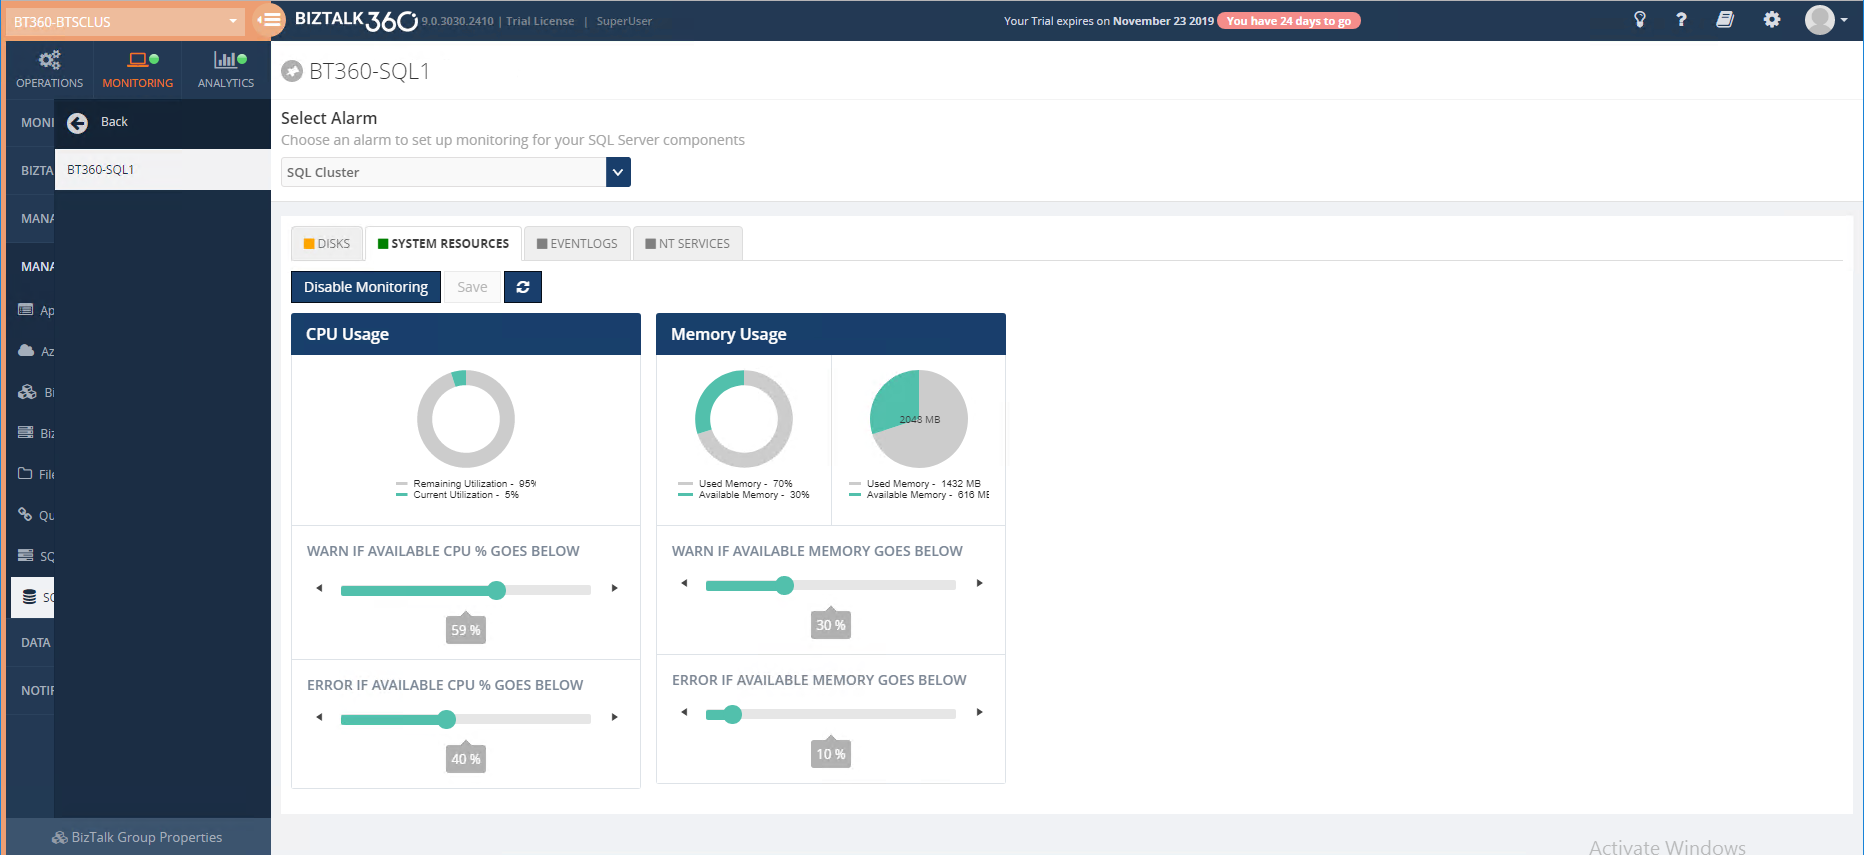
By default, warning and error thresholds for CPU and memory will be in 30% and 10%, but you are free to reconfigure these thresholds depending on your own requirements
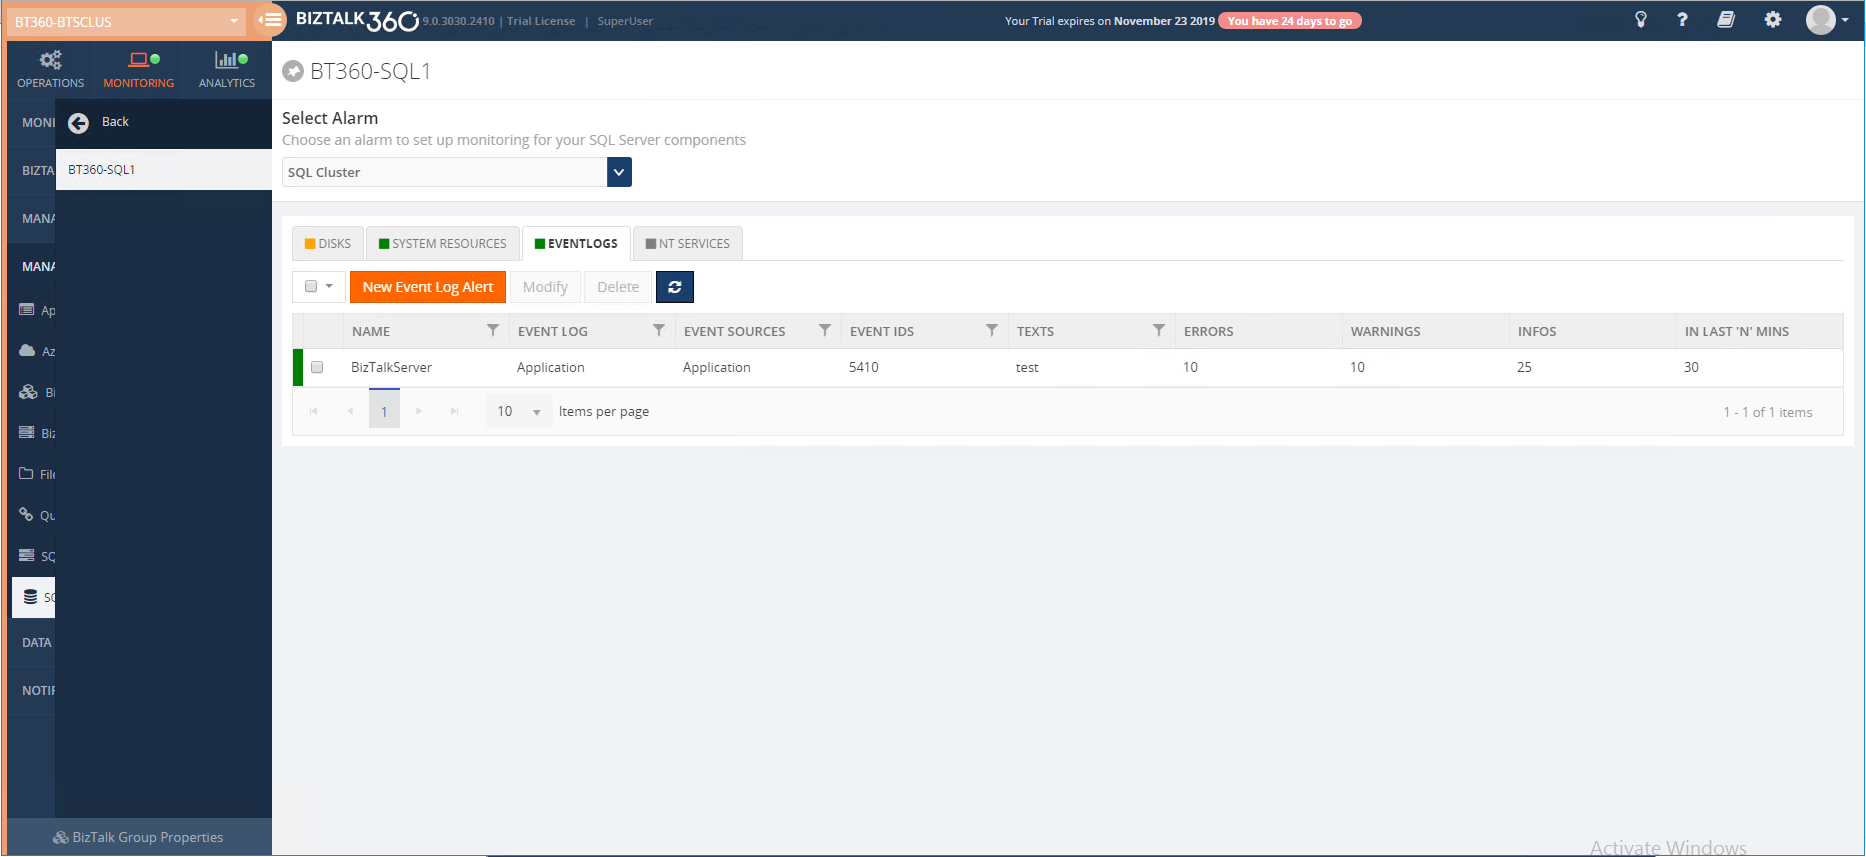
Event Log Monitoring
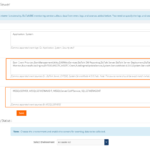
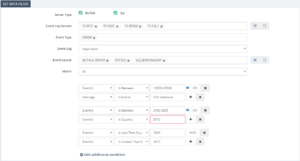
You can monitor for various event log entry conditions using BizTalk360. You can have multiple combinations of event log monitoring, for example, certain sources, certain event ids, certain text in the message, with configured threshold conditions as below.
Note that you can also set up Event Log monitoring in the Data Monitoring section. Setting it up there helps in correlating event log entries across multiple servers. For more detailed information about the Event Log monitoring, follow the article link.
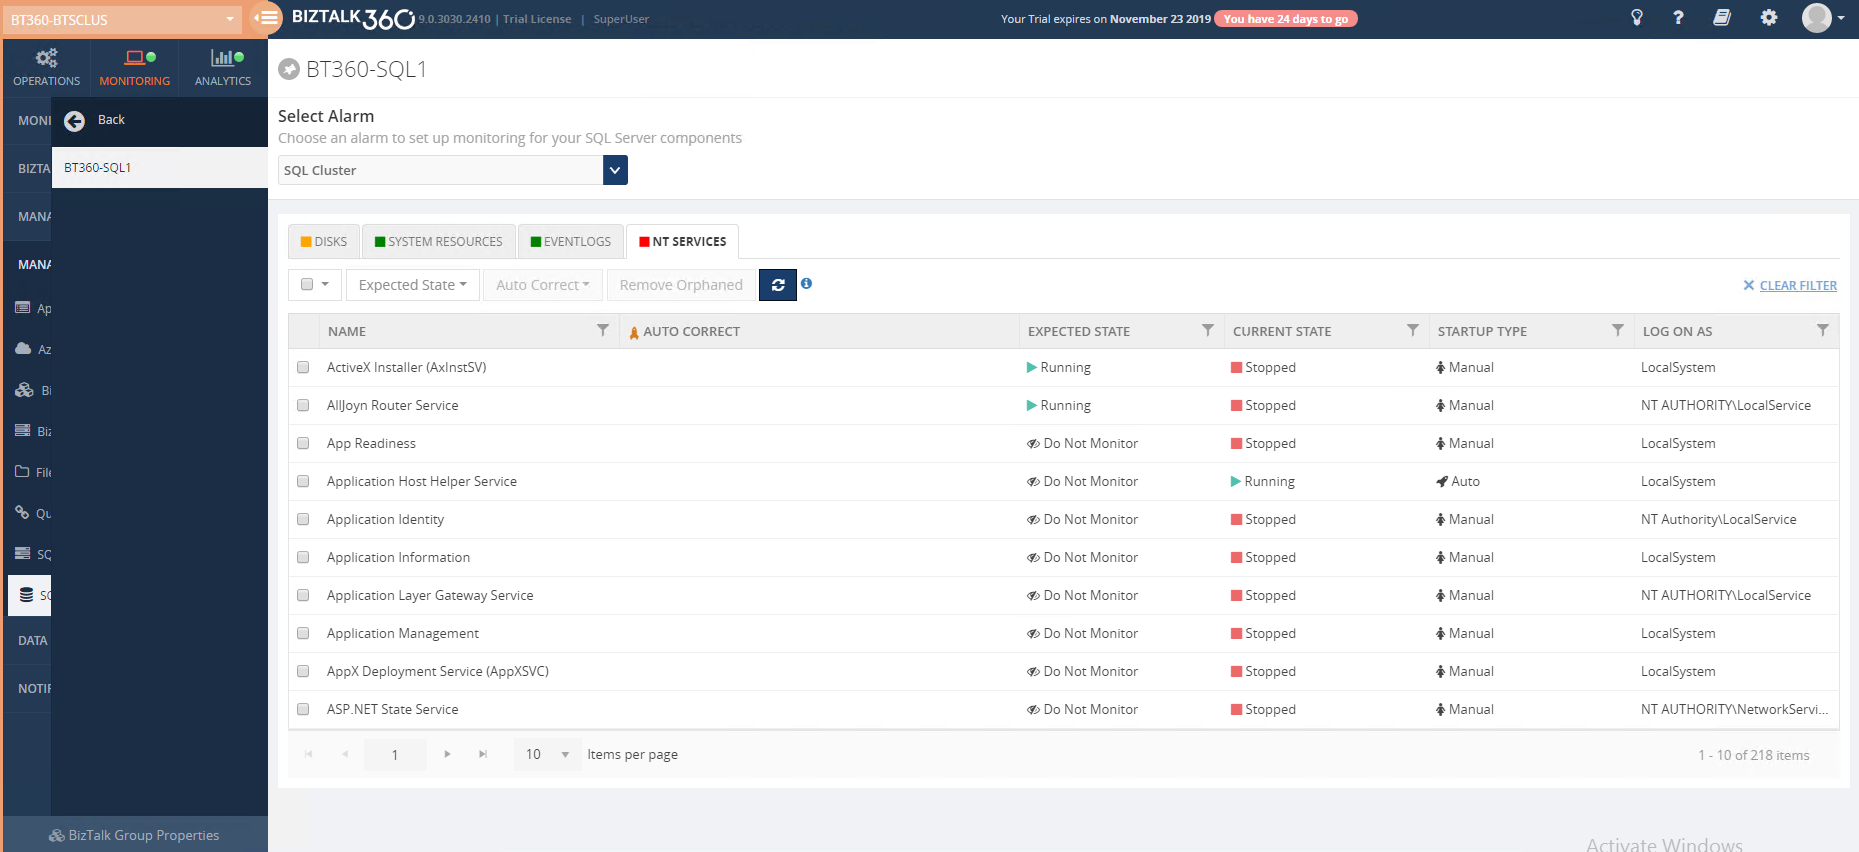
NT Service Monitoring
You may want to keep an eye on certain NT services that are running in SQL Server. BizTalk360 gives you the opportunity to automatically monitor the NT services by just setting the expected state. BizTalk360 will alert you when the configured expected state is not equal to the current state. For more detailed information about the NT Services monitoring, follow the article link.
How a SQL Clustered node is monitored in BizTalk360
Now, let us have a quick look at how we can use BizTalk360 to monitor a clustered SQL server.
Configuring a Cluster SQL Server for monitoring
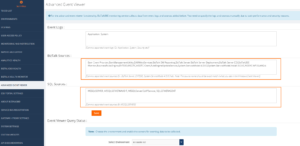
If you want to monitor a Clustered SQL Server, all you need to do is, specify the name of the Virtual SQL Server (SQL Server Network Name). When you connect to SQL Server using this SQL Server Network Name, BizTalk360 will automatically connect to the currently active node.
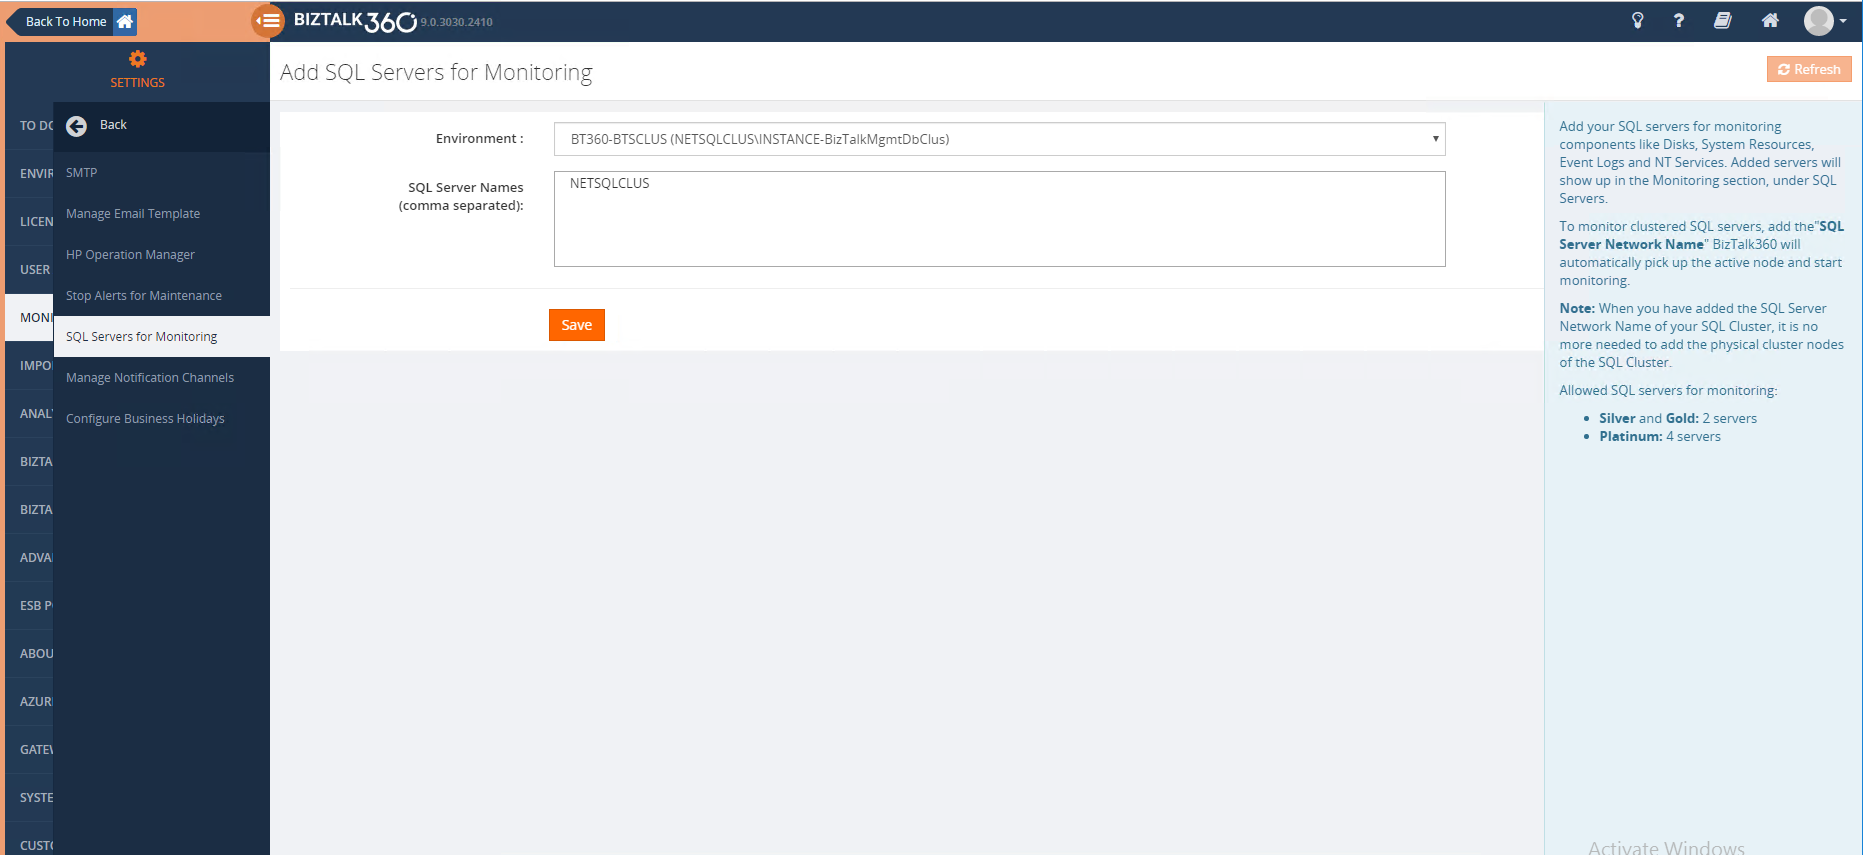
Note: It is is enough to add just the SQL Server Network Name for monitoring the SQL Cluster, it is not required to add the actual physical SQL cluster nodes.
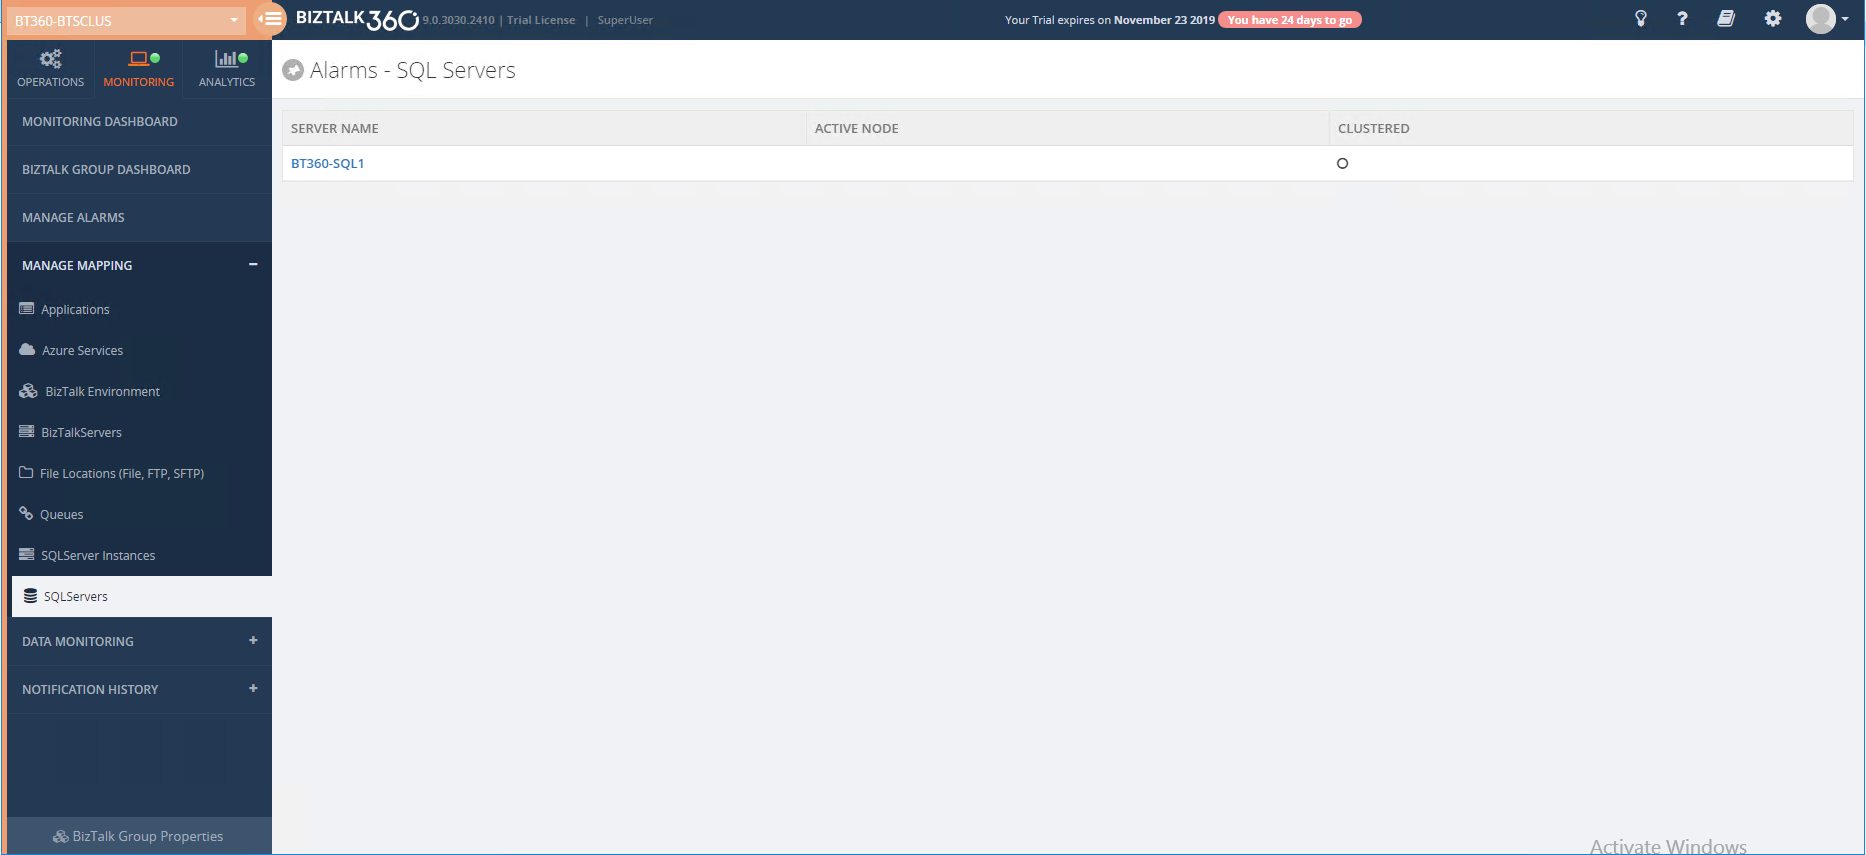
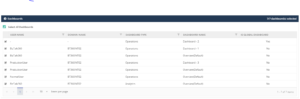
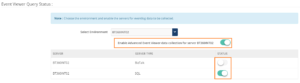
Once the above configuration is done, then the added clustered SQL Server Name will get listed for monitoring as shown below.
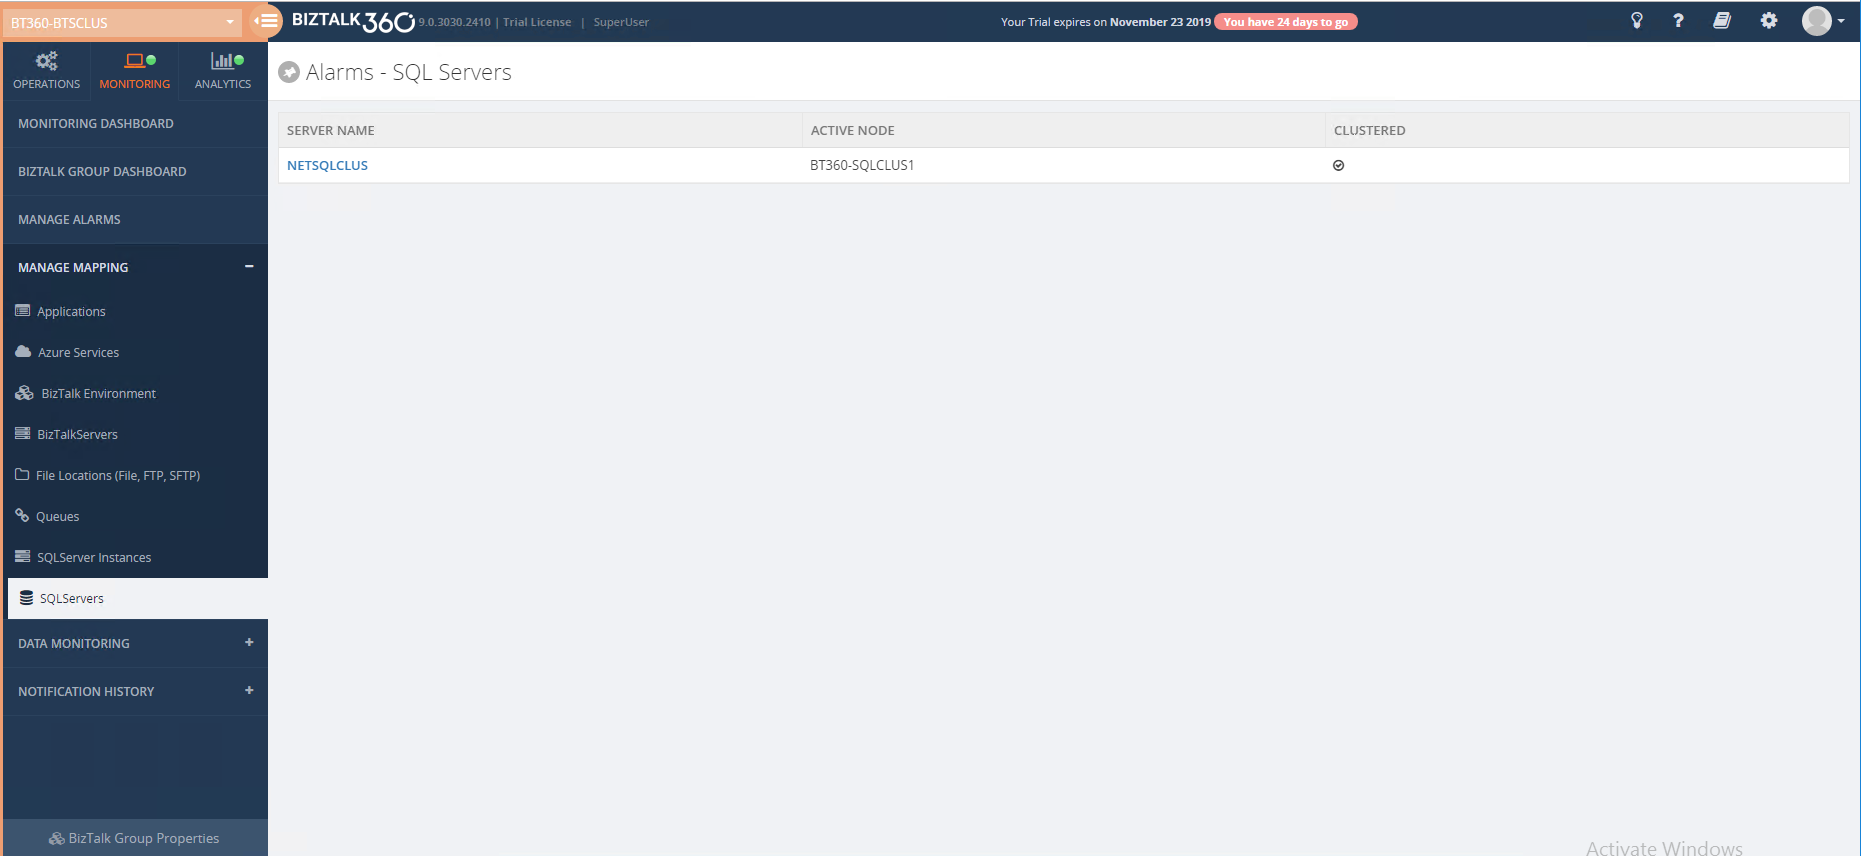
It will automatically pick the active node and the state of the (clustered) server.
Disk Monitoring
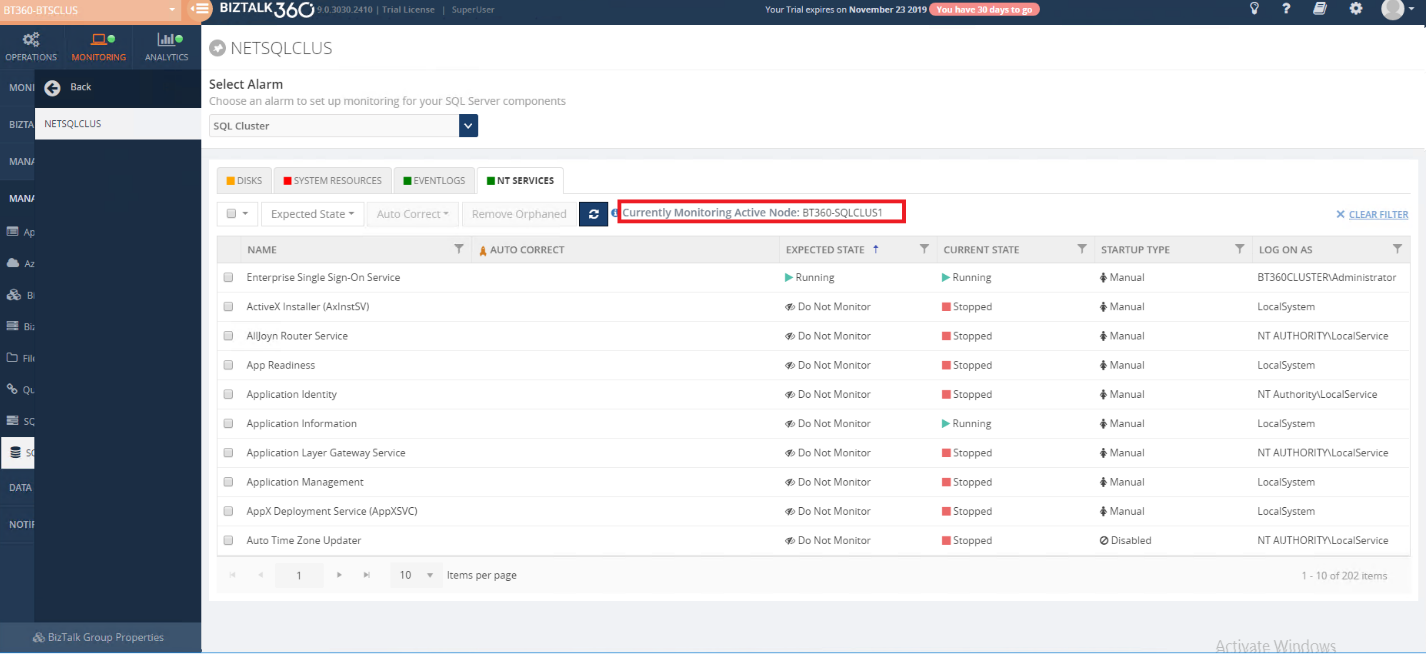
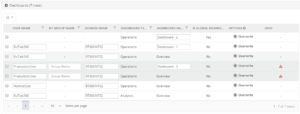
In clustered SQL Server monitoring, it will show the currently active monitoring Node, and also it will automatically pick up all the disks in the currently active node.
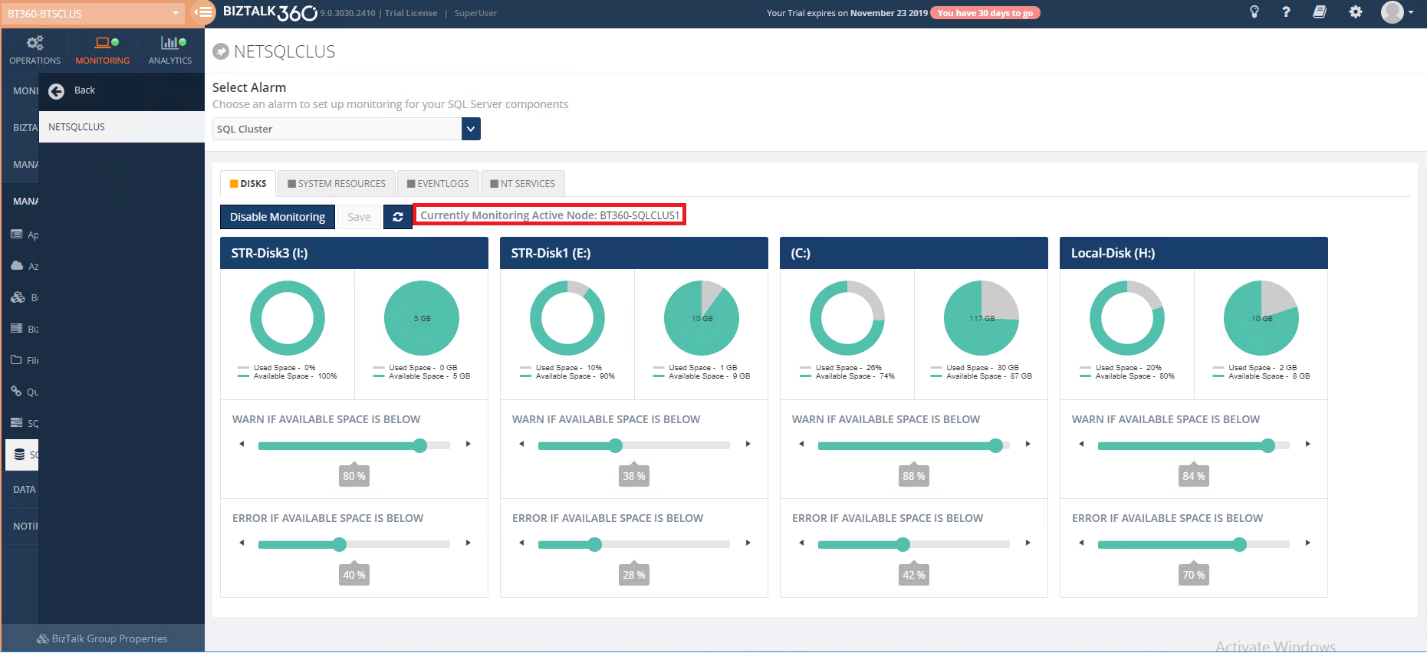
By Default, warning and error thresholds for each disk will be in 20% and 10%. You can also change the warning and error percentage as per your need and save it. Then, the currently active node will get monitored by the BizTalk360. If the disk space exceeds the set percentage, BizTalk360 will send the alert to the respective user.
If the “Failover” happens for the monitored disk, then the configured disk will automatically switch to the active server(Failover server).
Consider a scenario if Node 1 has disk A and disk B which are configured for monitoring (error and warning condition as 50 %). Let say, Node 1 went down, then BizTalk360 will automatically pick up the currently active node 2 for monitoring. But what happens if node 2 has Disk B and Disk C?
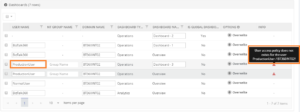
In the above scenario, the default monitoring configuration i.e error and warning condition 20% is set to the Disk C. Disk A, which is available in node 1 but not in node 2 will be moved to the orphaned state.
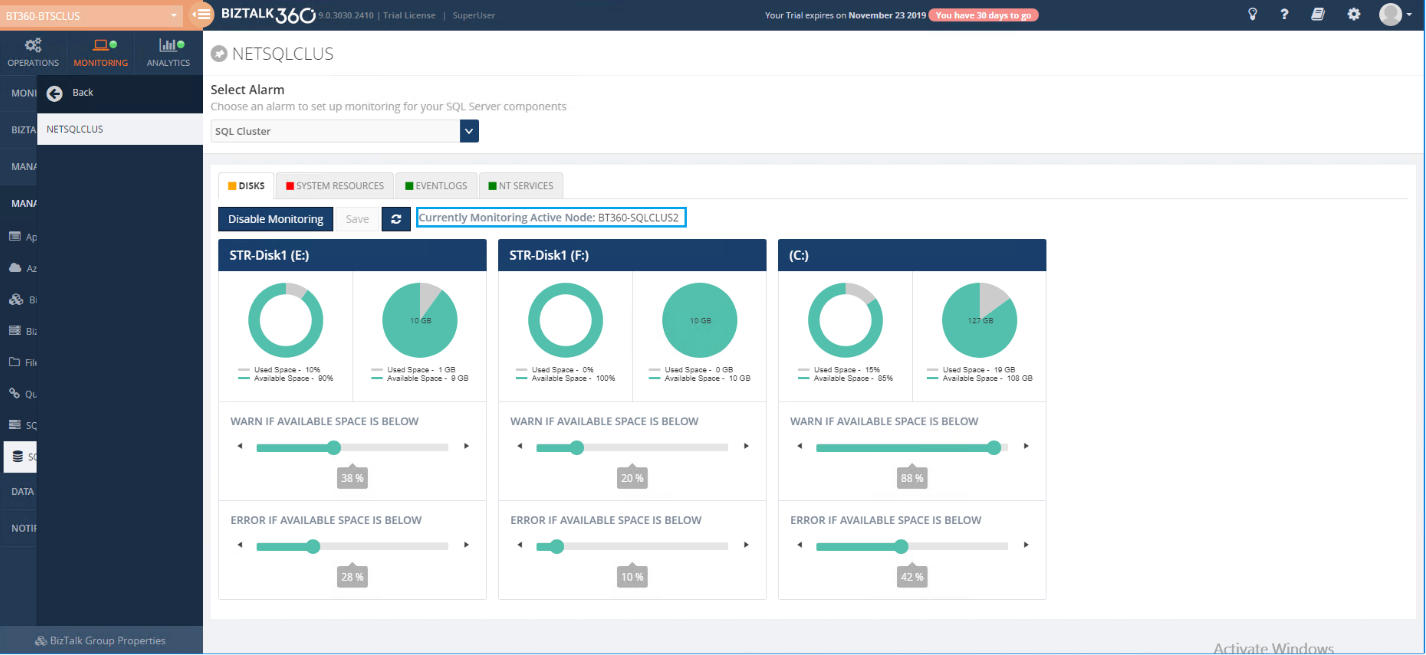
As in the above screenshot, the “STR-Disk1 (F:)” disk is newly added after failover with the default warning and error conditions. The other two disks are “STR-Disk2 (E:)”, which is a shared volume, and the (C:) drive is a common volume, which is also configured with the existing warning and error percentages.
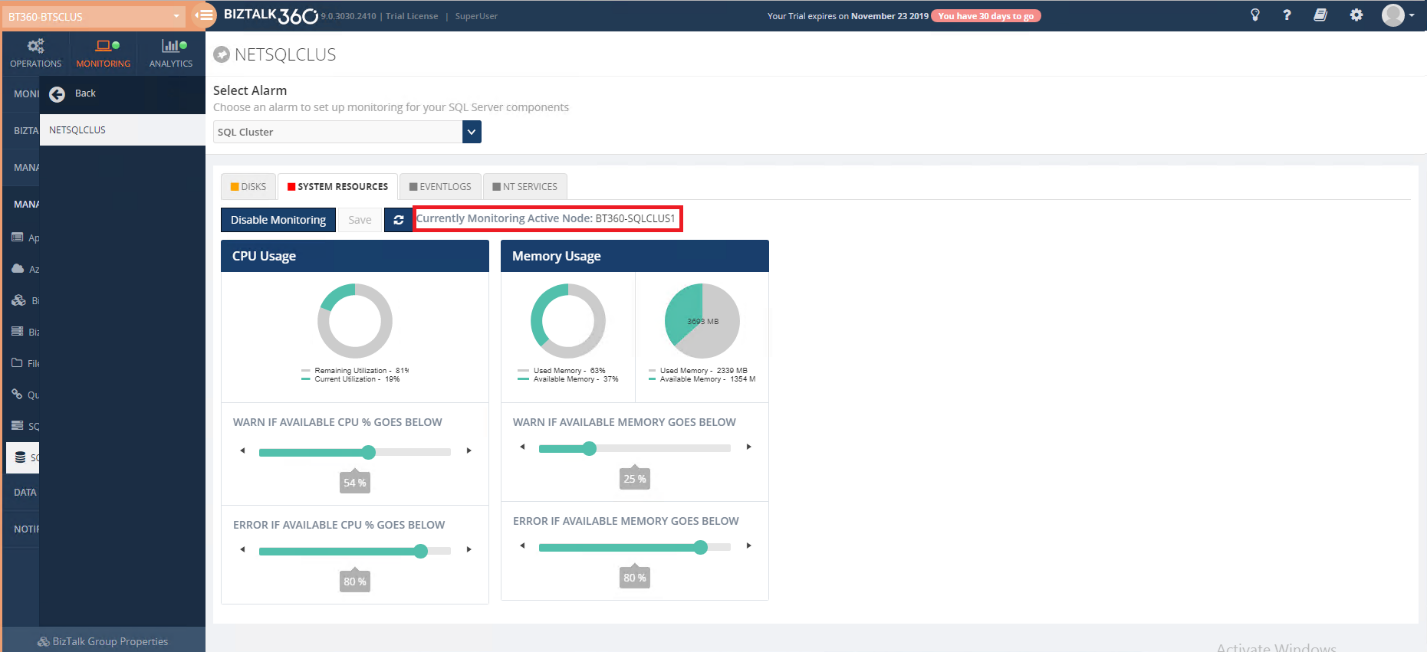
System Resource Monitoring
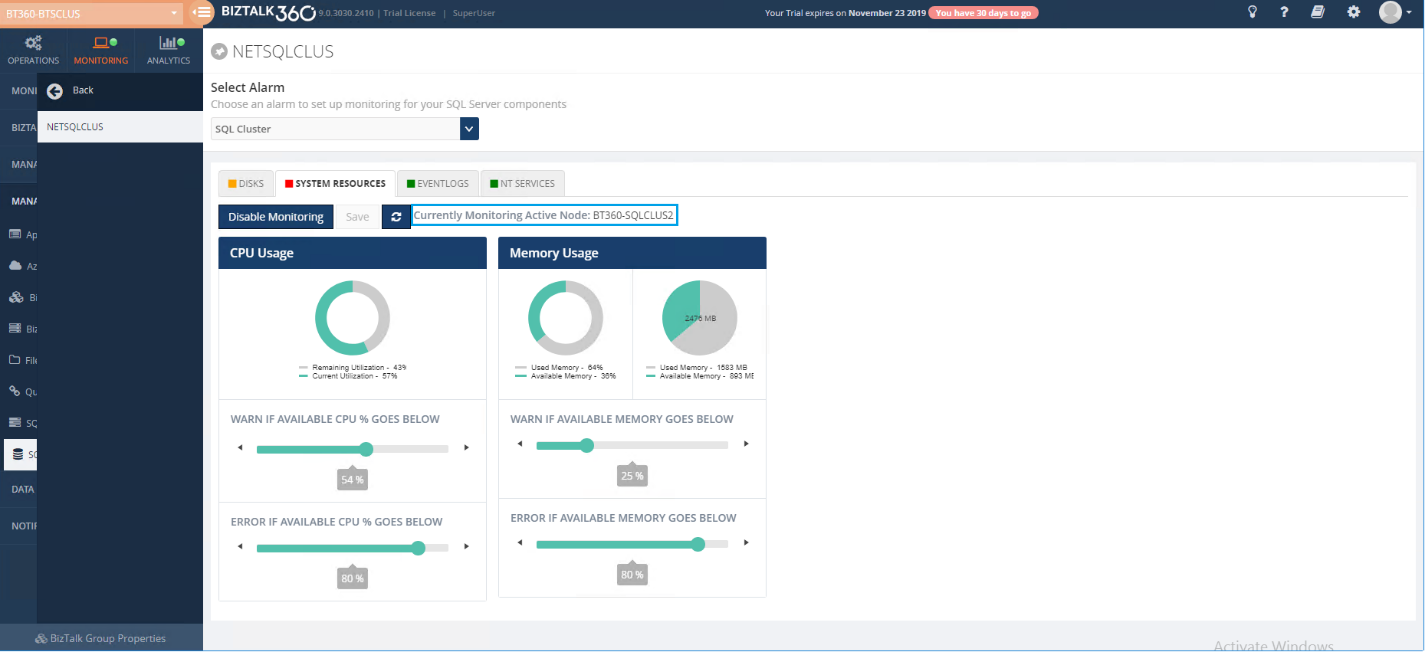
As the same as disk monitoring, you can set up appropriate warning and error thresholds for CPU and memory as per your business needs. For a Clustered SQL Server, it will show the current active monitoring Node. It will automatically pick up the CPU usage and the memory for the currently active node.
In the case of a Failover, the CPU and the memory will automatically get updated for the active node (failover node) with the existing warning and error conditions.
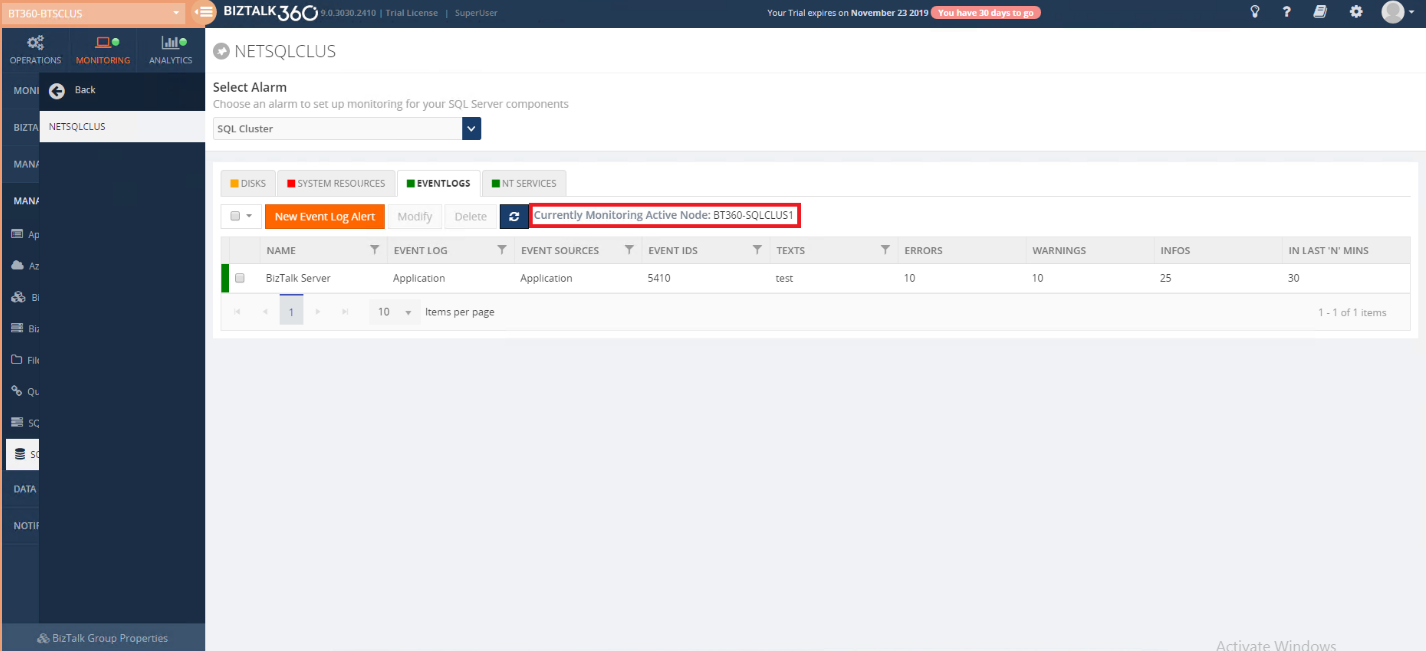
Event Log Monitoring
In a Clustered SQL Server, BizTalk360 monitors the Event Log based on the active node. You can have multiple combinations of event log monitoring, for example, certain sources, certain event ids, certain text in the message, with configured threshold conditions.
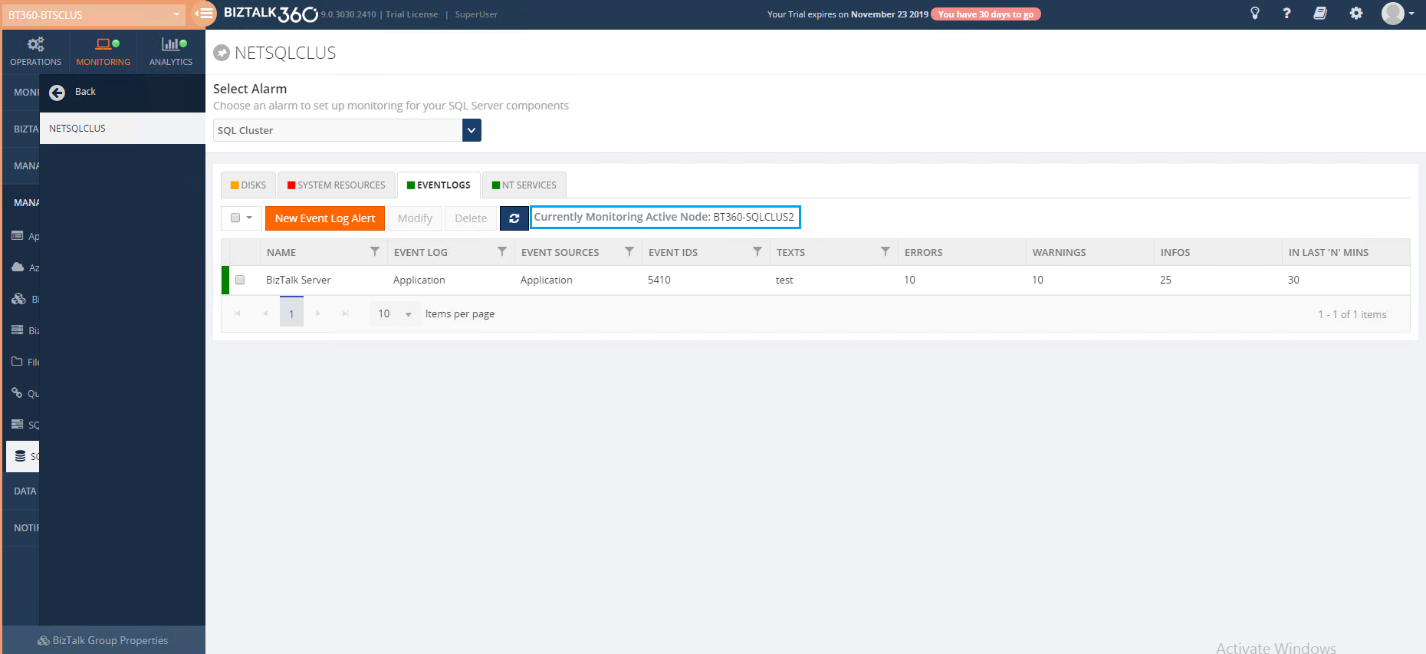
Once after Failover, then BizTalk360 automatically starts monitoring the existing event log conditions based on the currently active node (Failover node).
NT Service Monitoring
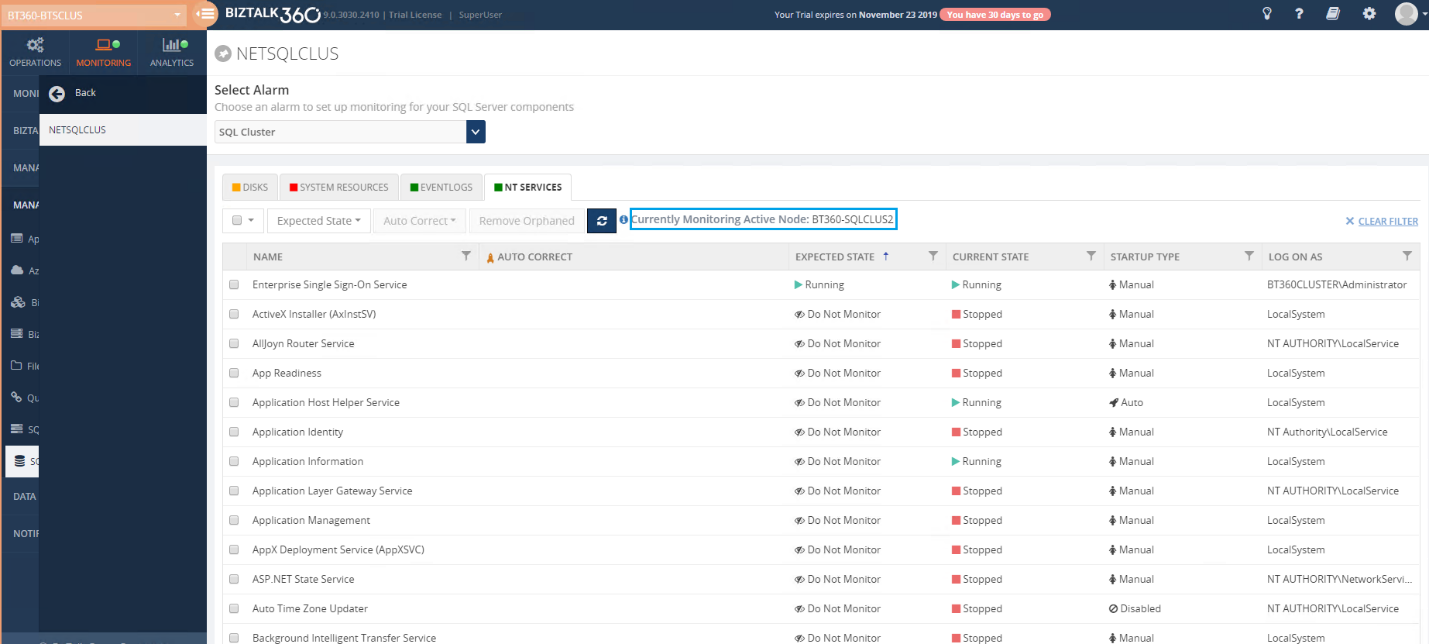
In a Clustered SQL Server, current monitoring will be based on the active server. It will pick up the NT services from the active server for monitoring as you can below.
Once after Failover, the configured NT service will automatically switch to the failover node and start monitoring.
Conclusion
Our objective with the monitoring aspect of BizTalk360 is to make it simple to configure, manage and use it on a day to day basis. The above SQL Server Monitoring will do that, and it will also do the automatic way of monitoring when a failover happens. There is plenty to consider when planning on clustering SQL Server, but we trust that we came up with the best solution. For any suggestion or feedback, post it in the feedback portal.
The post SQL Server Monitoring in BizTalk360 appeared first on BizTalk360.
by Sowmiya Subramanian | Jul 11, 2019 | BizTalk Community Blogs via Syndication
Monitor Host Instances in Clustered/High availability environment
A BizTalk Server Host is a logical container that contains the BizTalk Server runtime processes in which you deploy items such as adapter handlers, receive locations (including pipelines), and orchestrations. The host instance is the runtime process where the message processing, receiving, and transmitting occurs. Obviously, it is very important to ensure your host instances are running in your BizTalk environment. BizTalk360 already made it easy for its customers by introducing the Host Instance Monitoring functionality. In BizTalk360, you can monitor the BizTalk host instances by setting the Expected State. If the expected state doesn’t match with the current state of the host instance, you will get notified.
Out of the box, BizTalk360 allows users to monitor the Clustered Host Instances using the “AtLeastOneActive” state.
If this state is assigned as the Expected State, then the monitoring service will verify that across all the instances for the respective clustered host, at least one host instance is active, guaranteeing that the server is running, and no downtime happened for that host/server. To know more about Clustered Host Instance monitoring, follow this blog link.
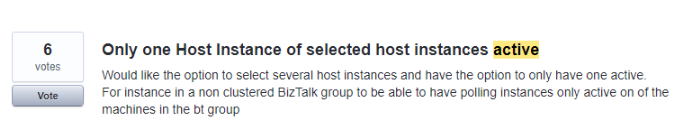
In the upcoming BizTalk360 version 9.0 Phase 2, we have extended this core functionality to monitor the host instances for high availability environment, as per the customer feedback and voting as below.
BizTalk Server High availability
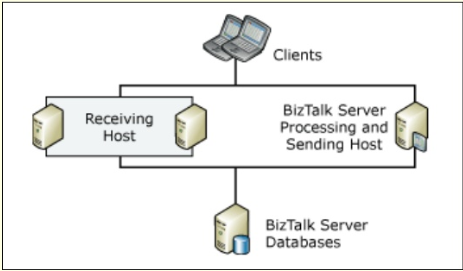
The following figure shows a BizTalk Server deployment that provides high availability for the receiving host by having two host instances on different computers. Note, that in this figure the processing and sending host is not highly available, because there is only one host instance processing the BizTalk items assigned to the host.
How BizTalk360 helps to monitor the Host Instances in clustered/High availability Environments?
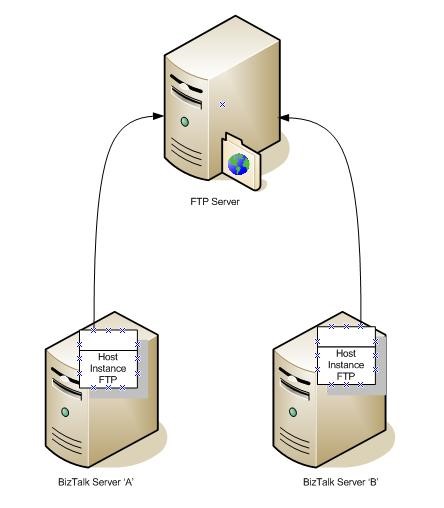
In a business scenario, if you have two BizTalk servers and they both have a Host Instance on them called “FTP”, both Host Instances will trigger a connection to this FTP server. If a file exists on the FTP server that matches your Receive Location’s file mask, both of these host instances will attempt to retrieve a copy of this file, as shown below.
To avoid processing duplicate messages from the high availability, organizations may use the Windows Clustering. This will guarantee that only one host instance is running at a time.
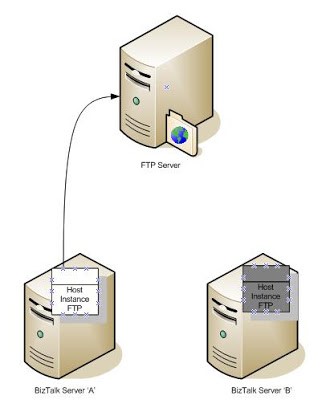
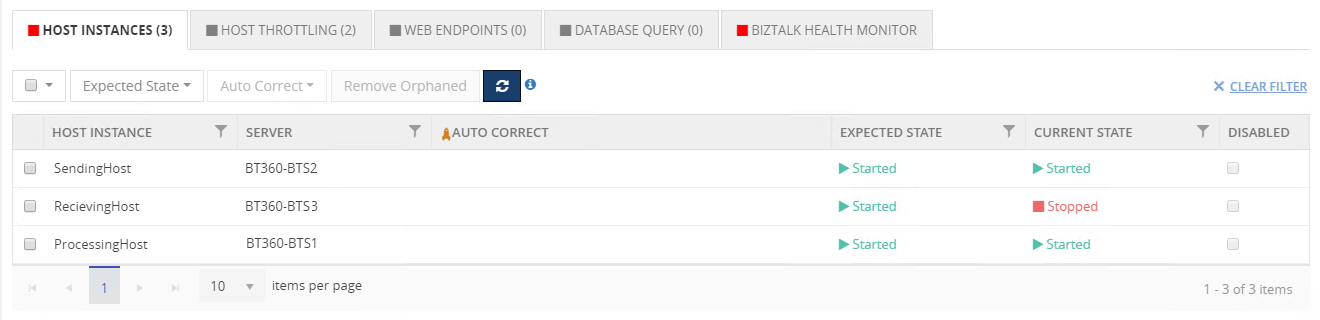
In the above cases, any one of the BizTalk servers needs to be in the active state to receive the file, if both the server is down, then the file will not get received. With BizTalk360, a user can monitor both the host instances in different servers, by setting up the “AtleastOneActive” State as shown below.

In High Availability environments, users can have all the host instances to be Active. For example, if you have 3 BizTalk Host Instances, in multiple BizTalk servers, used for different purposes like receiving, processing and sending the files.
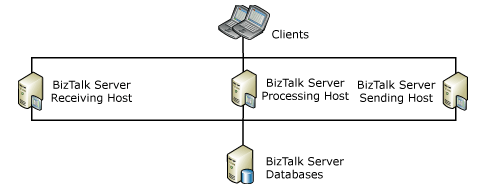
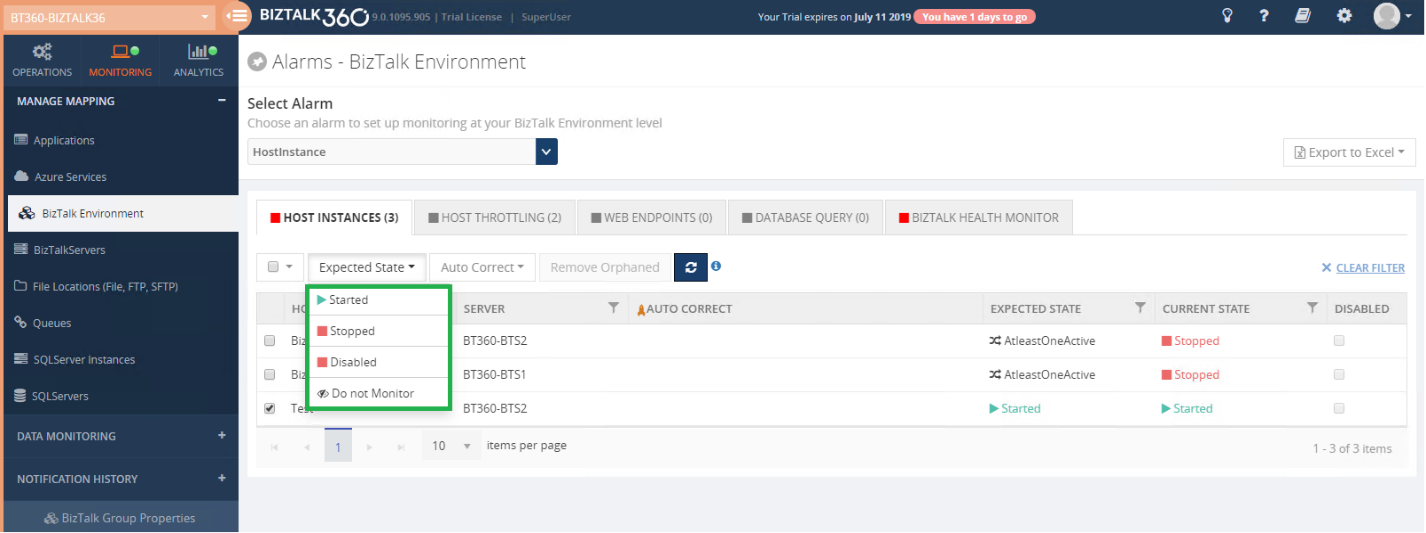
You can set up monitoring for the above scenario in BizTalk360, by setting the expected state to Started for all the three Host Instances as you can see below. When any of the host instances goes down, you will be notified.
Setting up the “AtleastOneActive” state for Host Instances
The “AtleastOneActive” state is mainly used to monitor the Active/Passive clustered and Non-clustered host instance monitoring. The user can set the “AtleastOneActive” state only for clustered host instances and non-clustered host instances in high availability environment.
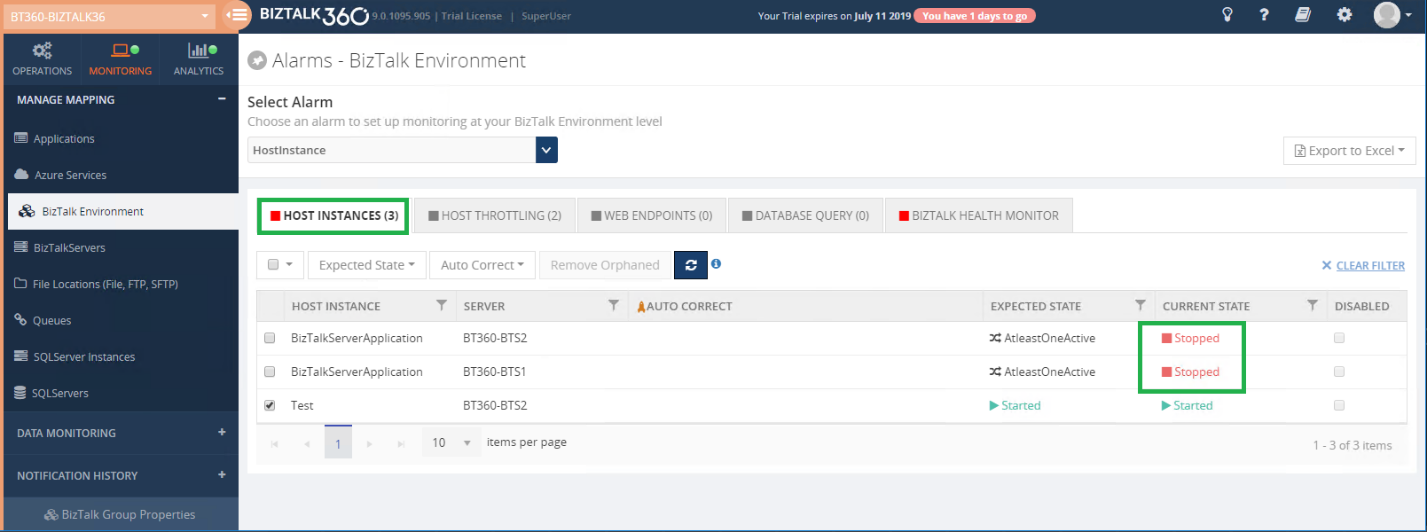
Setting the “AtleastOneActive” state will monitor across all the configured host instances of the same host and check if any one of the host instances is active. If so, the monitoring state will be healthy.
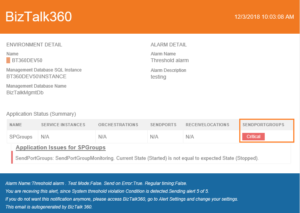
If all the configured host instances are down or stopped state, then the host instance monitoring will turn to Critical state.
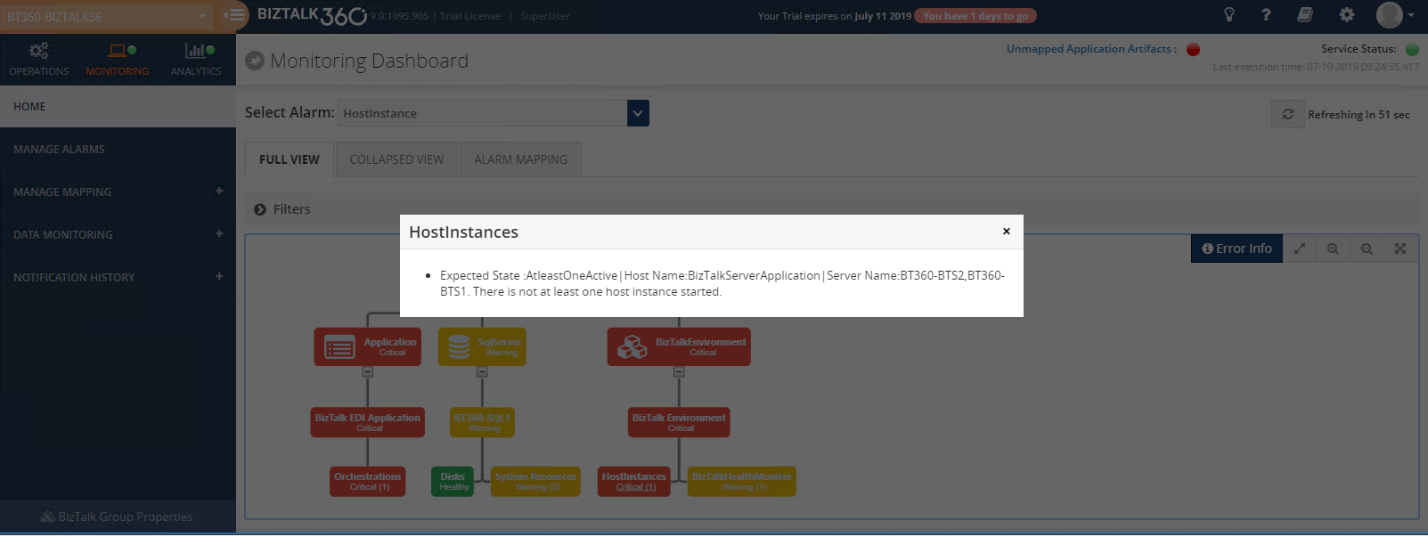
The monitoring status of the host instances will get reflected in the BizTalk360 Monitoring dashboard and the same will be notified in detail in the alert email.
How does AutoCorrect functionality work for the AtleastOneActive state of the host Instance monitoring?
Do you feel frustrated to manually start host instances, when all the host instances become down in clustered/High availability environment?.
BizTalk360 comes up with another solution with its Auto Healing capability.
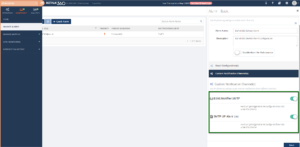
For Example, if you have 2 BizTalk host instances running under Clustered/high availability setup, from 2 host instances any one instance needs to be in the active state for performing file transactions. If both the host instances are down, then you need to start the host instances manually. This requires continuous monitoring, which can be handled by BizTalk360 itself, by configuring the AutoCorrect functionality to the clustered or non-clustered host instances.
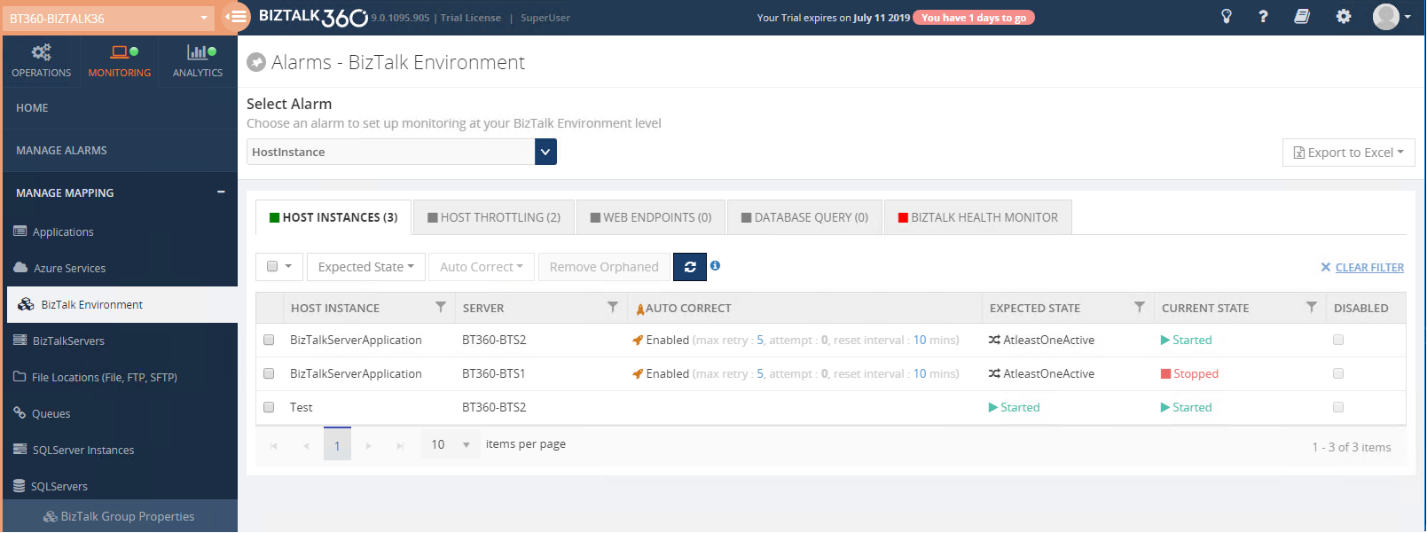
In the above screenshot, the auto-correct functionality is enabled for 2 host instances in different BizTalk servers BTS1 and BTS2. If both the host instances are down, from next monitoring cycle BizTalk360 will try to auto-heal any one of the host instances from these servers. On the first attempt, it will try to start the host instance in BTS1 server. If the instance is started successfully then it skips auto-healing the next server BTS2. In case BizTalk360 fails to start the instance in BTS1, then it tries to start the host instance on the server BTS2. BizTalk360 will try to start any one of the host instances until it reaches the maximum attempt count. You can also reset the auto-correct by setting the reset interval. To know more about the auto-correct feature click here.
Conclusion
Monitoring the Host Instances in Clustered and High availability environment is a must for a healthy BizTalk environment. BizTalk360 monitors those host instances in an easy and simple manner. It also manages the host instances and ensures they are up and running, by using the auto-correct functionality. The upcoming version of BizTalk360 will ease your way of monitoring the host instances in clustered and high availability setup.
The post Monitor the Host Instances in Clustered/High availability environment appeared first on BizTalk360.
by Sowmiya Subramanian | Apr 9, 2019 | BizTalk Community Blogs via Syndication
Monitoring and Alert notification is amongst the core functionalities in BizTalk360. To empower better usability, we are improving the alert notification in the upcoming release v9.0 by adding the option for sending alert notifications to a group of Email Id’s. We always give importance to our customer voice and give importance to customer feedbacks while picking up the features for every release. Also this feature becomes implemented based on our customers feedback.
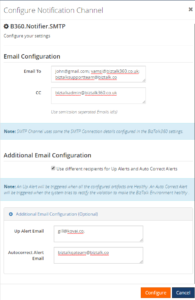
This feature not only addresses the Group Email list, it also has the additional capability to add recipients based on UP Alert and Auto Correct Alert, and an option to copy in people (CC) in notification emails. Those functionalities are also highly recommended by customer feedback as below.
We have achieved the above feedbacks in one powerful feature called “SMTP Notification Channel”.
What is SMTP Notification channel in BizTalk360?
Intending to send email notifications, you simply need to specify the recipients Email address. You can add multiple Email id(s) separated by semicolon. The SMTP Notification channel emails are sent using the SMTP Client server.
The following table provides descriptions of the configuration fields and indicates whether they are required. The section that follows this table provides example configurations.
| Field |
IsRequired? |
Description |
| Email To |
Required |
Email address of the notification recipients for all type of alert |
| CC |
Optional |
Email address of the notification recipients |
| Up Alert |
Optional |
Email address of the notification recipients for Up alert |
| Auto Correct Alert |
Optional |
Email address of the notification recipients for Auto Correct alert |
The user can create multiple email distribution lists by configuring multiple SMTP notification channels and map them to the same or different Alarms based on the business needs.
Note: To receive alerts through the SMTP notification channel, the user needs to configure the SMTP settings in BizTalk360 (BizTalk360-> Settings-> Monitoring and Notification-> SMTP). The SMTP Notification channel will take the server connection details form the configured SMTP settings.
BizTalk360 Alarm Configuration Methods
As you know in BizTalk360, you can configure the alarm notifications in two ways, one is by configuring Alarm only with email ids and the other one is mapping Notification channels (ServiceNow, Slack, PowerShell, Webhook, Microsoft Teams).
Now, in the notification channel we have added an additional advantage for Email configuration, called the SMTP Notification channel. This will behave the same as the native Email configuration methods, which is actually very easy to use and maintain.
BizTalk360 native Email Configuration
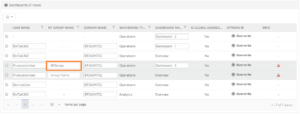
In earlier versions of BizTalk360, a user could configure the Alarm by directly proving the Email id(s), as shown below.
If the user wants to use the same recipients in another alarm, the user needs to copy the email and paste it to the new alarm or they need to type it again manually. It is a very time consuming and tedious process when you want to configure multiple email ids.
Also, in the earlier BizTalk360 versions, there is no option to group the alerts like UP Alert, AutoCorrect Alert and to have a CC for the admin or any other recipients. To overcome all, we have introduced the “SMTP Notification Channel”.
Cons of using the native Email configuration
- It’s hard to configure multiple recipients for multiple alarms
- Any user can change the recipients for any alarms, which is a security risk
- All the alert like up alerts, down alert, autocorrect will be sent to all the configured Emails
- No CC option was available
Grouping Email using SMTP Notification Channel
Using this SMTP Notification channel, a professional can effortlessly create multiple email contact groups and effectively send or automate sending BizTalk360 alerts to thousands of recipients in multiple email groups at the same time. In Addition to that, they can group the email recipients based on the type of alerts like Up Alert and Auto Correct Alert.
Pros of using the SMTP Notification channel
- It is an easy and effective way to create and manage multiple mailing lists
- User can group the email recipients accordingly to their business needs, based on the alerts like UP alert and Auto correct Alert
- It helps to add the CC to the alerts, which helps to notify an admin or other professional as per their business norms
- Any user can use the Configured SMTP channel for their respective alarms
- Only the admin or Super user can create the SMTP Notification channel. Another user cannot create the Channel which improves the security
How can we effectively use the SMTP Notification for our business
Creating an Email Distribution List with the SMTP Notification Channel: Most of the customers use BizTalk360 for the monitoring capability. The user can monitor BizTalk artifacts through the BizTalk360 alarms and the user gets notified when any artifact goes down. The user can configure n number of alarms for their business needs.
For instance, if a user was monitoring multiple BizTalk artifacts with more than 100 BizTalk360 Alarms with the same set of recipients, and if the admin wants to add/remove a recipient, then the admin needs to go and manually change all the alarms which is time consuming. This can be done much simpler with using the STMP channel; it is enough to provide email recipients only at SMTP notification channel configuration. The same can be used across all the alarms, just by enabling the SMTP channel. And, if there is any change in recipient ids, it’s enough to change it in SMTP notification channel and it will be reflected in all the alarms. The user can also configure multiple SMTP channels to multiple alarms or a single alarm as below, this will reduce the manual effort.
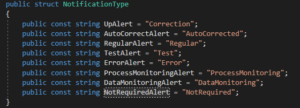
Personalize Alerts to notify different group of users: As you know, users get notified through different types of Biztalk360 alerts such as Down alert, UP Alert, AutoCorrect Alert, Regular Alert and Data Monitoring Alert. The Down Alert will be triggered when the correct state of the artifact is different from the Expected state; the UP Alert will get triggered when all the configured artifacts are in Healthy state; the AutoCorrect Alert will be triggered when system tries to rectify the violation to make BizTalk Environment healthy.
In case an admin wants a down alert to be sent to everyone in the team, but the Up Alert or Auto correct alert need to be notified to only specific members in team, that can be easily achieved by configuring the selected recipient ids Up Alert/Auto correct field while configuring SMTP channel.
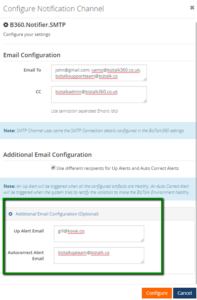
Create the SMTP Channel with the Email To, which indicates the Down Alert recipients, then configure the UP Alert and Down Alert recipients on the respective fields. Then configure the channel to the respective Threshold Alarm. When the artifacts are down, it will trigger the alert only to the configured recipients and the same for UP Alert and AutoCorrect Alert.
Make a copy to different users: Within an organization, a user needs to provide a copy of an alert to the admin or some other authority. In this case, they can configure the CC in the SMTP Channel, then the alert will get notified to the admin.
Customizing SMTP Notification Channel: The SMTP Notification channel can be customized based on the business requirements using the GitHub project file. For Instance, if the user wants to send the Data Monitoring alerts to a specific Email group, this can be achieved by adding a piece of code in the GitHub project file. For SMTP Notification channel, the data are retrieved based on the alert notification type.
You need to perform the following steps:
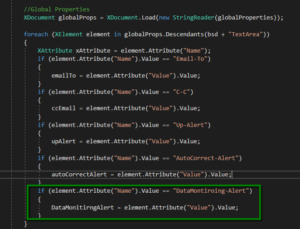
- Add the fields to get input for Data monitoring Alert Emails in the global properties XML File.
<TextArea Name=”DataMonitoring-Alert” DisplayName=”Datamonitoring Alert Email” IsMandatory=”false” Tooltip=”Only Data Monitoring alerts will be trggerred to the configured Email Id(s)” DefaultValue=”” Value=”” Type=”email” ValidationPattern=”^([w+-.%]+@[w-.]+.[A-Za-z]{2,}(s*;?s*)*)+$”/>
- Get the email id’s and assign to another variable in the SMTPChannel.cs file as
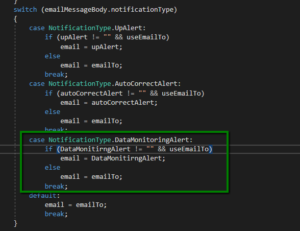
- You need to add the Condition respective for Data Monitoring Alert as
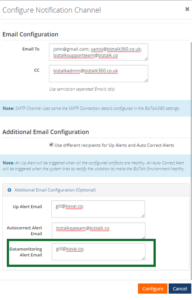
Then the user can add separate group Emails for Data Monitoring alert as below.
 Wrap Up
A mailing list or group email can be the bliss of a feature for businesses of any size. The SMTP Notification channel allows you to reach out to as many people as you want without having to re-write or copy-paste the same email multiple times.
Stay tuned!!
Conclusion
If you plan on creating and send group emails for an organization or a business purpose, then this SMTP Notification channel will ensure a productive, scalable and goal-driven approach to your group email campaigns.
The post Group Email using SMTP Notification Channel in BizTalk360 appeared first on BizTalk360.
by Sowmiya Subramanian | Feb 6, 2019 | BizTalk Community Blogs via Syndication
BizTalk360 v8.9.5 has been released for the public with lots of exciting new features. Many of our customers have already ugraded to the latest version and started experiencing the new features. As you know, BizTalk360 will always listen to customer ideas and implement them for the product development as like
“Software quality begins with the quality of the requirements.”
We gather those requirements through the BizTalk360 feedback portal and make sure to address customers ideas and suggestions. Based on the number of votes. we came up with new features and enhancements, with intuitive design, in our latest version, as follows:
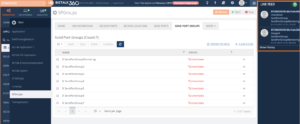
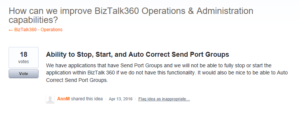
- Action on Send Port Groups
- Alarm Reset Capability
- Autocorrect Reset Capability
Above three features are the most awaited features by the customers. This will increase usability and will ease the process to maintain and monitor the BizTalk artifacts. Here we go!
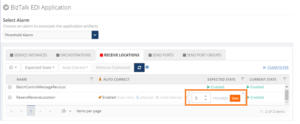
Action on Send Port Groups
One of the major functionalities we are bringing is the ability to action on Send Port Groups. After getting several customer feedbacks, we are bringing this new feature in our latest release, which will ease the operation and monitoring capabilities.
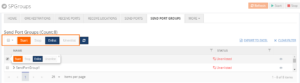
A Send Port Group is a collection of Send Ports that BizTalk Server can use to send the same message to multiple destinations in one configuration. In earlier versions, user can search and view the Send Port Groups, however there was a gap in performing actions in BizTalk360. In this new version, we have added operational capabilities such as Start, Stop, Enlist and Unenlist for Send Port Groups as in line with BizTalk server.
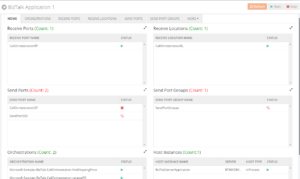
As there is a famous saying “Intuitive design is how we give the user new superpowers”, we have improved the Application Home Page UI. From now on, you can view all the available Send Ports, Receive Ports, Receive Locations, Orchestrations, Send Port Group and the associated Host Instances in the home tab for easy access.
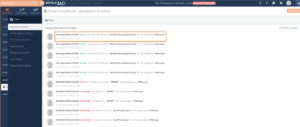
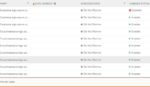
The BizTalk user can also audit the Send Port Groups activities in the Governance and Auditing sections. Once the user performs an action on Send Port Groups, it gets tracked on Application activities and User Activities with details as below.
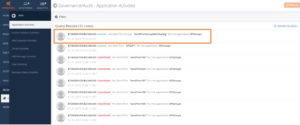
The actions you perform on Send Port Groups are getting tracked and you can audit that on live through “Live Feed” as shown below.
As you already know, Monitoring is one of the core functionalities of BizTalk360. With this functionality, you can monitor all the BizTalk artifacts and when the artifacts go down, you can perform actions through the auto-healing functionality, except, until earlier versions of BizTalk360, for the Send Port Groups. Now, the Monitoring capability has also been provided for the Send Port Groups.
Note: To know the detailed information of Send Port Groups monitoring click here.
Alarm Reset Capability
Prior to v8.9.5, the alarm will get reset in two scenarios as follows.
- Manually select the respective alarm and Reset the Notification Counter
- Notification Counter will be reset once all the mapped artifact status are in the healthy state
As per the feedback from several customers (as below), we have included Auto Reset ability in our latest release.
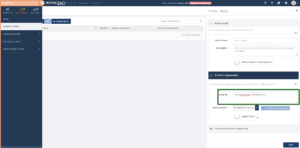
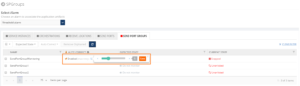
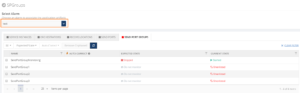
Alert Reset limit can be set in Alarm configuration section as shown in the below screenshot.
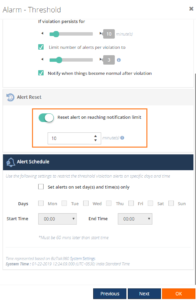
Once the notification limit has been reached, the alarm will auto reset the counter after the configured X minutes.
Autocorrect Reset Capability
Prior to v8.9.5, as same as with an alarm, the Auto Correct configuration will get reset in two scenarios. The Auto Correct will get reset, once after the auto healing is successful:
- Auto Correct ‘Max Retry’ counter will be reset after the successful auto healing of the mapped artifacts
- Associated Auto Correct mappings will be reset after the alarm reset
But we don’t have the capability, to reset the Auto Correct automatically. As per the feedback from several customers, we have implemented Auto Correct Reset functionality in the latest version.
Now, With Auto Correct parameters “Max Retry” and “attempt”, an additional parameter has been added, which is “Reset Interval”. The user can configure the time interval to do automatic Auto Reset. This configuration will reduce the manual intervention every time when the ‘Max Retry’ counter reaches it limit.
Conclusion
We hope that the above features will increase the usability and reduce the manual work to reset. Are you tired of constantly having to monitor your BizTalk environment in a manual fashion? Give BizTalk360 a try and take benefits of newly added features. A trial version of BizTalk360 can be requested here.
by Sowmiya Subramanian | Dec 6, 2018 | BizTalk Community Blogs via Syndication
We are super excited to welcome our new release version of BizTalk360, v8.9.5. Here is a blog which explains the new feature introduction of Send Port Groups Monitoring in BizTalk360 v8.9.5.
One of the most powerful and overlooked features in BizTalk Server is Send Port Groups, helps to route a single message to more than one destination. A Send Port Group is a collection of send ports that BizTalk Server can use to send the same message to multiple destinations in one configuration. Now, you can monitor Send Port Groups in BizTalk360.
Customer Feedback
As you already know, Monitoring is the core functionality of BizTalk360. With this functionality, you can monitor all the BizTalk artefacts except the Send Port Groups in the earlier versions of BizTalk360.
In BizTalk360, we aim at improving the product and adding new features based on customer feedback and business scenarios. The Feedback portal is one such platform for the customers to provide their suggestions, which can be voted upon by other customers if they feel that these ideas fit in their business requirements as well. It’s based on the priority of voting; the features and enhancements get picked up for development. One such feedback was Send Port Groups monitoring on BizTalk applications.
Hence, we have chosen Send Port Groups monitoring for one of the features in this release.
Send Port Groups Monitoring in BizTalk360
Send Port Groups is a “key” feature of BizTalk Server’s “Publish and Subscribe” architecture, where a publisher can have more than one subscriber.
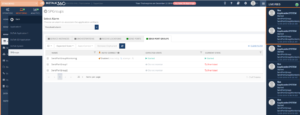
User Scenario: Let’s say you need to map an inbound XML document to three different outbound formats and send each outbound document to a different system. All that’s required is a Send Port Group and a simple Filter Expression. The Send Port Group handles the Filter Expression with each Send Port using its own map! If any of the three transmissions fail, you can resubmit the failed message without resending the other two documents. The user may have one or more Send Port Groups. It can be hard to monitor your Send Port Groups manually. Now with the support of BizTalk360, you can monitor the Send Port Groups easily! In BizTalk360, we have included the Send Port Groups for monitoring for each BizTalk Application. The user can monitor the Send Port Groups by mapping with the alarm as below.
The Send Port Group can go down for some situation; you can monitor the artifact in such situation by configuring the expected state in BizTalk360. When the current state is not equal to expected state, the user will get notified through an alert, as shown below.
The same error and status will be displayed in the Monitoring dashboard and in the Errors and warning section as seen below.
Auto Healing functionality for the Send Port Groups
By any chance, when the Send Port Group artefact goes down for some specific reason, you need not to log in to the BizTalk server to make it up again. BizTalk360 Auto Correct feature will get it back to the expected state automatically with the Auto correct option. For this, the user needs to enable Auto Correct for the configured Send Port Groups.

If in case the system is not able to Auto Correct Send Port Groups to its expected state i.e., when all the attempts to auto correct have failed, then the user will receive a down alert. For each attempt, the user will get notified with the detailed status information of auto correction operation that has happened on a Send Port Group. With this information, the user can get a clear picture of what is happening with the state of the Send Port Group.
User Scenario: In BizTalk, the user cannot Start or Stop the Send Port Group from “unenlisted’ state when all the associated Send Ports are in “Unenlisted” state.In such scenario, there is a chance that the auto-healing may get failed to heal the Send Port Group from the “unenlisted” state to expected state and the auto correct attempts will get failed since the associated Send Ports gets “Started” or “Stopped” state.
Once all the maximum attempts failed, then the user will get intimated through down alert as “Maximum auto corrects attempts have been exhausted”.
Intelligent auditing
BizTalk360 has very good intelligent auditing capabilities that will help administrators to find out “Who did what in the environment”. When the auto-healing is successful, it gets tracked at the Send Port Group level under “Application Activities” in Governance and Auditing section.
Live Activity Recorder
BizTalk360 has excellent Live activity tracking feature which helps you to govern user actions efficiently without compromising on regular activities. You can view the Live recording of all the user activities through the “Live Feed” on each successful auto healing of Send Port Groups.
This feature will be available in our upcoming release of BizTalk360 v8.9.5. Stay tuned to monitor and maintain the Send Port Groups easily through auto healing functionality.
by Sowmiya Subramanian | Sep 11, 2018 | BizTalk Community Blogs via Syndication
This is a sequel blog to my post about the Export/Import Configuration feature. Along with BizTalk Reports and Knowledge Base, we also brought import/export capabilities for Dashboards and Custom Widgets.
A BizTalk administrator needs to perform many tasks every day. When the time comes to analyse or visualize BizTalk data, it can be difficult to break it down and discover exactly what you need to know. By building a BizTalk360 dashboard, the administrator can get a better look at exactly the information of a specific environment. BizTalk admins can create such insightful dashboard for four different sections in BizTalk360:
- Operations
- Analytics
- EDI
- ESB
The Dashboard options are great and they help to monitor and troubleshoot your environments proactively. However, the downside is that, it can take some time to craft the different dashboards you want and subject matter expertise to display the relevant metrics needed to troubleshoot a specific issue. The Dashboard Import/Export feature allows you to export your fine-tuned, purpose-built Dashboard screens, and import the ones that have been shared with you.
Exporting Dashboards
BizTalk360 admins can export all the available dashboards under each environment in BizTalk360. Using this capability, users can import all the configured dashboards or any specific ones.
Scenario 1: For their business needs, BizTalk administrators can manage multiple environments. If the admin wants to migrate the Dashboard configuration from one environment to another, the Admin can export the configuration in one environment and import it into another one. Even the globally created dashboards can be imported and exported.
Importing Dashboards
The BizTalk admins can import the exported Dashboard configurations from another environment. The admin can create new dashboards and can also overwrite existing dashboards in the target environment.
Having said already, the Dashboards are user specific. This means that users, for which dashboards will be exported and imported between environments, need to exist in the target environment. So, while importing dashboards from one environment to another, make sure the user is existing in the User Access Policy screen. If, by any chance, that specific user does not have a profile in the destination environment, it can be created by using the User Access Policy import capability.
If the user does not have the access for the particular environment in the User Access Policy screen, then the admin cannot import the dashboard for the specific user. Hence, the user must be available in the destination environment.
In case, the user may exist in a Windows NT Group, then the admin can import the dashboard by providing the NT Group name.
The result of the imported Dashboards is shown in a nicely formatted grid view, with an explanation of what happened with each Dashboard during the import process.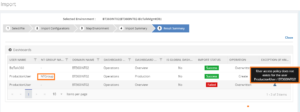
Exporting Custom Widgets
The import and export custom widgets implementation is mainly to handle the custom widgets in dashboards. Because, when a dashboard contains any custom widgets, then it will not get exported along with the dashboard functionality. The user can export the needed custom widgets along with the dashboard from one environment to another environment.
Note: The widgets are not environment specific. All the available widgets will be accessible for all the environments.
Importing Custom Widgets
Importing custom widgets is done by uploading an export file. Using the import functionality, the widget can be imported into other environment or used to restore widgets to the same environment. The Import process takes into consideration, if the widget already exists in the destination environment (widgets are not duplicated). If so, it will be overwritten.
In case the user still wants to import that widget into the destination environment, the user can edit the original name of the widget, thereby making sure that the widget will become created in the destination environment.
The results of an import are shown in a nicely formatted grid view with an explanation of what happened with each widget during the import process.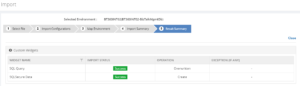
Scenario 2: While Exporting and importing a dashboard into another environment, the dashboard can contain custom widgets for any kind of data visualization or analysis. Those custom widgets won’t be imported with the Dashboard because, in BizTalk360, the custom widgets are handled separately. In such case, the user can Export the Dashboard along with the custom widgets and import then in the required environment. This will reduce the time on manual creation of each custom widget.
Conclusion
The Import/Export functionality in BizTalk360, tremendously reduces the time of migrating the data configuration form one environment to another. For the business user, it helps to create dashboards in multiple environments and the user can create the dashboards into collaborative group easily.
by Sowmiya Subramanian | Sep 4, 2018 | BizTalk Community Blogs via Syndication
Introduction
Here is another exciting capability we have added to our existing import and export capability. Curious to know? In this blog post, I would like to highlight what are all the new enhancements in Import/Export Configurations we made for our upcoming version V8.9. These enhancements would ease the BizTalk administrator’s day to day operations, particularly migrating data from one environment to another.
All the newly created BizTalk Server applications are being tested first in the preproduction or UAT and shadow environments to avoid business consequences. Likewise, customers would prefer to test all the functionalities of the BizTalk360 in their non-production environments. Further, they populate necessary data to operate, monitor and find analytical information of their environment.
Admins don’t need to recreate the data again in their production environment as in such scenarios, our import and export capability plays a major role. Already we have support to export and import,
- Alarms
- User Access Policies
- Saved Queries
- Secure SQL queries
New Capabilities
In the version 8.9, we added support for import and export of the following sections:
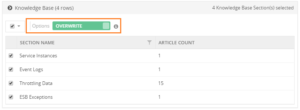
- Knowledge Base
- Service Instances
- ESB Exceptions
- Event Logs
- Throttling Data
- BizTalk Reports
- Dashboards
- Operation (Default & Custom Dashboards)
- Analytics (Default & Custom Dashboards)
- EDI Dashboards
- ESB Dashboards
- Custom Widgets
Using this rich capability, one can easily export and import the configuration between environments, thereby reducing the migration effort. This is especially useful in scenarios, where the user tries to carry out testing in a test environment, and upon achieving the desired result, they can import the configuration from the production environment.
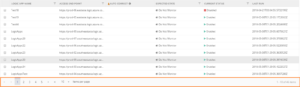
What has enhanced in Import/Export Grid Pagination
Previously, BizTalk 360 has a static pagination which is available for the grid by default. In Import/Export, the user can customize the pagination using the “Max Matches” on System Settings sections in BizTalk360. Pagination will be visible for the Import/Export grid once the row count exceeds the max match size.
For Instance: If the Max Matches size is set to 10 means, then the pagination for each grid in import/export will be visible when the row count exceeds 10.
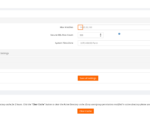
Exporting configurations
Exporting your data is a great way to make the information more digestible or find patterns that can give your team better insight between different environments. The user can make use of export functionality in two ways:
- To migrate configuration data between different Environment
- To archive the configurations in the local system
Exporting the Knowledge Base
The BizTalk360 knowledge base is useful to document the BizTalk issues which administrators encounter on a day-to-day basis. To migrate the BizTalk360 knowledge base it is possible to use the Export functionality.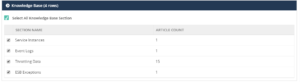
The user can export the articles based on the sections Service instances, Event Log, Throttling Data and ESB Exception. The knowledge base section is preselected, the user can deselect and reselect the knowledge base according to their needs. Once the selection has been made, the user can Export the knowledge base articles.
Exporting BizTalk Reports
The BizTalk Reports help organizations to visualize/monitor their business data. Using the Export functionality, the user can archive or export the BizTalk Reports.
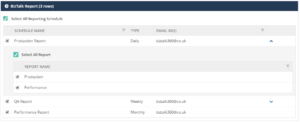
The BizTalk Reports and their associated schedules are preselected. The user can view the associated reports by clicking the arrow on each schedule and they can edit the selection according to their needs.
Importing Configuration
The Import functionality is mainly useful for importing large amounts of data quickly. By importing the configuration, you can replicate the required configuration on the target machine. To import the configurations from a certain environment, you should have already saved and exported those configurations in a Zip file. Import can be used in two ways in BizTalk360
- To create a new configuration from the source environment to the destination environment
- To update the existing configuration on the destination environment
Importing Knowledge Base
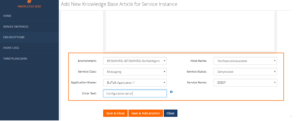
In BizTalk360, the customer can create KB articles as and when they fix issues in the environment. Over a period of time, they can have a wealth of information ready to fix those repeated issues. Those articles can be imported to another environment using the import knowledge base feature.
For Instance: The organization has Production Environment and they are planning to build a separate QA environment for testing. After creating the new environment, it is a lot of work to manually create the knowledge base article for frequent/repeated issues. Here, the import knowledge base comes into play. The user can easily import the knowledge base articles from the Production environment to QA environment.
The existing articles can be overwritten or else can be ignored. If the article doesn’t exist, it will create a new article in the target environment.
In BizTalk360, the knowledge base articles can be created for a specific environment or globally (without selecting the environment) accessible articles. The BizTalk360 user can create or overwrite the articles.
For specific Environments: The knowledge base articles will be imported to the target environment with the configuration tags (like Host Name, Application name etc.., which is specific for each error code they encounter) for specific articles. If the article is overwritten, then the import process will overwrite the configuration tags on the existing article.
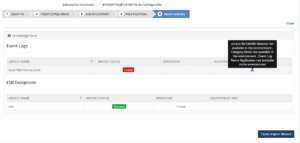
When the configuration tags are not available in the target environment, the article will not be imported and it will throw an exception on result summary.
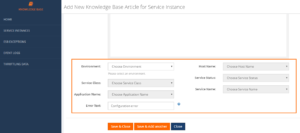
For Global articles: When the global knowledge base is imported, the environment selection will not happen. The articles are accessible to all the available environments.
Importing BizTalk Reports
In a business environment, the BizTalk reports provide a comprehensive, high-level overview of the performance of their BizTalk environment. The configuration of these reports, can be easily managed using the Import BizTalk Reports feature.
For instance: An organization has deployed BizTalk360 on one of the Development/QA/UAT environment(s) and they want to move all configurations to the Production environment. The BizTalk360 administrator must do the usual practice to set up the configurations manually in a production environment. It is not feasible to configure all the configuration manually, instead BizTalk360 allows you to easily export and import all the BizTalk Reports.
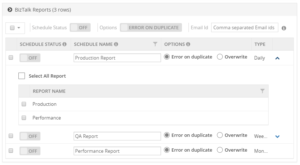
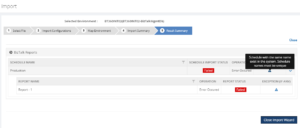
While importing the schedules and the associated reports to another environment, the user can edit the schedule name as per their requirement and the user can enable the schedule after importing by selecting the ON/OFF option available on each schedule. By default, the status of schedule during import, is disabled. The user can also change the Email ID after importing. This will help the user to create/overwrite the schedule and the reports as per their business needs.
Note: The user cannot import the reports without the selecting the associated schedule.
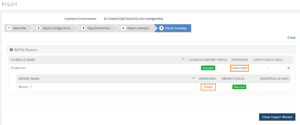
If the user sets the option to “Error or Duplicate”, the import process would not allow duplicate schedules and associated reports to be imported.
If the user sets the option to “Overwrite”, the import process will overwrite the existing schedule with the same name. In case the associated reports are not available, the import process will create the reports and associate to the schedule.
If the associated report already exists in another schedule means, it will ignore the report while importing.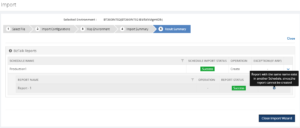
Conclusion
By adding the above feature, the Import/Export Configuration has become more versatile. This provides a great option for the administrators who find the migration process intimidating and would like expert help to assure an effortless transition between multiple environments. No matter where your configuration needs to go, BizTalk360 lets you Import/Export data with ease.
Apart from knowledge base and BizTalk reports we have included the Dashboards and Custom widgets for v8.9 release. I will cover those two functionalities on my next blog “Stay tuned!”.
by Sowmiya Subramanian | Aug 21, 2018 | BizTalk Community Blogs via Syndication
Are you using the Event Log for diagnosing problems and challenges faced while performing the operation in BizTalk server administration console? Then you might face the difficulty, on having multiple BizTalk / SQL Server users who need to look Event Logs on each server when there is a problem. To access the Event Log, every user should have administration permission to access the physical server, which is not the ideal solution for the business needs.
What is the purpose of the Event Log on a BizTalk Server?
The Event Log holds information related to different aspects of, amongst others, BizTalk Server. The Windows Event Logs are used by the BizTalk admins, mostly for diagnosing problems. When they face any issue, the first step they try to diagnose the problem or faults in the BizTalk Admin console itself. If they could not achieve a solution, then they will view the Event Viewer for detailed information on such cases like errors, messed up environments and failure of message processing.
Filter for log noise reduction during Event Log collection
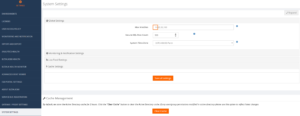
The BizTalk360 Advanced Event Viewer which collects the events that are related to BizTalk and SQL sources. These sources can be configured in Settings–>Advanced Event Viewer, as shown below.
The Event Logs are collected based on the Event Log Categories and the administrators can also add categories as per their need. The data collection can be performed based on the environment selection as below.
Once, after enabling the “Enable Advanced Event Viewer data collection”, that will display all the available BizTalk and SQL server of the specific environment. The BizTalk admins or the people using BizTalk server can select the servers based on their needs. Based on the configurations, the subservice “Eventlog Collection” of the BizTalk360 Monitoring NT service will start to collect Event Log data and store the information in the BizTalk360 database.
This approach will seamlessly solve the problems as we highlighted in this article. The BizTalk administrators no more need physical access to each BizTalk or SQL server to diagnose the issue. This approach will avoid data collision, improves the performance and makes the user interface clear.
Let’s have a look at few scenarios where using the Advanced Event Viewer is beneficial over the Windows Event Viewer.
Scenario 1: If there is any failure of file transaction at an application level, the user can view the relevant event log information in the single user interface. This will avoid context switching and reduces the time to diagnose the issue.
Diagnosing issue made easier than Windows Event Viewer
In real time business transactions using BizTalk can cause any kind of failure.
Scenario 2: When you try to run a BizTalk application after deploying an orchestration with custom components. In case, the BizTalk orchestration engine cannot locate the custom component, that means you will get below error.
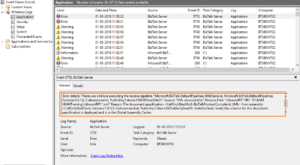
It is easy to query the Event Log details if BizTalk server is installed in a standalone environment. However, in case of multiple BizTalk servers, the user needs to login to each server to find the Event Log information and it is a tedious process to search the exact issue on ‘n’ number of results. So, it will eat up lots of time on finding the exact result.
In the BizTalk360 Advanced Event Viewer, diagnosing the problem or issue, in a single user interface related to the event “application” of BizTalk and SQL search, is made much easier than with the Windows Event Viewer.
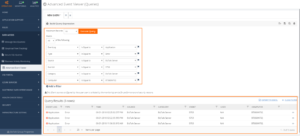
With the Advanced Event Viewer, the BizTalk admins (and other people) can search the results using rich query builder tools, based on the different parameters such as the Event Log, Type, Source, Event, Category, User, Computer, Timestamp, and Message. One or more filters can be added, which will be useful to get an exact result and the user can view the related information the same as in the Event Viewer.
This approach will fasten the search of the Event Log information from the different servers within a stipulated time which obviously saves time.
Archiving distributed events on Centralized Location
BizTalk360 help to get the needed Event Log data from the Event Logs on different servers and shows the information in a simple, intuitive user interface. However, it is practically impossible to manually keep an eye on the Event Log data throughout the day, as they are constantly updated with the latest log data.
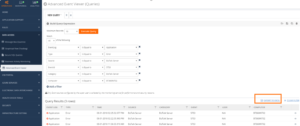
In BizTalk360, we solve this problem by downloading the data into Excel Format. The BizTalk admins can download the file by using the Export to Excel feature, that will download the grid data in Excel format and they can store the Event Log Data for further investigation, as shown below.
It is possible to monitor Event Log Data!
The Windows Event Logs hold all the important log information from sources like SQL Server, IIS, BizTalk infrastructure and run time problems. As the Windows Event Log contains that much data, it is nearly impossible to monitor the Event Log manually. Luckily, through BizTalk360, the BizTalk admins can easily monitor the BizTalk and SQL server logs by configuring the Event Log monitoring.
Scenario 3: The BizTalk admins can customize the alert in such a way that they must be notified when there has been a sequence of start/stops of the host instances in the past 30 minutes. Without being alerted, you may not know the frequent start/stops of the host instances and this could impact the performance of the environment.
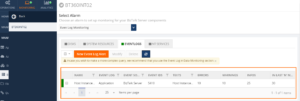
By mapping the Event Log to the Alarm, the administrator will get notified when the Event meets the condition. The alert can be notified through the required sources like Email and notification Channels.
The administrators can also log this Event Log alert in the Event Viewer itself, this is possible by enabling the Event Log option in alarm creation as below
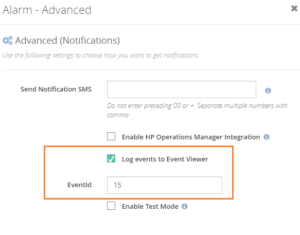
This will log the Event log alert in the Event Viewer when the alert exceeds the Host Start/Stop error/warning condition as below
Create Log rules with an intuitive interface using the Event Log Data Monitoring capability
The primary purpose of auditing Event Log for BizTalk administrator is to discover the events of interest, whether they provide general information or call for further investigation. BizTalk360 will help to get the needed log data from multiple servers and shows the information in a simple, intuitive user interface. However, it is practically impossible to manually keep up the data throughout the day, as they are constantly updated with the latest log data. BizTalk360 also solved this by giving the real-time alert features on Event Log Data Monitoring.
Scenario 4: BizTalk Administrator wants to monitor different Events from multiple servers. For example, they might want to monitor the ESB from BizTalk Server at the same time they want to ensure the performance of the SQL Server & ENTSSO events from a separate SSO server and they also need to monitor the IIS from multiple BizTalk servers. In real-time, there is no option to monitor it with a single tool. It is hard to predict any issues and it is time-consuming for BizTalk admins to constantly monitor the Windows Event Log manually.
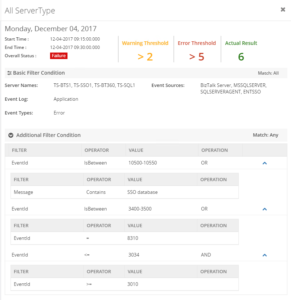
BizTalk solves this problem by bringing the heterogeneous data in the single intuitive user interface. On the top of that, it provides a powerful capability of getting real-time notifications through email or SMS when an event occurs on the specific frequency by setting additional threshold conditions. The admins can correlate two or more event calls for the further investigation by setting the conditions as shown below.
It will be useful to query against different Event Sources of multiple servers of a single BizTalk Environment. The admins can include or exclude the events that pertain to your environment. Also, the admins can get the detailed notification on Event Logs by selecting the ‘Send Event Log in notification’.
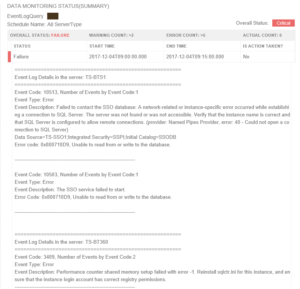
This will send the detailed information on every event source in Email which will look like below.
BizTalk Admins can choose the Notification Channel on the alarm creation and they can configure the Event Log as previously mentioned to get notified when any violation happened on a specific frequency. On the Data Monitoring Dashboard, the admins can visualize the triggered alert results based on the day view as shown below.
It also easy to maintain, once after scheduling Event Log Data Monitoring; when you disable AEV for the environment, it will stop collecting Event Log data. So, the admins can enable collecting whenever they need it.
Is there any option to manage the Event Log data?
Managing the Windows Event Log is not simple. Administrators can manage or clean up the data through PowerShell script or by creating a custom log to log application errors. The BizTalk360 Monitoring Service collects the data based on the Event Log and Source configuration and stores in a separate database table in the BizTalk360 database.
In real-time business, BizTalk server will collect the log data for each event which happens during BizTalk operation. This can hugely increase the size of the database. Luckily, the administrator can set the purging for Event Log data in the BizTalk360 database as shown below.
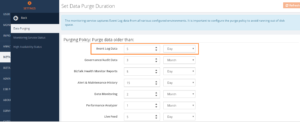
Once after configuring the Purge Policy for Event Log data, it will clean up the data for every specific days/month/hour.
This approach will save the time and clean the old data easily, which will improve the overall performance of the BizTalk360 database. This also solves the problem of searching the current data with messed up old data.
Can we visualize the performance of Event Log?
In BizTalk360 the BizTalk Administrators can indeed visualize the performance of Event Log data at a specific time.
Scenario 5: In any business environment, the performance metrics at a specific time will be critically important to take business decisions. To visualize the Event Log data the administrators can add the Event Log Data Count widget in the Reporting Dashboard on BizTalk Analytics.
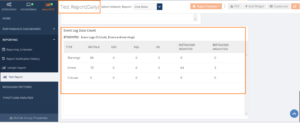
The Event Log reporting widget will show the exact count of Event Log data based on error, warning and critical errors for the available sources. The Event Log data widget will collect the data based on the scheduled time.
Leveraging the API Documentation Capability for Event Log
In BizTalk360, Event Log data in the API Documentation provides you with a very powerful way to integrate data and actions into your own tools or programs. Many of the BizTalk Administrators do not come from a development background and perceive an API as something for the exclusive use of BizTalk admins. This is not the case, and a mature and well-designed security product API can be of great value to other people, regardless of their development background.
Within BizTalk360, you can use the Event Log API Documentation to demonstrate broad functionality, primarily in the areas of:
- user and organization account management
- sample management
- sample analysis data collection
- threat intelligence harvesting
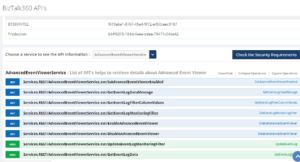
Of course, an easy way to use an API is to use a product that leverages that API. Any RESTful API can be operated by anyone who can construct a web URI. the Event Log API documentation is also useful to create a custom widget using the JSON Response as shown below.
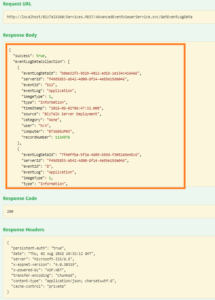
In an organization, you could easily tailor that to a list of IPs (or domains, or URLs, file hashes, etc) that had been seen in the analysis of only your own organization’s submitted samples with the help of this API’s.
Conclusion
To collect and process log data in real time, regardless of the volume of log data and the number of devices in the network, organizations need a robust log collection mechanism. BizTalk360 solves this problem by providing the Advanced Event Viewer functionality, which enables BizTalk Administrator to decipher and analyse any log data regard of its source configured. The collected log data is centrally aggregated and presented in a single console for log sources across locations. To summarise here are the Key features of BizTalk360 Event Log
Event Log Maintenance: Maintenance is also very simple when you disable AEV for the environment, it will stop collecting Event Log data. Manages data growth by Providing BizTalk360 purge policy.
Privileged Multiple Server Monitoring: The BizTalk Admins can monitor multiple BizTalk and SQL servers on a single user interface.
Server event trend analysis: It also protects security threats by collecting, analysing, reviewing and archiving event log. Through this, the BizTalk admins can get a comprehensive view of all the actions that is happening in the BizTalk server, SQL server, ENTSSO server etc..,
Real-time alerts: Receive instant alerts on unauthorized access to confidential data or even to the database server itself.
Intuitive dashboard: Drill down to the raw log level and view collected log content to facilitate simplified root cause analysis.
Out-of-the-box reports: Perform audits with pre-packaged reports that provide detailed information on Event Log Data through Event Log Count widgets.
by Sowmiya Subramanian | Jul 19, 2018 | BizTalk Community Blogs via Syndication
Do you have a BizTalk environment which handles huge volume of transactions? With the BizTalk admin console, It is nearly impossible to go through those data. In the past, BizTalk360 solved this problem by allowing to filter various data based on parameters associated with the data. But for some cases, even if you filtered the data, you might end up having lot of rows in the grid which may not be user friendly. It seems to be slow, while visualizing large set of data in a single grid.
While searching the result with large dataset, the browser seems to jump around while scrolling, providing a not smooth and unnatural experience. This has led that, from a user experience standpoint, scrolling is no longer considered as functional.
Apart from that, even the most modern browsers will eat up lot of memory when rendering all those data in the UI. To overcome this, it’s absolutely necessary to split the results of a query into subsequence’s to achieve constant response times.
At the splitting process, it is very important to keep paging transitions fluently. That means, rows can’t appear twice or miss completely in the result. For this purpose, the so-called Pagination comes into play in BizTalk360.
What pagination really does?
Pagination is an excellent way to navigate through large amounts of content. E.g., when we search for something that returns many records, which cannot be displayed on a single web page, those records are split into number of pages that can be accessed through links via the Pagination mechanism. It enables the user to navigate to the next page one after the other and even jump forward to several pages. Pagination allows you to make large amounts of content easy to find and breaks up several entries or web content into multiple pages, allowing you to toggle through content with ease.
What is improved due to pagination in BizTalk360?
In this version of BizTalk360, we have optimized the grids by providing you the power of pagination. We have implemented pagination for each grid available in the BizTalk360. It is an easy and standard practice, that prevents you from having to load the entire result set all at once.
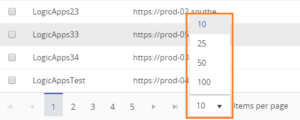
The grid supports both preloaded and dynamically loaded data. By using pagination, the rows in the grid gets dynamically separated into pages. The grid will automatically display 25 rows in each page, by default. The user can increase the maximum number of result rows by selecting the Max Match size in the drop down.
Basic navigation
Pagination can further be customized for different circumstances, like when a user approaches to an end or the beginning, or indicating the current page number to the user. Pagination dynamically separates the rows on each page, as shown below. By listing out the page number, users are allowed to skip ahead, one page at time.
The page numbers which are shown in grey are disabled (or inactive) and the other page numbers are shown in blue, since they are enabled (or active). The user can use the previous and next page buttons, as these can be considered a more intuitive interface for showing the previous/next records.
Sometimes you may simply require Last page and First page links, which provide simple and quick navigation to the beginning and the end of the result set, to the user. These are implemented, as shown below, to further improve the usability.
The First, Previous, Next and Last page links are appended at the bottom of each grid.
Customizing row count in System Settings
By default, the grid will automatically display 25 rows per page, the user can customize the row display by adding the desired row count in Setting->System Settings->Max Matches.
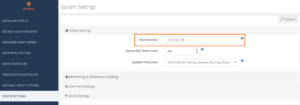
The added Max Matches are displayed in a dropdown at the bottom of each grid. According to the selection of the dropdown, the row count will be changed dynamically on the resulting grid.
Through this, we can reduce the load time on each execution. For instance, it is used by executing the result, where the user can customize grid for displaying a limited number of results on each search, or showing a limited number of rows per page. This way, the overall performance to display the result, will highly be improved.
Row count display
The total grid row count of the current page compared to the overall row count will be displayed at the bottom end of the grid.
At BizTalk360, we believe that a beautiful grid and listing data interactively to user, will make our product stand out and keep customers engaged. Keeping our customer feedback and understanding the consequence of users on execution, the amount of load time increases proportionally to the growth of data. To overcome this issue, we have provided a better solution for our customers, by implementing this type of content grids, which will highly optimize the performance and reduce the customer effort to visualize the result. A major advantage of this approach, is that now an execution can be used to happen in the lower time limit.
by Sowmiya Subramanian | Jul 5, 2018 | BizTalk Community Blogs via Syndication
The BAM Portal in BizTalk360, provides the option for querying BAM views, perform activity searches, check user permissions and to view the query results of Related Activities and Documents the same as in the out of the box BAM Portal of BizTalk Server. However, the user couldn’t view the query results in their respective time zone in BizTalk360, like in the original BAM portal. We brought a number of improvements to the BAM Portal in BizTalk360; setting the time zone is just one of them.
Time Zone in BizTalk BAM portal
Some of our customers requested the functionality to view the query result on their respective time zone. In BizTalk360 v8.8, we came up with the solution, by implementing “BAM Time Zone”. With the help of this, the user can choose the time zone specifically to their requirement.
In the BizTalk BAM Portal, the query result is displayed according to the local Time Zone, while the actual data in the BAMPrimary database is stored in the UTC time zone. BAM captures milestones such that they are automatically recorded in Coordinated Universal Time (UTC) format (this is also referred to as Greenwich Mean Time). When you send date/times to BAM using the APIs, they are received in the format sent without conversion to UTC format.
Time Zones in BizTalk360 BAM portal
Earlier versions of BizTalk360 automatically picked up those data in the BAMPrimaryImport database and display it. BizTalk360 won’t convert any time zone as might be user required; the product will display UTC time zone the same as in BAMPrimaryImport database. From this version on, BizTalk360 will pick up the UTC time in the BAMPrimaryImport database and then convert that into the user required time zone. The user can set the required time zone using the BAM Time Zone.

Usability of BAM Time Zones
The available time zones are displayed in the BAM Time Zone dropdown and the user can choose the specific time zone according to the system Timezone/ local time zone. Through this, the user can view the date time as in the original BAM portal.

The BAM Time Zone also includes Day Light savings, so query result is displayed according to the Day Light Savings.
Can Other Users set the BAM Time Zone?
Only the Super User will have the permission to set the BAM Time Zone. If other users also have that permission, that could create confusion, so to avoid this we have given permission to set the BAM time Zone only to Super Users.
Other users can view which time zone has set, but they have not access to change the set BAM Time Zone.
Related Documents Improvements
In version v8.6, we have implemented the Related Activities and Related Documents Functionality. After this release, we came to know some new workaround from our customers, who noticed an issue in Related Activities view and Related Documents Download Functionality, like

The above issue is because, when the “Activity Id” has any special characters or it is custom created, the user could not view the detailed information. This has been solved in the current version of BAM. The user can now view the detailed information and Related activities without any constraints.

Handling the XML Message in BAMPrimaryImport Database
We came across another new workaround with Related Documents Download functionality. The Related Document is not getting downloaded when the XML message is stored in BAMPrimaryImport Database.
In the BizTalk BAM portal, the user can capture the whole XML Data in LongReferenceData column in the BAMPrimaryImport Database. This can be done by using the AddReference method of the BAM Orchestration Event Stream to log the complete xml message.
BAM can store up to 1 MB of data through the AddReference method (using longReferenceData field with type NTEXT) on the event stream, a great well-performing solution for message-bodies which enables the storage of message bodies alongside the data that describes how it was processed.
Handling the XMLMessage in BizTalk360 BAM Portal
In the BizTalk360 BAM Portal, the Related Documents are only downloaded from the archive folder. From this version of BizTalk360 v8.8, the Related documents will get downloaded either from archive folder and from the database. It checks the XML message either in Archive folders or in the database, if it is found, it downloads the XML File in Zip File Format as shown below.

If the file is not available in both archive folders or database, it will throw a “File Not Found exception” as below.

Filter Improvements
In the previous version, we received a feedback from customers that some filter conditions are not working as expected in the BizTalk360 BAM Portal.

In the current version of BizTalk360, we have fixed the below mentioned filter conditions in BizTalk360 BAM.
- String Filter

2. Date Time Filter

We improved those filters, so it will be working from BizTalk v8.8. We have implemented above functionality in the BAM Portal by keeping our customer feedback and understanding the consequence of users on execution. This implementation will highly optimize the BizTalk360 BAM Portal.
If you are interested, you can read more on our Documentation portal.