by Raja Sreenivasan | Oct 15, 2019 | BizTalk Community Blogs via Syndication
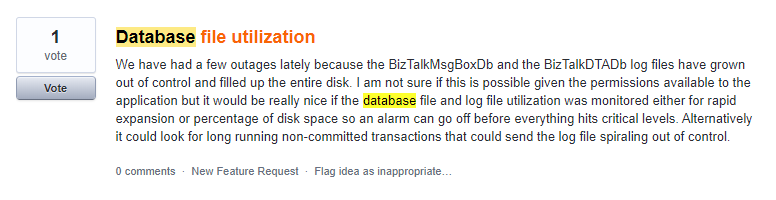
In any BizTalk environment, it is important to keep track of database growth and execute the data purging policies whenever necessary. When the database size grows, the SQL server needs more memory and CPU to read data from the tables, which slows down the database operation. Besides that, there is also the risk that, due to the growing database(s), you are running out of disk space. Database Administrators spend a lot of their time dealing with the problem of database processes consuming too much disk space. So, it’s very important to monitor the database size to ensure the database is not seizing the memory and CPU for smooth BizTalk server operation.
The ability of Database Size Monitoring is a feature request we picked up from our feedback portal. This feature will be available for production use from BizTalk360 version 9.0 phase 3 on.

What can be monitored with Database Size Monitoring?
With Database Size Monitoring, you can monitor the data file and log file sizes of below BizTalk Server and BizTalk360 databases, by simply configuring the error and warning threshold conditions for the data and log file sizes.
- BizTalkDTADb
- BizTalkMgmtDb
- BizTalkMsgBoxDb
- BizTalkRuleEngineDb
- BAM databases (BAMPrimaryImport, BAMAlertsApplication, BAMArchive, BAMStarSchema)
- SSODB
- BizTalk360
For example, if the size of the BizTalkDTADb is greater than a configured threshold value, then you will get notified.
Scenario
OutOfMemoryException in BizTalkDTADb
BizTalkDTADb contains the health monitoring data tracked by the BizTalk Server tracking engine. The size of the database can grow relatively quickly depending on the load of your server, which in turn results in OutOfMemory Exceptions.
This scenario can be overcome by proactively knowing the size of the database and acting against the exponential growth of the database by configuring the threshold limit in database size monitoring.
Monitor BizTalk360 database Growth
There might be a situation where the BizTalk360 database grows due to the amount and size of event log data and performance counter data. The BizTalk360 purging policy will take care of the data growth, but it is also important to monitor the size regularly to ensure BizTalk360 is working seamlessly.
Configuring Database for monitoring size
We wanted to simplify the process of configuring database size monitoring. To achieve this, we list all the BizTalk and BizTalk360 related databases. You can start monitoring by specifying the threshold details from the SQL instance.
To configure a database for monitoring, navigate to Monitoring->BizTalk environment-> Database Size, which lists all the BizTalk and bizTalk360 databases under the respective SQL Instances. Click on the config gear icon, as shown in the above image, to configure the threshold values to monitor the size of the database. Based on the threshold configuration, the user will get notified if there is any threshold violation occurring.
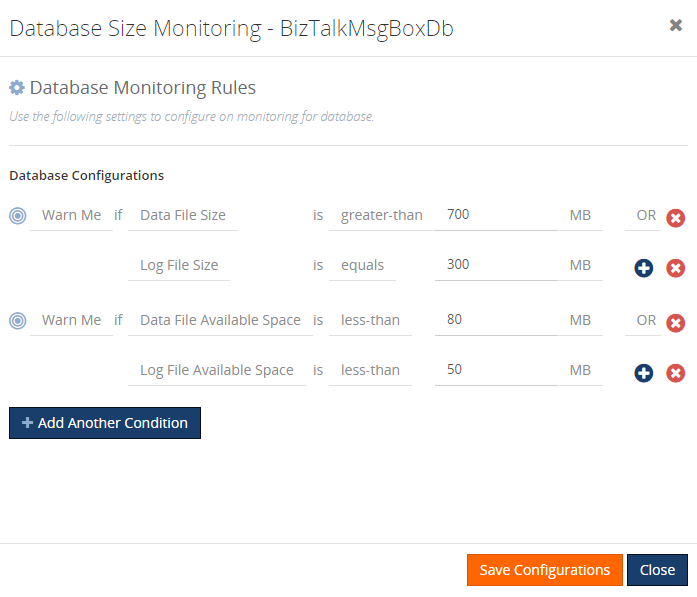
The available Threshold types, logical condition, and unit prefixes are:
|
Threshold Type
|
Logical Condition
|
Unit Prefixes
|
|
Data File Size
Data File Used Space
Data File Available Space
Log File Size
Log File Used Space
Log File Available Space
|
Equals
Not-Equals
Greater-than
Greater-than-or-Equal
Less-than
Less-than-or-Equals
|
Bytes
Kilo-Bytes (KB)
Mega-Bytes (MB)
GigaBytes (GB)
|
Following are the threshold types on which you can monitor a database:
|
Threshold Type
|
Explanation
|
|
Data File Size
|
This threshold type represents the reserved space for the data file.
For e.g.:
Warn Me if Data File Size is Greater-than 200 GB
Error if Data File Size is Greater-than 250 GB
|
|
Data File Used Space
|
This threshold type represents the size used by the data file.
For e.g.:
Warn Me if Data file Used Space not-equals 250 GB
Error if Data file Used Space not-equals 250 GB
|
|
Data File Available Space
|
This threshold type represents the available space for the data file
For e.g.:
Warn Me if Data file Available space less-than-or-equals 99 GB
Error if Data file Available space less-than-or-equals 99 GB
|
|
Log File Size
|
This threshold type represents the size reserved for the transaction log file.
For e.g.:
Warn Me if Log File Size is Greater-than 200 GB
Error if Log File Size is Greater-than 200GB
|
|
Log File Used Space
|
This threshold type represents the space used by the log file.
For e.g.:
Warn Me if Log File Used Space not-equals 250 GB
Error if Log File Used Space not-equals 250 GB
|
|
Log File Available Space
|
This threshold type represents the available space for the log file.
For e.g.:
Warn Me if Log File Available Space Greater-than 250 GB
Error if Log File Available Space Greater-than 250 GB
|
Once the threshold values are configured and saved, the monitoring conditions will be evaluated, and the status of the database size will be displayed in the grid.
The Monitoring Dashboard and BizTalk Group Dashboard display the overall status of the alarm including the Database size shown in the picture below.
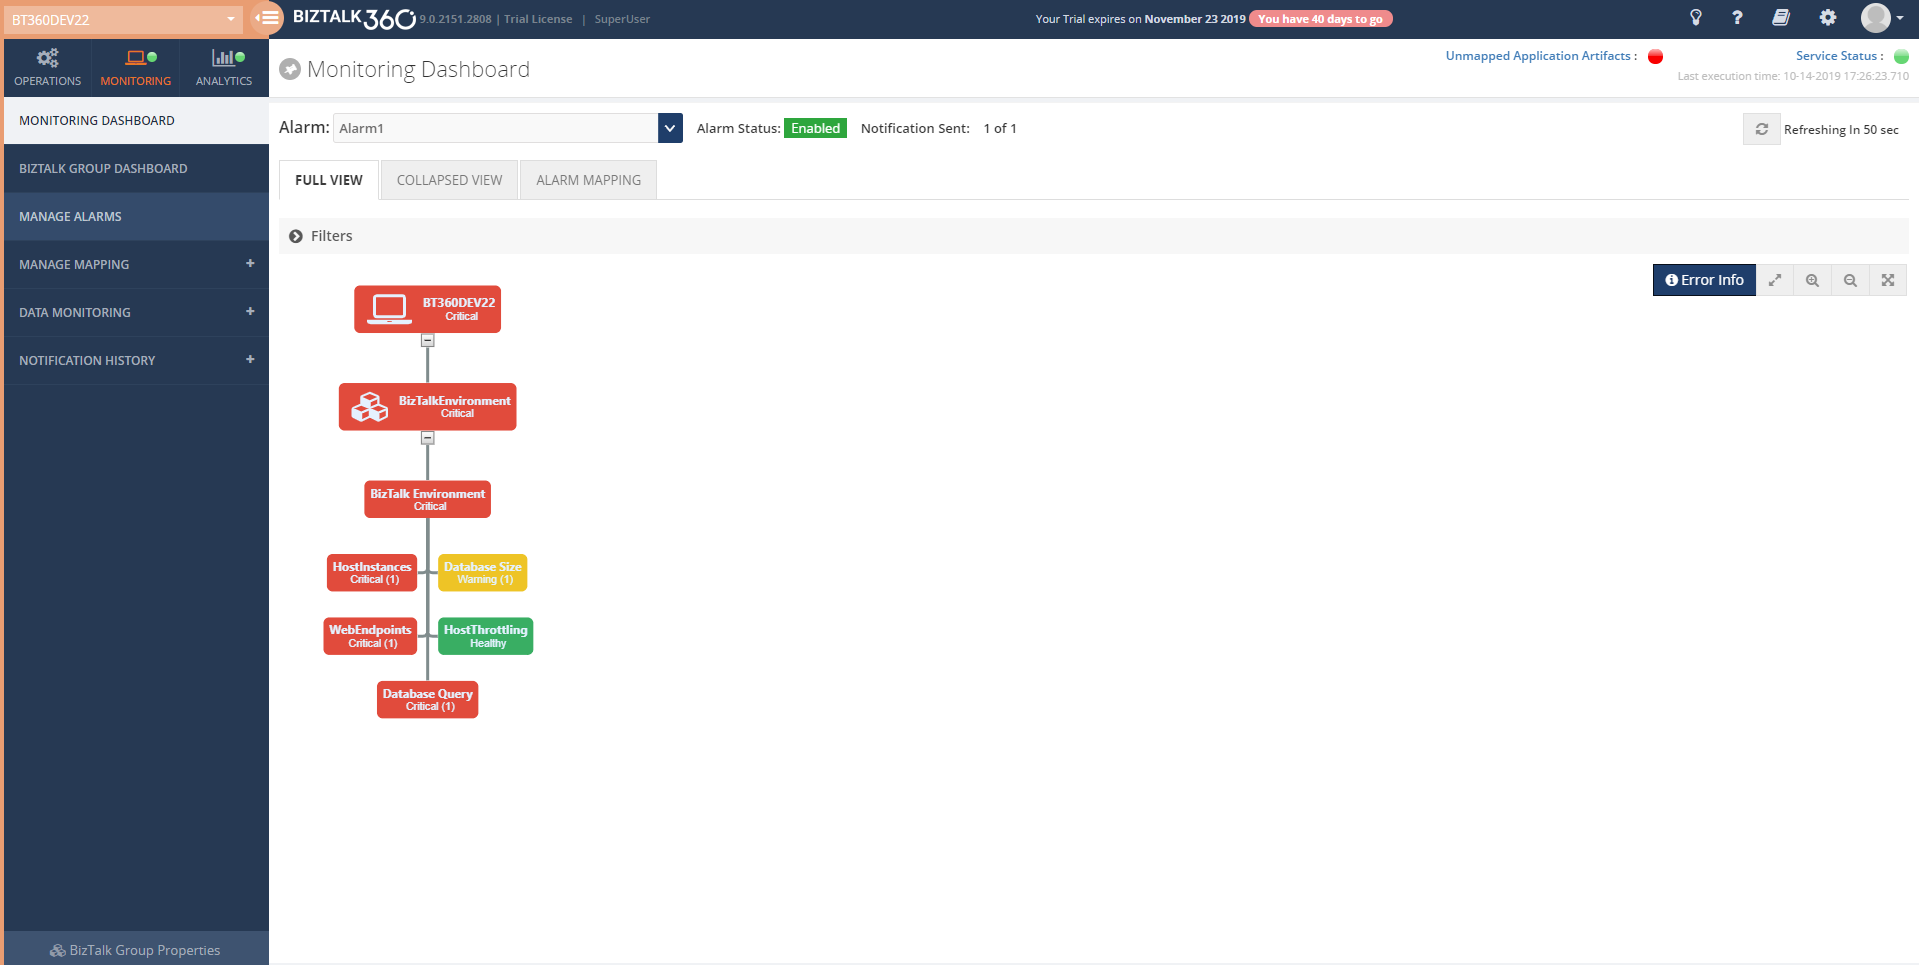
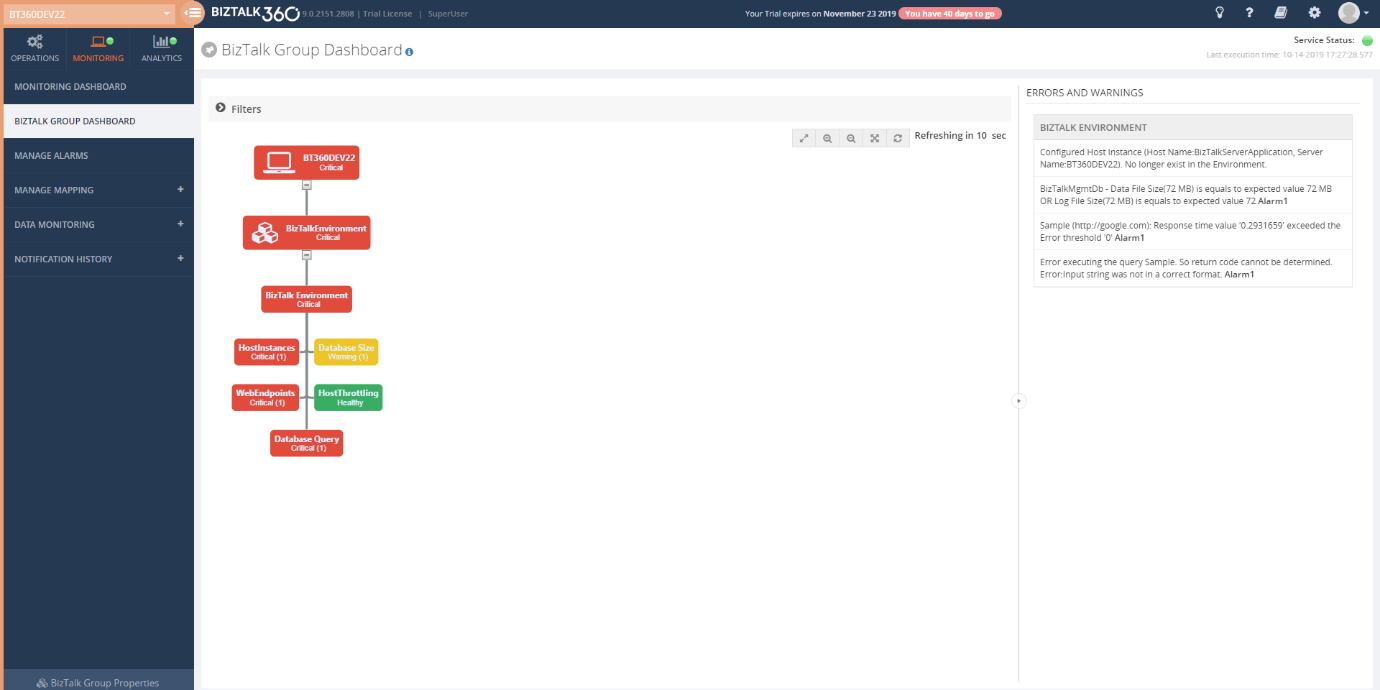
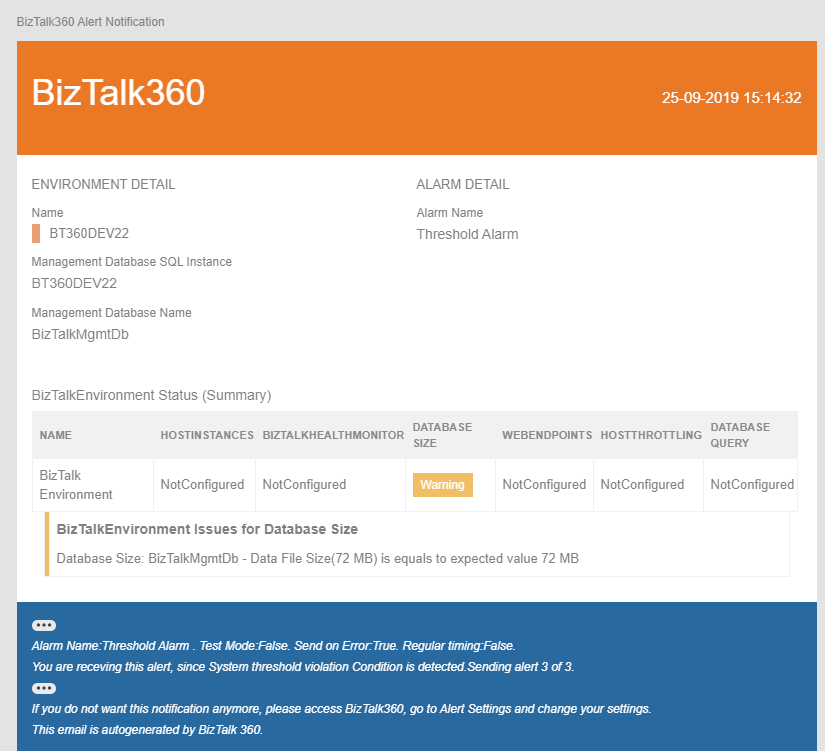
The user will get notified through mail or notification channel when any threshold violation happens.
Quick Alarm
You can also configure database size for monitoring simply by configuring Quick alarm. In this case, an alarm will be created and all the BizTalk and BizTalk360 databases will get configured for database size monitoring with default threshold conditions.
Conclusion
Considering the feedback provided by our customers, via the feedback portal, BizTalk360 will continue to provide more useful features every single release. In the upcoming release v9.0 phase 3, the ability to monitor Database Sizes is only one of the features we bring. If you have any suggestions for a =n upcoming version, please write to us at support@biztalk360.com.
The post Database Size Monitoring appeared first on BizTalk360.
by Raja Sreenivasan | Sep 10, 2019 | BizTalk Community Blogs via Syndication
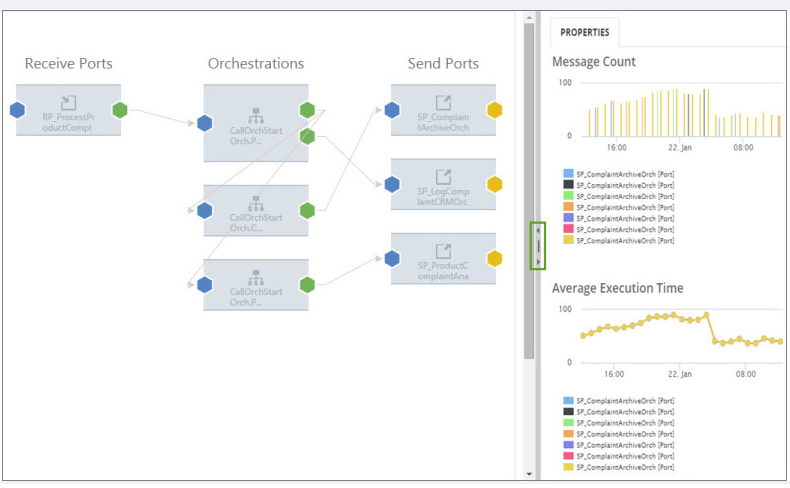
BizTalk360 aims to offer capabilities out-of-the-box from tools like the Windows Performance Monitor. The BizTalk360 Analytics service collects the performance data for the various server types like BizTalk, SQL, IIS, and Windows. Based on the server type selection, the Analytics service will start collecting the performance data and that can be visualized in BizTalk360 Analytics widgets or the user can push that data to third-party APM’s (Application Performance Monitoring) like New Relic, AppDynamics or Dynatrace.
BizTalk360 also allows administrators to automatically execute queries against the Tracking database, at a specific interval, to view, analyze and troubleshoot the tracked data. For the Tracking data, BizTalk360 provides a similar user experience to the performance data collection. This allows the user to pick the metrics they want to collect.
In this article we will look into detailed information about:
- Performance Data Collection of each type (BizTalk, Windows, SQL, IIS)
- Tracking Data Collection
- Analytics Custom widgets in BizTalk360
Performance Data Collection
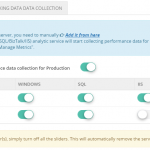
To analyze the performance of a BizTalk environment, BizTalk360 is equipped with Performance Data Collection in the Analytics section. Once the user enabled any one of the server types (BizTalk, SQL, IIS, and Windows) in any selected environment, the BizTalk360 Analytics service will start to collect all the related counters.
For enabling the performance data, navigate to the Settings section of BizTalk360. In the Analytics configuration, you can manage the performance data collection in the Manage Analytics section.
Once the performance data collection is enabled for a server, the Analytics service will start to collect counter data on the next polling cycle.
For a larger environment, the Analytics service may need to collect multiple counter data, but the user might not require all those data. For instance, if a user wants only the BizTalk message related counter data to analyze the performance of the BizTalk environment, the Analytics service collects all the BizTalk related counters.
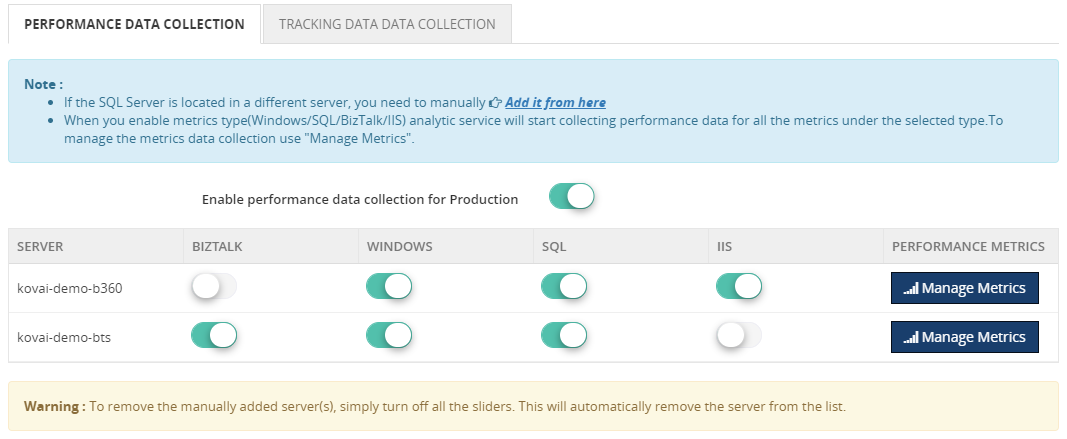
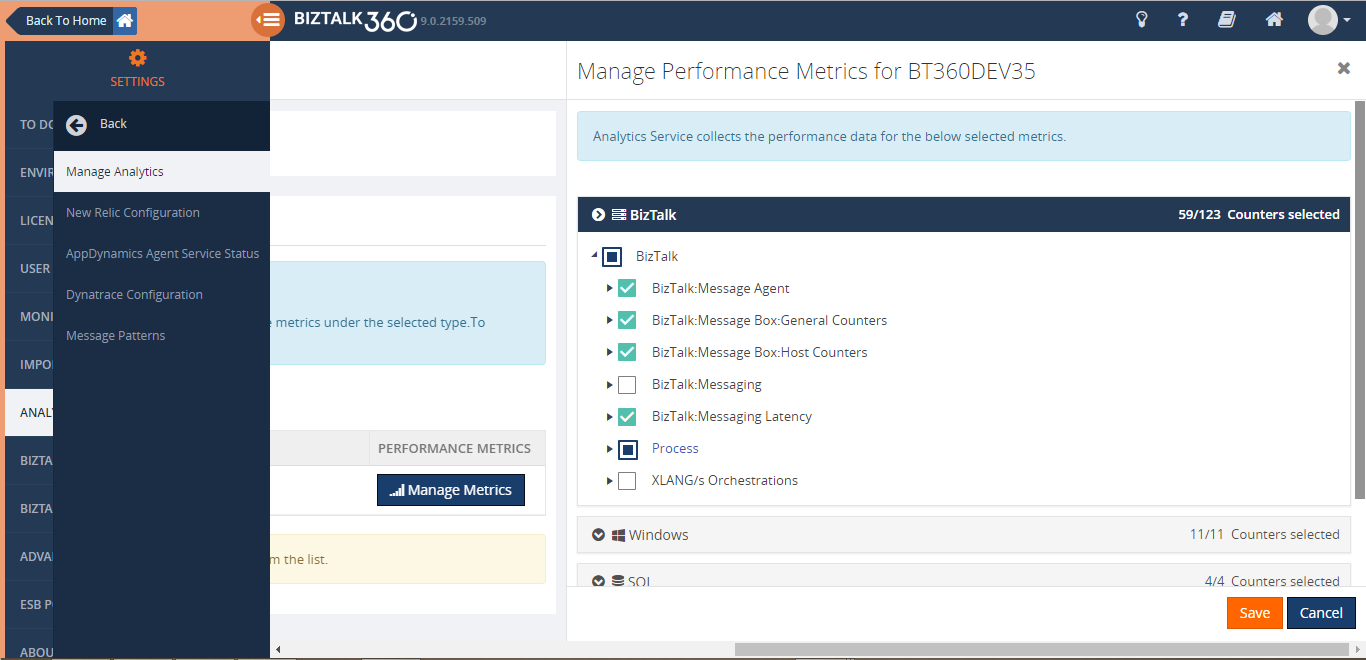
Performance Data collection Optimization
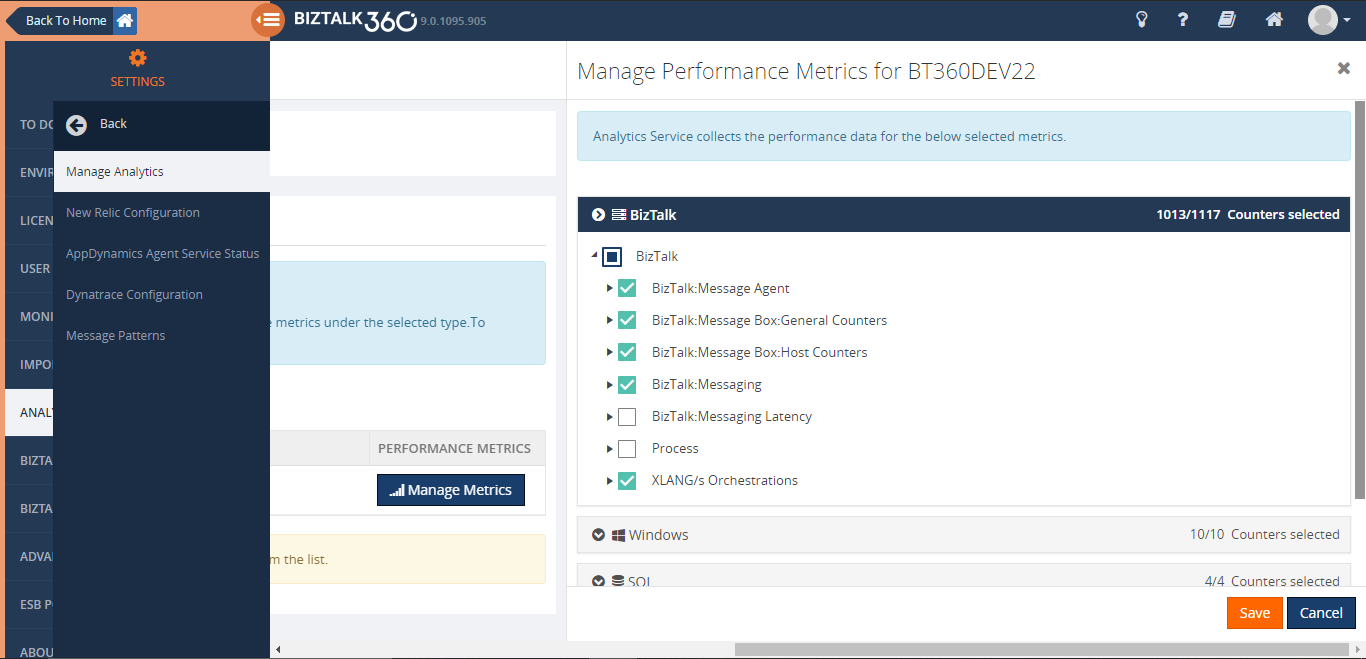
To address this challenge, BizTalk360 allows the user to manage the metrics collection from the v9.0 phase 2. To narrow down the data collection at a server level, the user can optimize the data collection using the “Manage Metrics” option for each server in an environment.
With the “Manage Metrics” option, the user can choose the required performance metrics based on types, so that BizTalk360 Analytics will start collecting data only for those metrics.
Let’s take a deep dive on how a user can manage the metrics collection at the server level.
In BizTalk360, each server’s counter is segregated into 4 types:
- BizTalk
- Windows
- IIS
- SQL
Most of the BizTalk environments will be in a multi-server setup where at least BizTalk Server and SQL Server are configured in different machines. A user may expect BizTalk related counters from BizTalk Server or SQL related counters from SQL Server. A user may not want SQL/IIS related performance metrics data in a BizTalk server machine. By using the “Manage Metrics” option in each server, the user can choose the metrics needed for each server. This improves the overall performance of the Analytics service and avoids the growth of the database.
Tracking Data Collection
BizTalk360 allows the user to run queries against the Tracking database and display the result in a widget. In some scenarios, retaining the tracking data longer than the actually required duration, causes the database to grow exponentially. In other scenarios, the environment doesn’t follow a strict purging policy. For both cases, it is hard to query against the Tracking database due to its size.
In a larger database, querying against the Tracking database and displaying the data, results in a graphical form in the widget. This could degrade the performance of the queries and impact on the user experience of the Analytics dashboard.
To overcome these challenges, we created a service in v8.3 that collects the tracking data periodically in small chunks and avoiding expensive queries on the Tracking database, and metrics are collected rather than pulling all the tracking data into BizTalk360 database.
Once decided to go with new this data collection method, BizTalk360 provides a customizable interface where user can pick the metrics they wanted to collect. A similar user experience to the performance data collection in BizTalk360 allows the user to fine-tune the data collection at an environment level.
Analytics Custom Widget in BizTalk360
BizTalk360 is loaded with customizable information and a variety of widgets to choose from, which can be added to your dashboards. The BizTalk360 Analytics dashboard is loaded with performance data widgets and tracking database widgets, like the Messaging performance and transmission failure rate widgets.
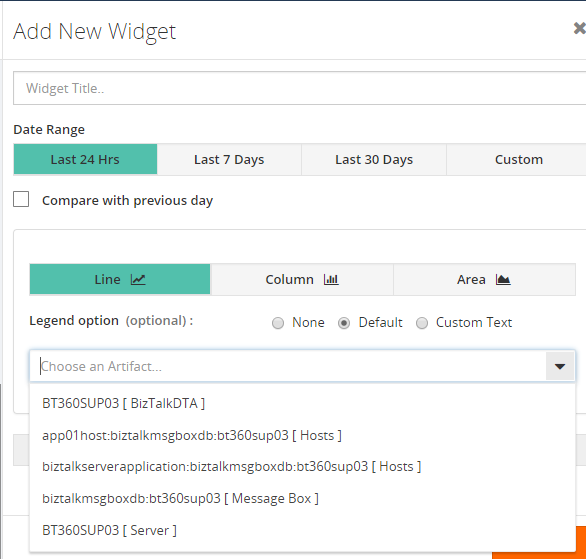
Users can add custom widgets to both the Analytics dashboard and custom dashboards in BizTalk360. The product provides rich options for adding widgets in these dashboards. Users can choose
- Date Range (24 hours, 7 days, 30 days, custom date range)
- Comparing data with previously generated data
- Graph type (line, column, area)
Based on the selected date range, the performance data gets collected from the BizTalk servers.
Once the analytics components, for which the data needs to be collected, are enabled, the different metrics for the custom widgets will get enabled. With the custom widgets, you can choose different metrics for which you want to view the data. Users can choose messaging performance/transmission failure of tracking data or performance data from the drop-down.
Conclusion
Do you wish to see more information on the widgets or from the product itself? Then, please put in your suggestions and feedback in our user voice portal. The existing ideas can also be voted for. We at BizTalk360 aim at providing the features that fulfill the customer requirements. It is from this feedback portal that the features get picked up for every release.
For more information about how these widgets work, check our Documentation Portal.
The post Performance Data Collection Optimization appeared first on BizTalk360.
by Raja Sreenivasan | Sep 2, 2019 | BizTalk Community Blogs via Syndication
It’s time to upgrade to the latest version of BizTalk360 V9.0 Phase2. We always aim to improve our product based on customer’s feedback to meet their business needs. This release comes with a handful of most customer asks features and enhancements.
A brief summary of features and enhancement we introduced in V9.2
Host Instance Monitoring – This feature is extended to support “AtleastOneActive” monitoring state for Clustered and Non-Cluster Host Instances.
Dynatrace Integration – We have integrated Dynatrace in BizTalk360; with this, you can see the BizTalk Server related performance metrics in Dynatrace.
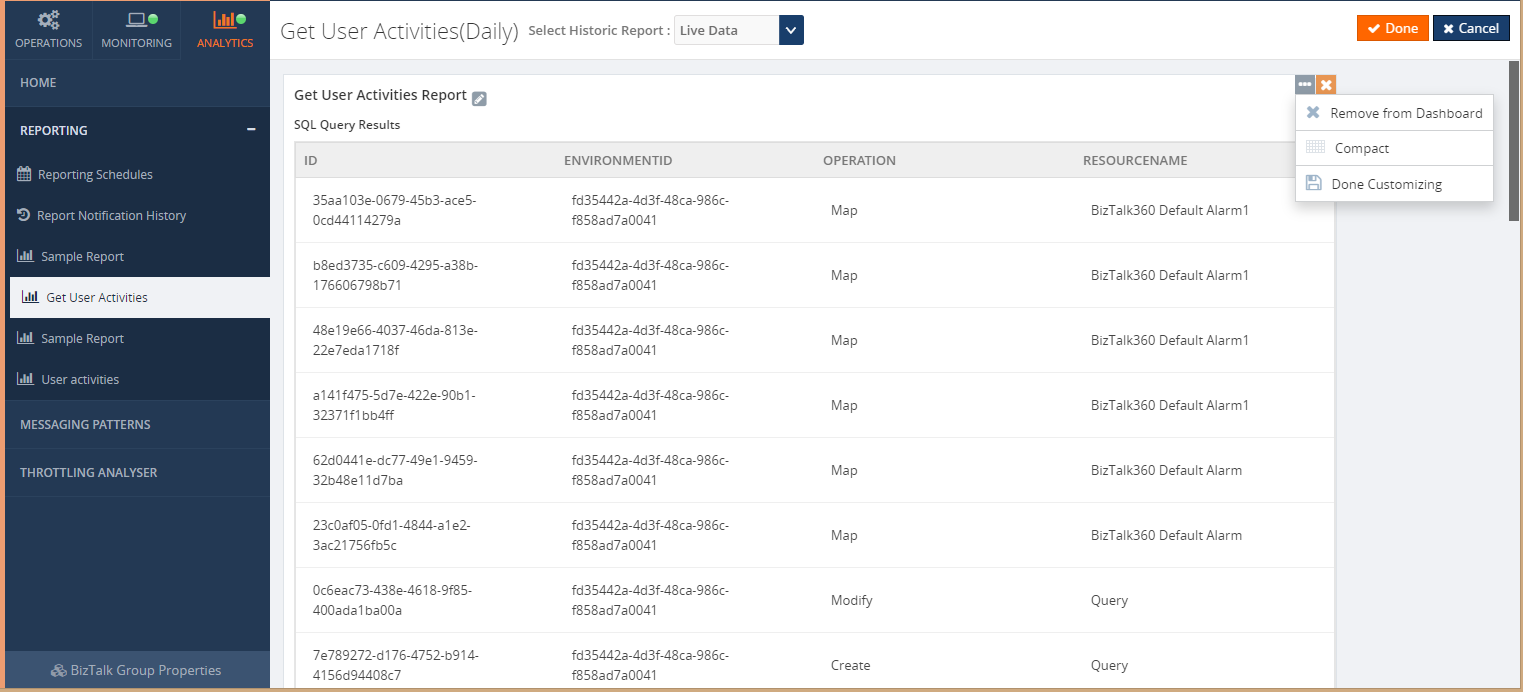
SQL Query Custom Report – In BizTalk Reporting, we introduced an additive widget called Custom SQL Query widget through which SQL queries can be mapped to get the top 100 query result as a report based on the scheduled configuration.
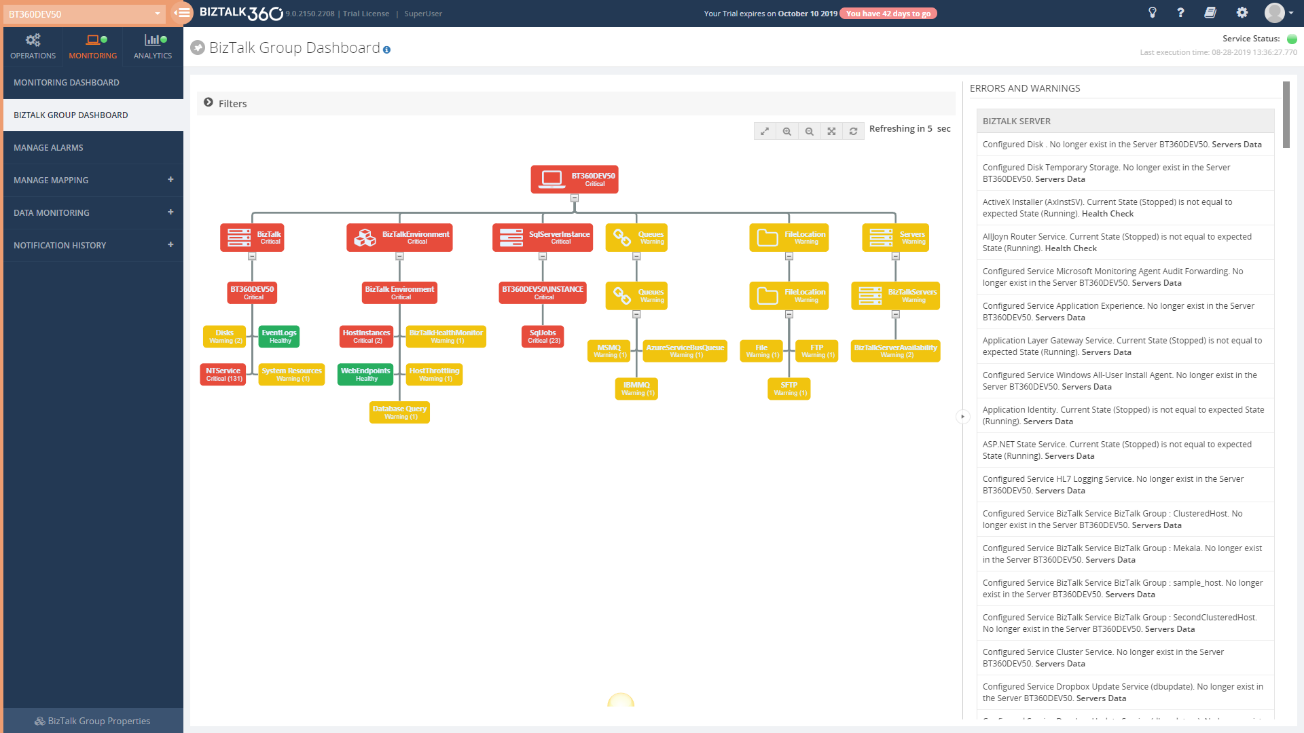
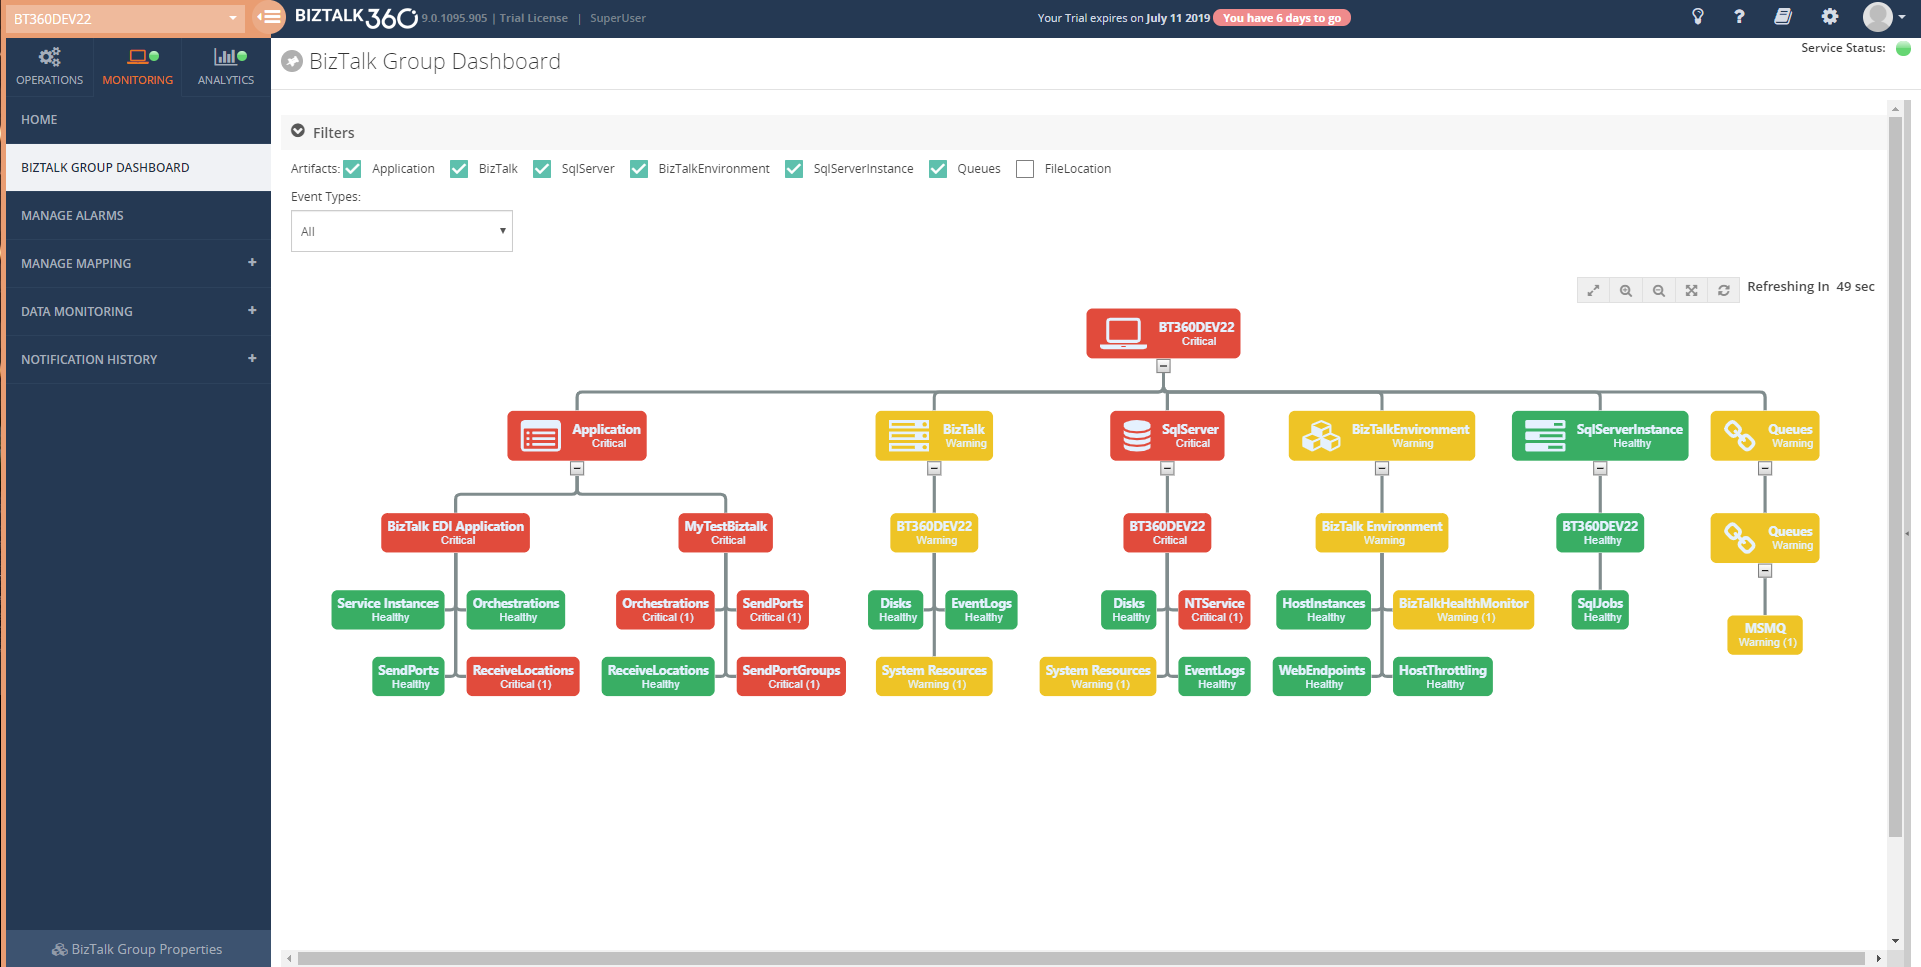
BizTalk Group Dashboard – In BizTalk360’s Monitoring dashboard it was not possible to view the status of all the mapped artifacts in a single view; the user needs to select the alarm each time to view the status of the mapped artifacts of each alarm. To overcome this challenge, we have introduced the BizTalk Group Dashboard which gives a consolidated view of the status of all the artifacts which are mapped to all the alarms in an environment.
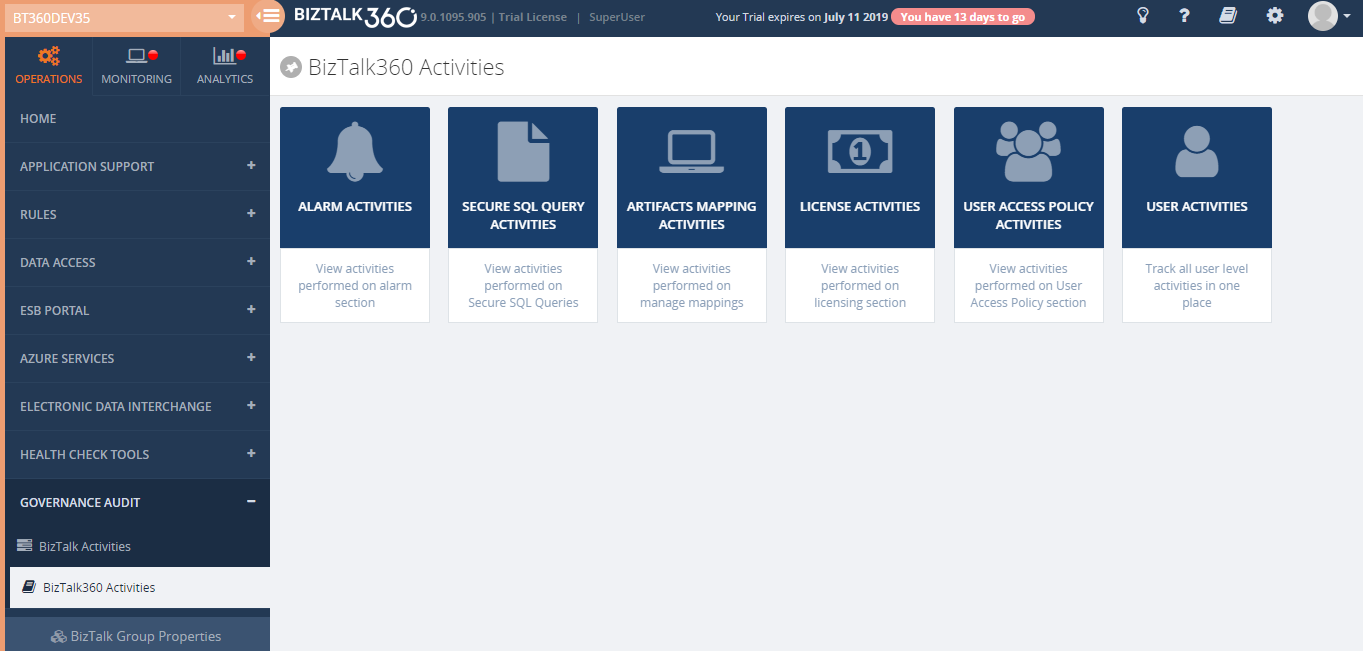
Governance Audit (User Access Policies and License Activities) – BizTalk360 Activities will give a clear view of user actions with respect to Licenses and User Access Policies. License activities include activation, deactivation, remove and manual activation and deactivation. User Access Policy activities will include create, update, delete and import operation under the following section i.e. Manage Users, Manage Application Groups and Manage Custom User profiles
Performance Data Collection Improvements – To improve the performance data collection we are providing an option for the user to select the required performance counters on each type. This way, BizTalk360 will start collecting data only for the selected counters.
Messaging Flow Patterns – Analytics Messaging Flow Patterns can be determined from the BizTalk Management database. Users can switch the Messaging Flow determination technique in the Message Patterns configuration. The Dynamic Pattern option is used to determine the Message Patterns from the tracking database (earlier versions).
Let us jump into more detail of the new features
Host Instance Monitoring
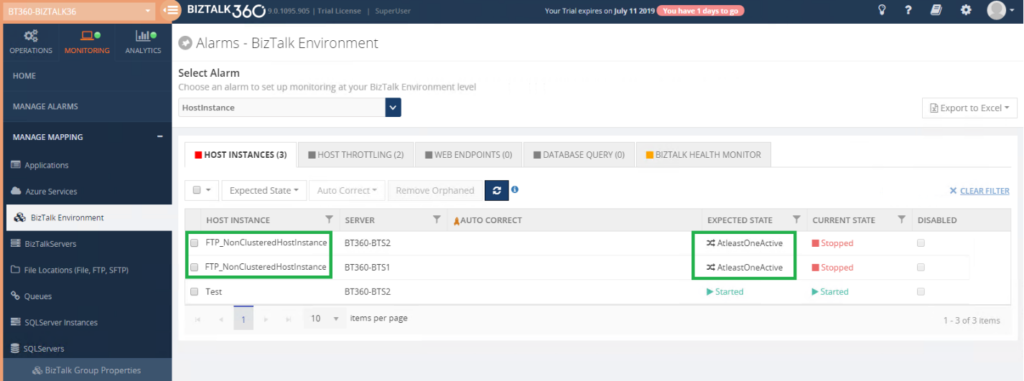
A BizTalk Server Host is a logical container that contains the BizTalk Server runtime processes in which you deploy items such as adapter handlers, receive locations (including pipelines), and orchestrations. The host instance is the runtime process where the message processing, receiving, and transmitting occurs. Obviously, it is very important to ensure your host instances are running in your BizTalk environment. BizTalk360 already made it easy, by introducing the Host Instance Monitoring functionality. In BizTalk360, you can monitor the BizTalk Host Instances by setting the Expected State. If the expected state doesn’t match with the current state of the host instance, you will get notified.
Out of the box, BizTalk360 allows users to monitor the Host Instances using the “AtleastOneActive” state.
If this state is assigned as the Expected State, then the monitoring service will verify that across all the instances for the respective clustered host, at least one host instance is active, guaranteeing that the server is running, and no downtime happened for that host/server.
The user can also enable AutoCorrect for Clustered and Non-Clustered host instances monitoring.
Dynatrace Integration
Dynatrace is an APM tool which has a generic capability to monitor operating systems, network protocols, system metrics, network infrastructure, applications. By Integrating BizTalk360 with Dynatrace you can view the BizTalk Server performance metrics in your Dynatrace environments; which does not need any agent to be installed in the BizTalk Servers to collect data and it does not require any configuration changes at the server level.
BizTalk360 Analytics Service holds a sub-service for Dynatrace which creates custom metrics in your Dynatrace environment for all the counters which you have enabled in the BizTalk360 Analytics configuration section. Each minute the sub-service will start pushing the collected BizTalk Server performance data to the respective custom metrics. These custom metrics data can be mapped to a custom chart and viewed in your Dynatrace dashboard.
SQL Query Custom Report
With the Biztalk360 reporting users can generate PDF documents of critical performance metrics and send emails to the user at specific time periods, depending on the requirement in Reporting Section. Now with this version, you can get your SQL query results as a report just by simply mapping the configured secure SQL queries to the reporting schedule. This avoids switching between multiple tools.
Note: BizTalk360 consists of 6 default queries which the user can only execute. In addition to that, you can create new custom SQL queries as per the business need.
Reports can be generated on Daily, Weekly, and Monthly.
BizTalk Group Dashboard
Monitoring and Notification is one among the most important feature in BizTalk360.In which user can use the Monitoring dashboard to monitor their BizTalk Environment and get notified if any violation persists. But there is one usability problem exist where user cannot see the consolidated view of all the alarms and their mapped artifact in a single view. To Overcome this, we brought the “BizTalk Group Dashboard”.
The BizTalk Group Dashboard is designed to monitor all the artifacts (and view all errors) which are mapped to all the configured alarms in BizTalk360, in a single view. The “BizTalk Group Dashboard” will automatically pick up all the artifacts (which are mapped to any of the BizTalk360 alarms) and displays the status of the artifacts in a graphical manner. Also, the error/warning details of the displayed artifacts are shown in a grid view. The BizTalk Group dashboard checks the status of the artifacts in every 60 seconds.
Governance Audit (User Access Policies and License Activities)
In addition to BizTalk360 auditing Activities, now user can audit the user Access policies and license activities details in BizTalk360 activities.
In License auditing, users will be able to see the activities like License Activation, Deactivation and Removal of licenses, along with the details like Environment name, Product License Type, Environment Type, Order number, License code, License edition, and Max BizTalk servers.
In User Access Policy auditing, BizTalk360 captures the activities like,
- Adding Super/Custom users
- Modifying the access permission for existing users
- Removing users from an environment
- Creating, Modifying or Deleting the Application Groups
- Creating, Modifying or Deleting the Custom User Profiles
Enhancements
Below are some of the major improvements we have done in this release
Performance Data Collection Improvements
In earlier versions, user can enable the performance data collection for the various server types, say BizTalk, SQL, IIS, Windows, where BizTalk360 will start collecting performance data for all the counters of the selected type. From this version on, to improve the performance, we are providing an option for the user to select the required performance counters on each type. This way, BizTalk360 will start collecting data only for the selected counters.
By using “Manage Metrics” option user can manage the performance metrics data collection for each server in the configured. User can choose what type of data they want in the environment level from the neat tree view diagram. Based on the selection analytics service collects the performance data which avoids performance impact.
Messaging Flow Patterns
In complex BizTalk environment, it is important to visualize the patterns of how messages are processed within the system or integrate with multiple disparate systems to handle the message transfer from one point to another. It could be a simple direct transfer between the two ports, or through a complex messaging route passing through orchestrations to perform certain validations, etc. It is helpful to BizTalk Administrators or Business users to track the flow of messages in different stages. For this purpose, the BizTalk Admin Console has the capability to view the workflow of messages, although that feature will mainly be of use for BizTalk Administrators.
we are bringing management capabilities like hiding and deleting of message flows.
The Hide Operation can be used on the message patterns that are decommissioned or less frequently used. The Delete Operation can be applied on the flows that are no longer used in BizTalk Group.
FIPS Compliance Support in Cryptography
BizTalk360 now supports AE5 cryptography algorithm to support FIPS Compliance in Encryption/Decryption mechanism.
SQL Server Monitoring Improvements
- The platinum Users can now add up to 4 servers for monitoring.
- The SQL Server added for monitoring now can be removed.
- The SQL Server which is not reachable can also be added for monitoring, However, the monitoring works seamlessly only when the server is reachable.
SQL Collation support in BizTalk360
BizTalk Server can support both case sensitive and case insensitive collation. To make BizTalk360 more compatible with BizTalk Server, we have improved BizTalk360 in such a way that it will support case sensitive collation as well.
Analytics Widget Improvements
- Information about the different legends in the BizTalk Messaging Performance widget has been added.
- The date/time range for the last 24 hours has been modified to show the time range for the last 24 hours instead of 12 hours
Support for rules created using BRE Pipeline Framework
The rules created using .NET classes with BRE pipeline framework are getting displayed in BizTalk360
ESB Exceptions
In ESB Exception user can provide the Action Type and Comments while deleting the faults, the same will be audited for reference. Also when the message is edited before resubmit then it will be audited as ‘resubmit with data modification’.
Besides these new features and enhancements, we have fixed a few bugs. Refer release notes for more information.
Conclusion
Considering the feedback from our customers, BizTalk360 will continue to provide more useful features. Why not give BizTalk360 a try! It takes only 10 minutes to install on your BizTalk environments and you can witness and check the security and productivity of your own BizTalk Environments.
The post BizTalk360 V9.0.2 Release Blog appeared first on BizTalk360.
by Raja Sreenivasan | Jul 4, 2019 | BizTalk Community Blogs via Syndication
Introduction
BizTalk users who use BizTalk360 can manage their BizTalk environment in a more efficient way. Monitoring and Notification is amongst the most important features in BizTalk360, The first and foremost step for monitoring is mapping the artifacts to an alarm. In which user can use this on a daily basis to monitor their BizTalk environment and get notified if any violation occurs.
The Monitoring Dashboard is the one stop point for users to view the status of the artifacts which are mapped to an alarm. Typically a customer displays the monitoring dashboard in big screens and looks for the health of their BizTalk environment visually. The monitoring dashboard is structured at alarm level, which lists the status of all the artifacts mapped to the respective alarm. However, you cannot see all the alarms and their mapped artifacts status in a single view, which was a usability problem persist from our side. To overcome these we are implementing the “BizTalk Group Dashboard” for the v9.0 (phase 2). With this dashboard you can view the status of all the artifacts mapped to any number of alarm in a single view and you can easily customize it using the rich filter option provided
Let’s deep dive into BizTalk Group Dashboard and see how it solves the problem.
BizTalk Group Dashboard
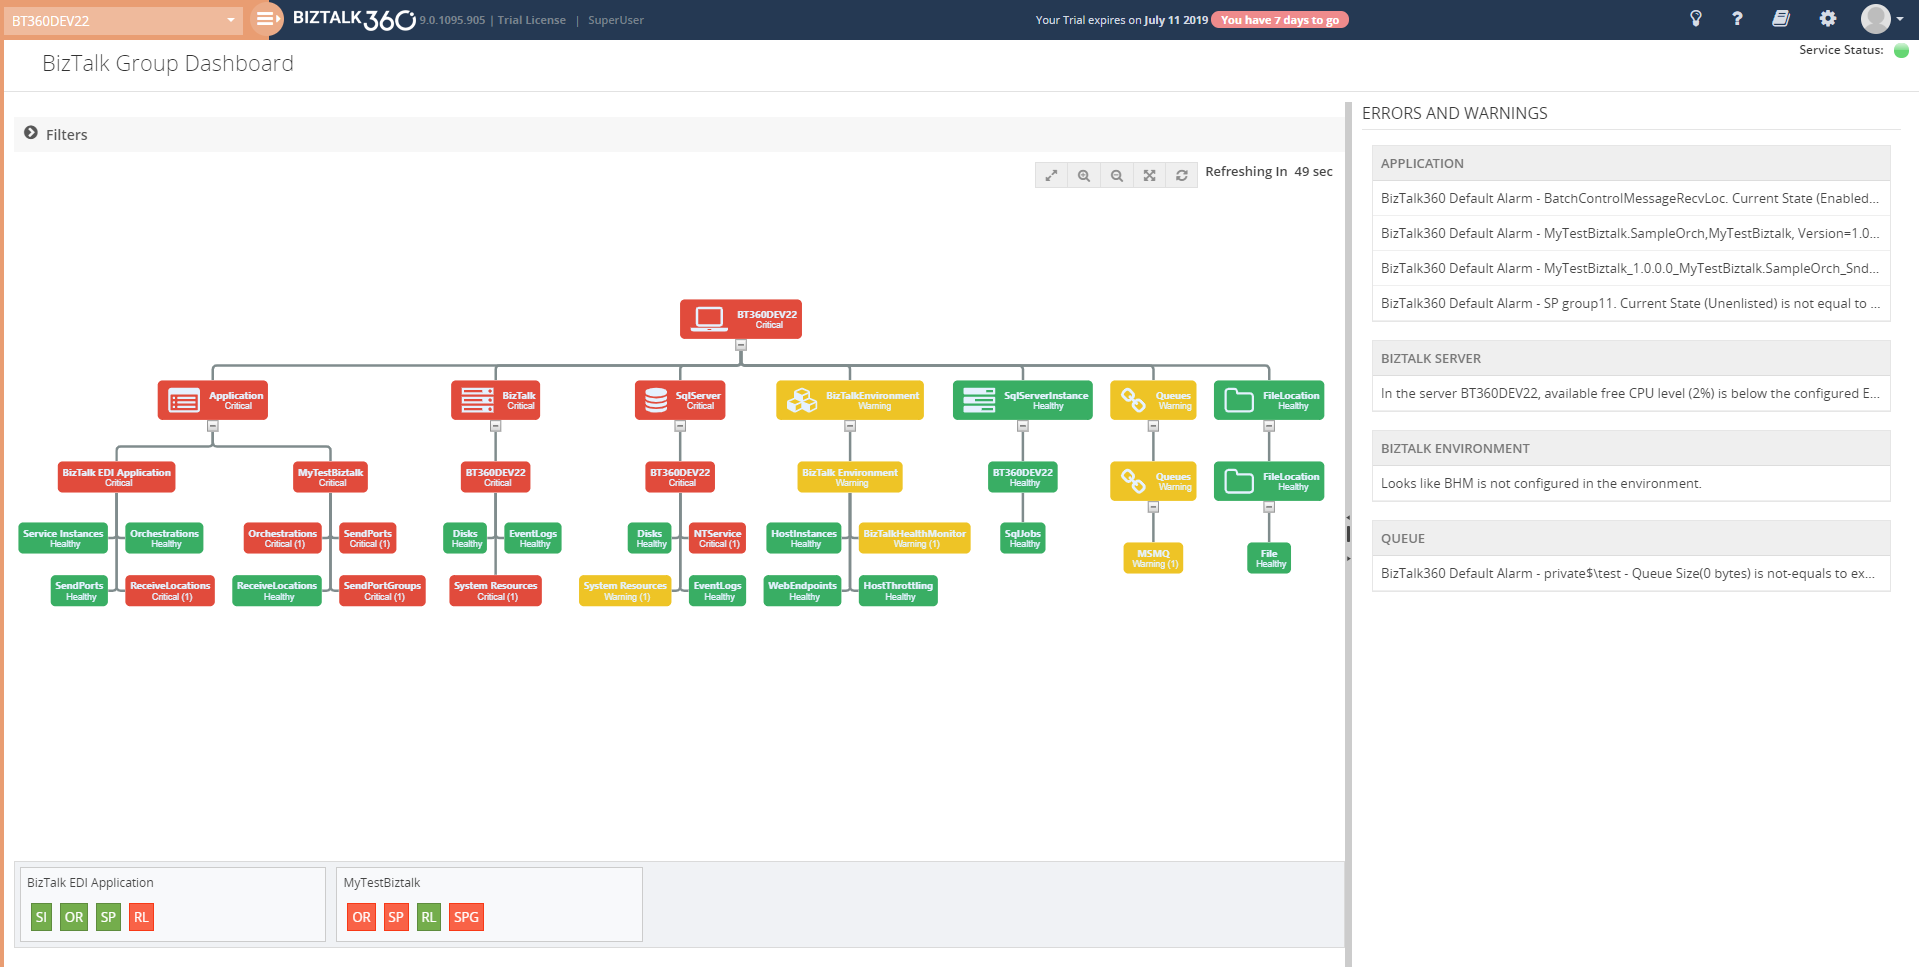
The BizTalk Group Dashboard is designed to monitor all the artifacts (and view all errors) which are mapped to all the configured alarms in BizTalk360, in a single view. The BizTalk Group Dashboard can be found under the Home of Monitoring section. The “BizTalk Group Dashboard” will automatically pick up all the artifacts (which are mapped to any of the BizTalk360 alarms) and displays the status of the artifacts in a graphical manner . Also the error details of the displayed artifacts are shown in a grid view . The BizTalk Group dashboard checks the status of the artifacts in every 60 seconds .
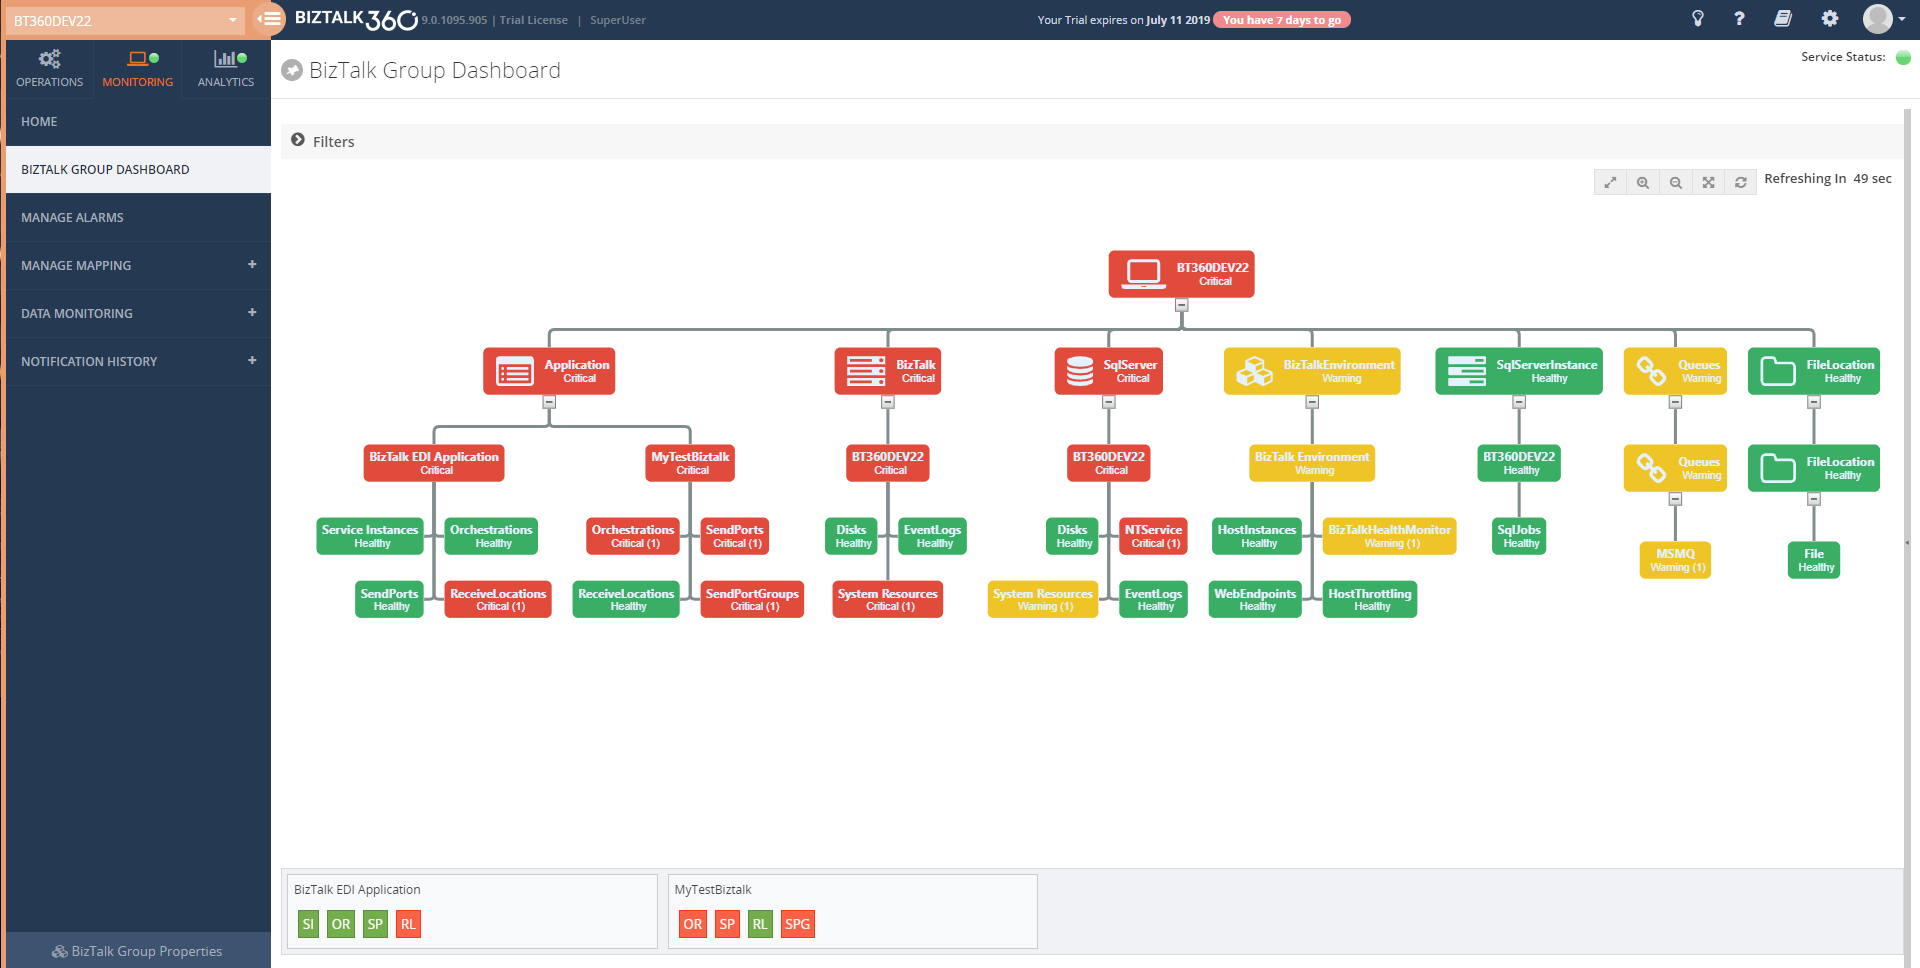
For better usability, BizTalk Group Dashboard splits the windows in two sections:
- Displays the mapped artifacts in a graph
- Show the Error/Warning details in an artifact level segregation
The dashboard has a draggable separator so that the user can adjust the width of the graphical window and the error/warning pane, based on their resolution. They can even minimize or maximize the error/warning pane to the leftmost section.
There is a chance of mapping the same artifact to multiple alarms. In such cases, the BizTalk Group Dashboard picks only the positive state of artifacts for monitoring. For instance, a Receive Location is mapped to an alarm1 with the expected state as Enabled and the same receive location is mapped to another alarm, say alarm2, with the expected state as Disabled; in this scenario, the BizTalk Group dashboard will only consider the positive state mapping such as expecting state as Enabled for monitoring.
Note: BizTalk group Dashboard is only designed for visual monitoring of the BizTalk environment and artifacts. It will not trigger any alert notifications.
Advantages of BizTalk Group Dashboard
Comparing to the already existing Monitoring Dashboard, the BizTalk Group dashboard has quite some advantages. Some of the main advantages of the BizTalk Group Dashboard are:
- It consolidates the status of all the artifacts which are mapped to any alarm and there is no need to switch alarms for viewing the status of any other artifact
- The BizTalk Group Dashboard can be split into two windows; one for the artifact graph and the other for viewing the Error/Warning pane. For usability, the split windows can be adjusted based on the monitor resolution
- For better monitoring, the user can apply filters (at the top of the graph) based on the artifact and/or based on the event type filter option
- The user can view the Error/Warning details along with the graph
Scenarios
Many organizations use different alarm configurations and patterns for their processes. Some of the commonly used alarm configuration patterns are:
- Integration-based alarm configuration
- Role-based alarm configuration
- Entity-based alarm configuration
Integration-based alarm configuration means configuring BizTalk artifacts, File location, Queues, Web endpoints, etc. in an alarm, which all belong to the same integration.
Role-based alarm configuration is configuring alarms for people in different roles. For example, a platform administrator will be interested in infrastructure settings like Disk, system resources, host instances in an alarm.A Database Administrator (DBA), on the other hand, will be more interested in the SQL Server instances and the jobs which have been deployed in it.
Entity-based alarm configuration is configuring similar components in the same alarm. For instance, putting all the queues like IBM Queue, Azure service bus queue, MSMQ in one alarm.
Irrespective of the alarm configuration/pattern, now the user can customise the BizTalk group dashboard using the filter capablity .Say Administrator can monitor the infrastructure components which are mapped to all the alarm .) and queues in a single dashboard window by filtering only the Infrastructure components.
Conclusion
With this feature, users are able to visually monitor all the artifacts and view error/warning details in a single dashboard with a much more comprehensive view. If you have any feedback or suggestions, please write to us at support@biztalk360.com. You can get started with monitoring your BizTalk environment via the BizTalk Group Dashboard by downloading the 30-day free trial of BizTalk360.
The post Consolidated monitoring with the new BizTalk Group Dashboard appeared first on BizTalk360.
by Raja Sreenivasan | Apr 2, 2019 | BizTalk Community Blogs via Syndication
Introduction
BizTalk360 already has the capability to integrate with New Relic, in which user can get insights on real-time performance data .
Application Performance Management or Application Performance Monitoring (APM) is an essential tool to help managing and monitoring the performance of an application.In today’s market a wide range of tools is available to optimize and monitor the performance of an application. AppDynamics is a well-known top application performance monitoring tool when it comes to APM. Knowing the importance of Application Performance Monitoring, BizTalk360 provides integration with AppDynamics from the v8.9.6.
Why do we integrate AppDynamics in BizTalk360?
For large organizations spend quite good investment when comes for complex network for optimization and monitor the performance of apps and related issues.AppDynamics is widely used by companies as an enterprise-wide monitoring solution and it has the capability to provide deep performance analytics of your configured environment .Considering the importance of monitoring the performance of BizTalk Server environment in a single place, few of our customer requested us to integrate AppDynamics in BizTalk360.
If you are already using AppDynamics, you can view the performance metrics of the BizTalk server environment across multiple widgets in AppDynamics dashboard from the BizTalk360 v8.9.6.
BizTalk360 Analytical Data in AppDynamics
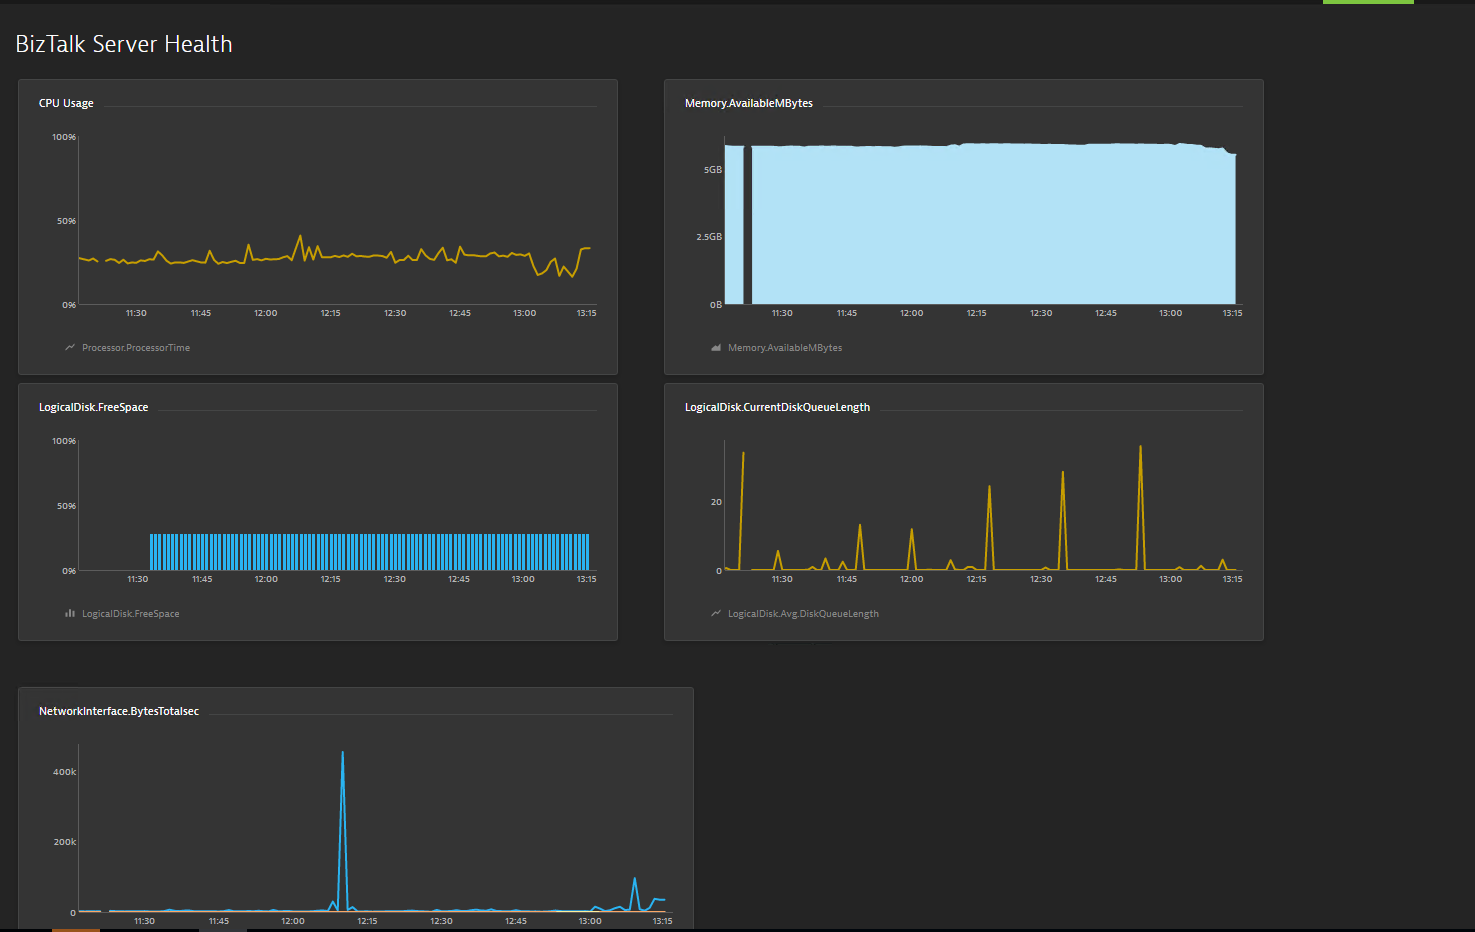
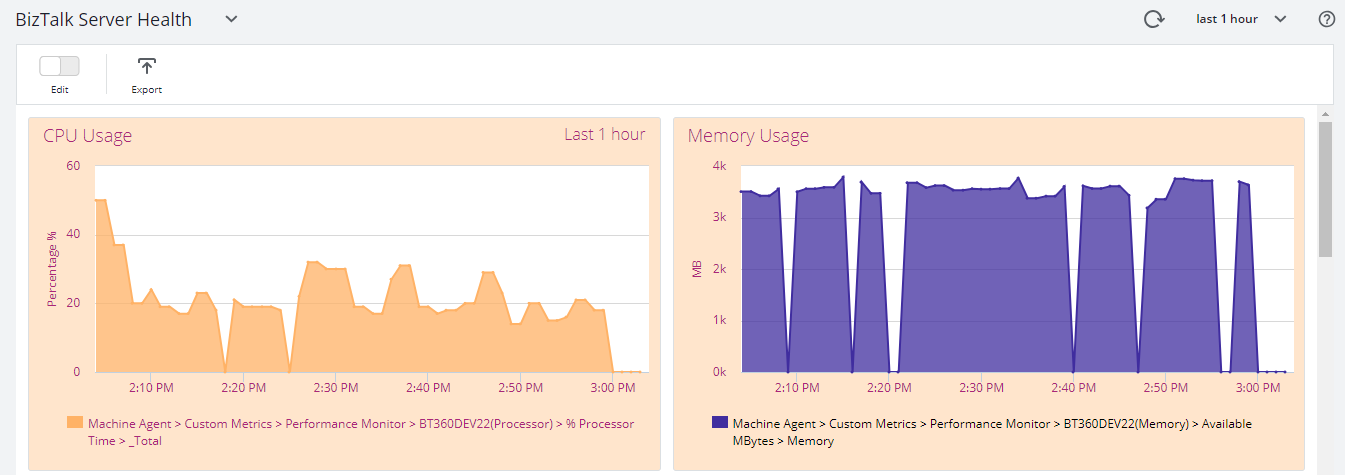
Initially, BizTalk360 will provide capabilities to push BizTalk Server Analytics information to the AppDynamics. Some of the important BizTalk environment performance metrics categories are
- BizTalk Server Health
- Host Performance
- Messaging
- SQL Server
- Throttling
All metrics have different counters, which are constantly being collected and pushed over to the AppDynamics Controller.
BizTalk Server Health Metrics has
- CPU Usage
- Memory Usage
- Disk Free Space
- Average Disk Queue Length
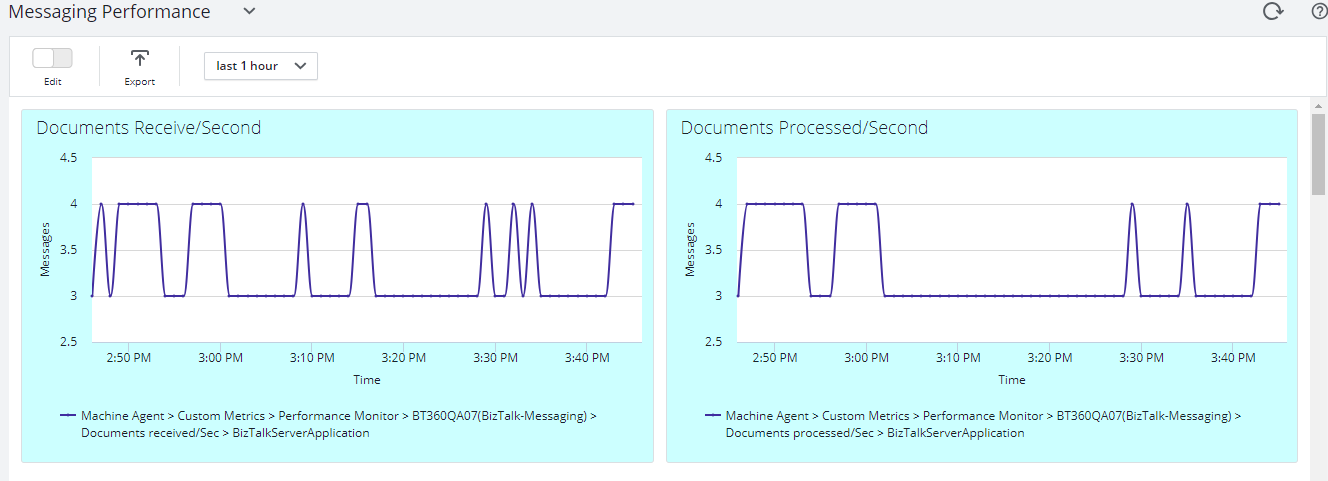
Message Performance
- Documents Receive/Second
- Documents Processed/Second
- Inbound Latency (Sec)
- Outbound Latency (Sec)
- Outbound Adapter Latency (Sec)
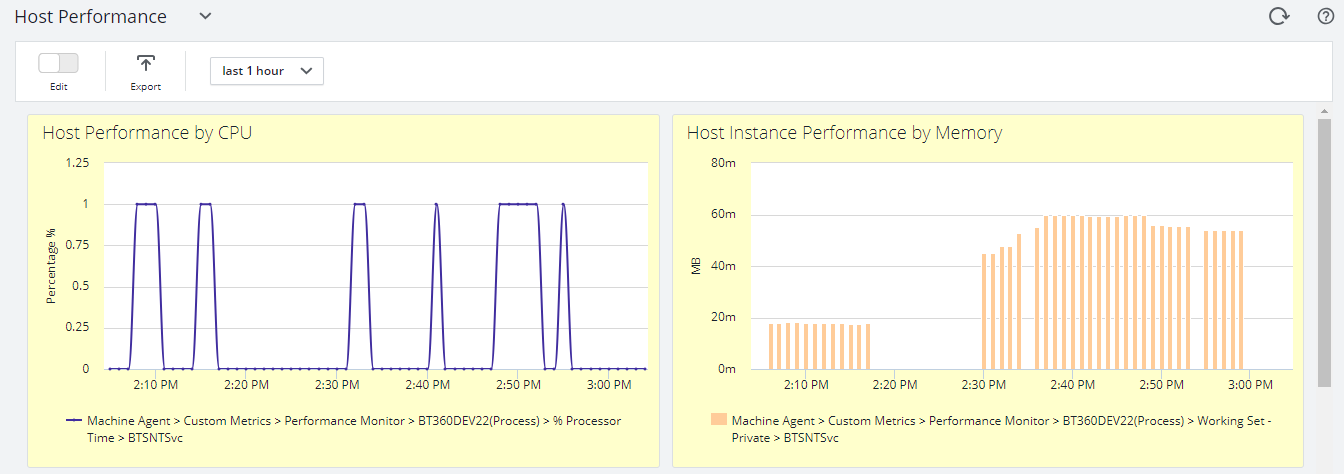
Host Performance
- Host Instance performance by CPU and Memory
Throttling Performance
- Message delivery Throttling State
- Message Publishing Throttling State
- Message Delivery Outgoing Rate
- Message Delivery Incoming Rate
- Active Instance Count
How does BizTalk360 connect with AppDynamics
Every monitoring tool has a different core architecture. When looking on the surface, they might look similar, but when we look in detail of it, it becomes clear how different all the monitoring tools works.
AppDynamics supports different development languages, while we are using .NET because BizTalk360 is build on top of .NET framework.
AppDynamics provides a piece of software called Agent which is installed on the server to which application needs to be monitored. The Agent collects metrics and sends them to a server called the Controller. The controller processes the metrics and presents them via Web Browser.
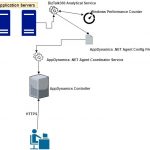
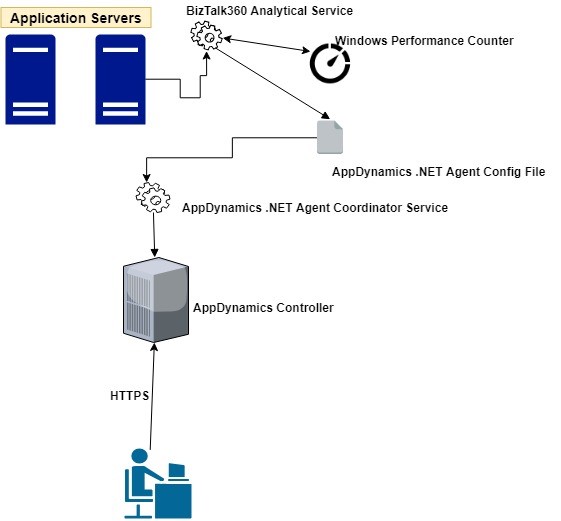
The BizTalk360 Analytics service includes a sub-service called “AppDynamics” which is responsible to constantly push BizTalk Server performance data to Agent. The AppDynamics sub service executes every 70 seconds and checks for the data in the performance data service(another BizTalk360 Analytical sub service). The Controller, which processes the data, makes the data available through a web browser to the user.
BizTalk360 collects the BizTalk Server Analytical data and the AppDynamics agent constantly picks up these data with the help of Windows performance counter data and sends it over to the controller. In AppDynamics, this data is available under the custom metric in the Metrics browser of each application.
Configuration of the AppDynamics Agent
For configuring the AppDynamics agent, you need to download and install the .NET Agent (32/64 bit) in the Application server (where the BizTalk360 Analytics Service is running) . Once the installation is successful, the .NET agent creates the coordinator service and configuration file which consists of the controller and application details.
The default location of the machine agent configuration file is located at:
For Windows Server 2008 or later: %ProgramData%AppDynamicsDotNetAgent
BizTalk360 collects all the BizTalk Server analytical data assigns it to Windows performance counters, and updates the performance counters in the AppDynamics config file as below .
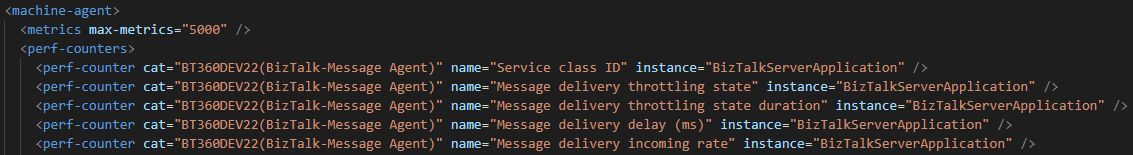
The data will be collected by the .NET Agent coordinator service and passes it to the respective controller as custom metric mentioned in the agent configuration file.
To get the latest performance metrics/counters user need to restart BizTalk360 Analytics service, by doing this the new counters will be updated in AppDynamic config file. Agent then collects the newly introduced performance counter values and start updating in the respective application metric browser configured in AppDynamics.
Series of steps to be covered after configuring AppDynamics .NET Agent
- By default when you install/upgrade BizTalk360 AppDynamics sub service will be in the paused state. You need to manually start the service by navigating to BizTalk360 Settings->Analytics health ->Analytics Service Status->AppDynamics .
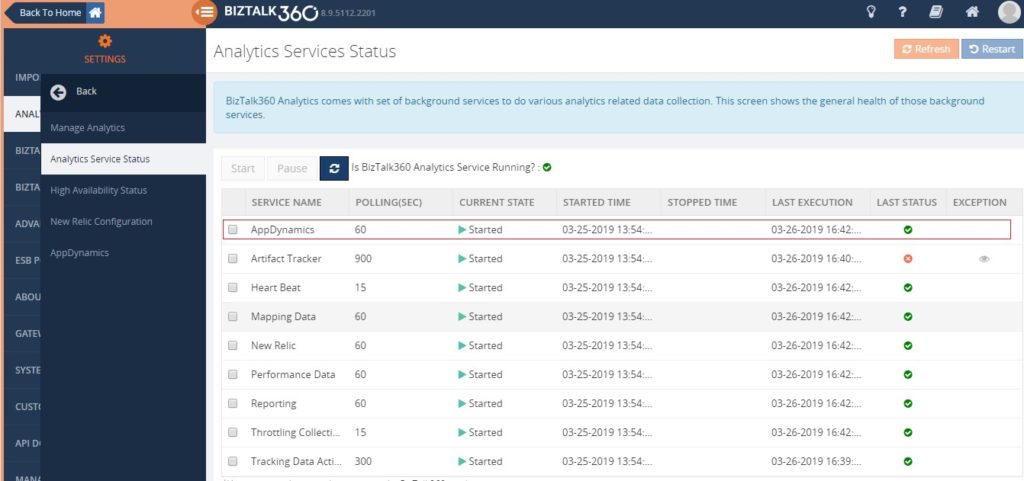
- Ensure performance data collection is enabled in Manage Analytics of BizTalk360 setting side for collecting the analytics data.
Custom Metrics in AppDynamics
Once the AppDynamics agent coordinator service starts pushing data, all the metrics will be available under the metric browser of the respective application in AppDynamics.
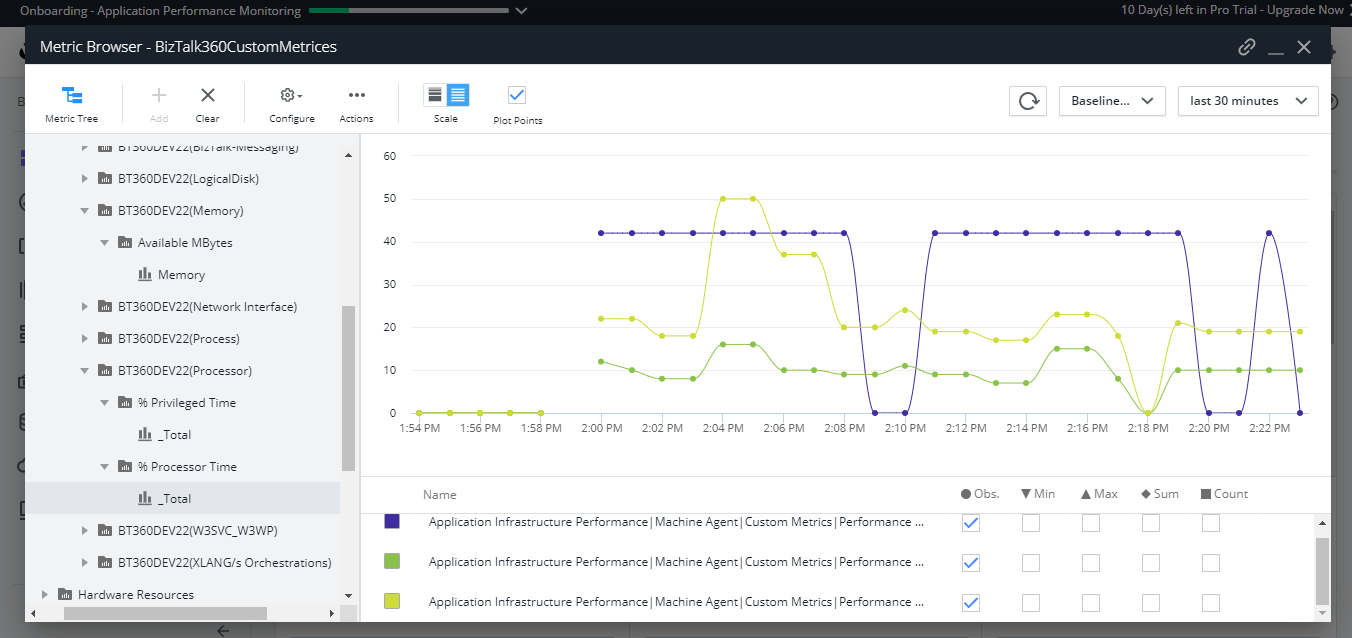
- Once the data is populated, you can create dashboards which consist of different metrics data as shown below.
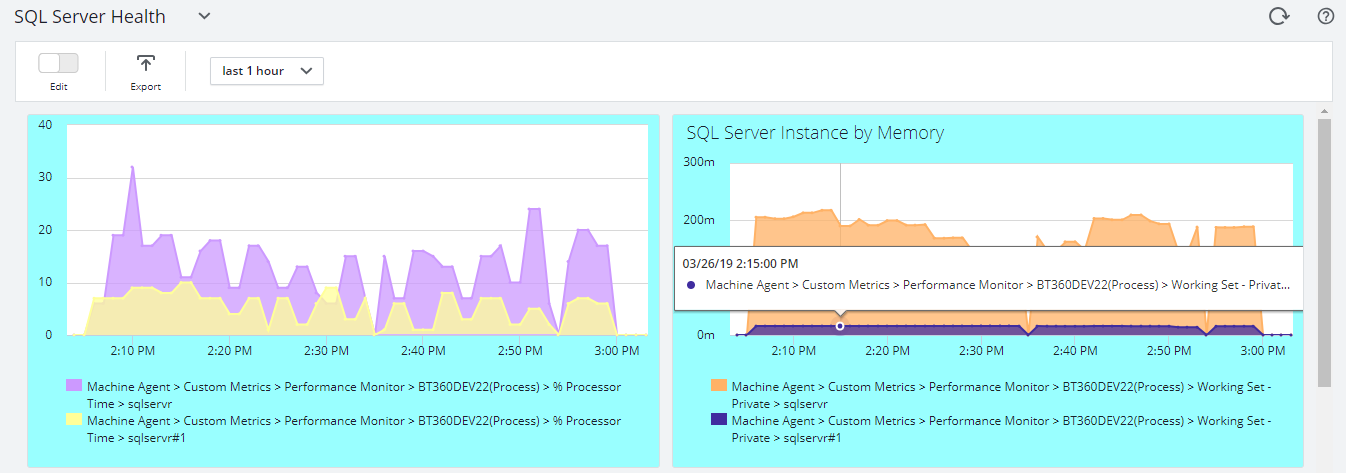
BizTalk Server High Availability
To maximize the uptime of the BizTalk Server solution it is important to monitor the availability of BizTalk Server environment. By enabling the performance counter in Analytics section, the BizTalk360 Analytics service will start to push data to AppDynamics with the help of the Agent coordinator. All the data are segregated based on server name and their corresponding metrics and counters.
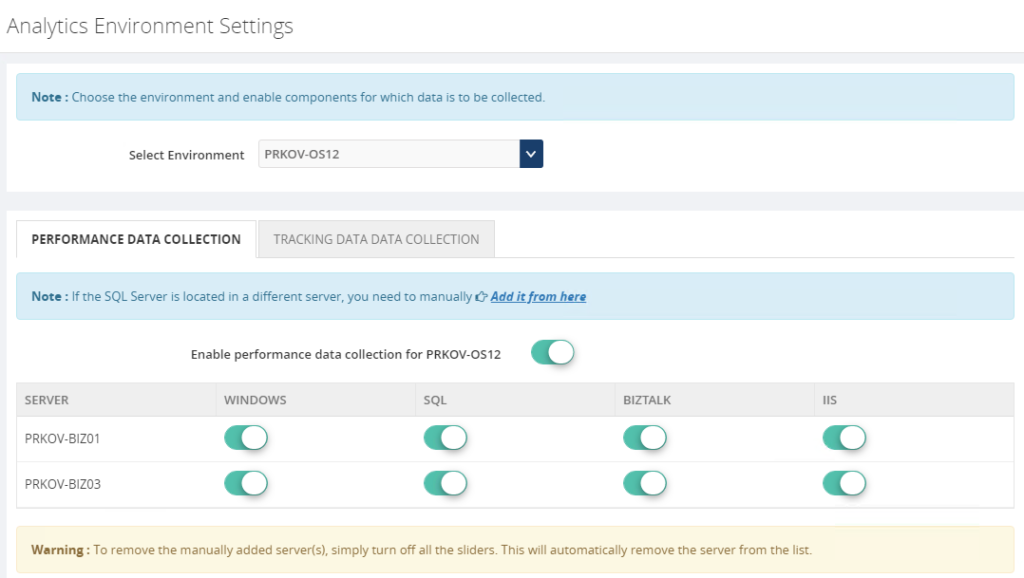
Multiple Environments
You can configure and manage multiple BizTalk environments in BizTalk360. For adding multiple BizTalk Environments please refer this link.
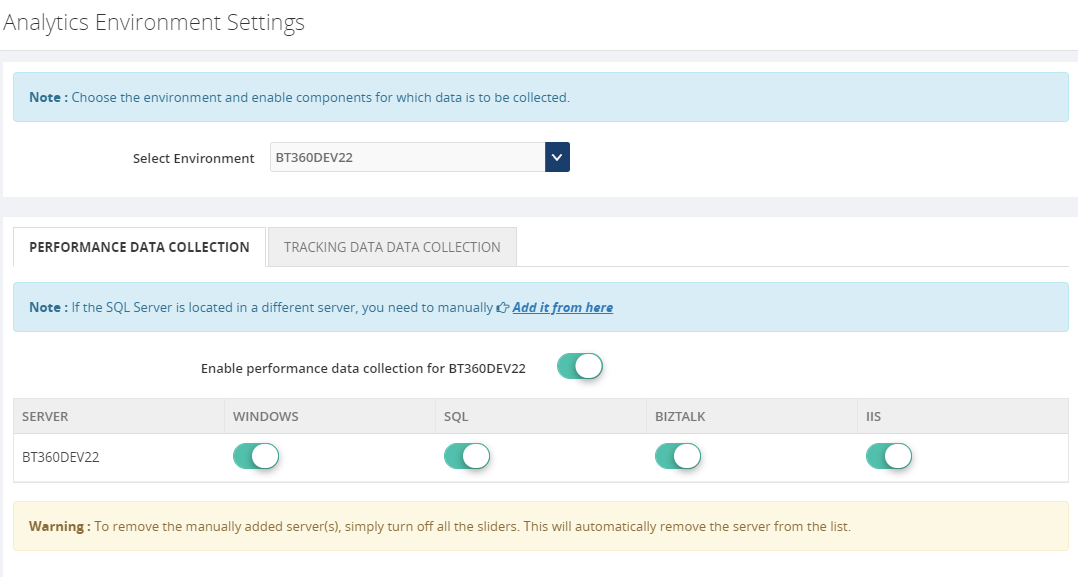
For collecting the performance value of configured environments just enable performance data collection for each server by selecting the respective server name from the dropdown as below .
Environment1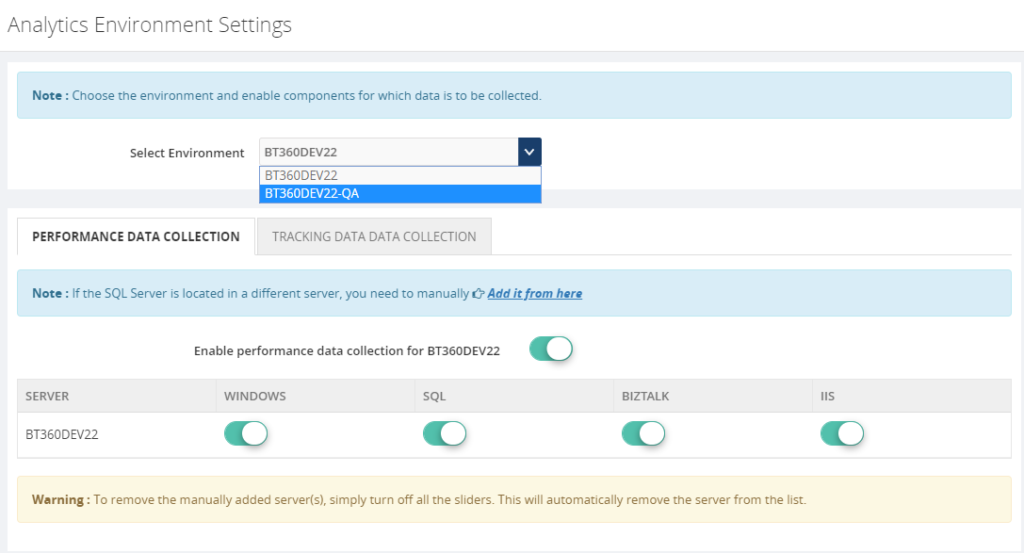
Environment2
Once the Analytical service starts collecting the performance data and pushing it to Agent coordinator , the same you can monitor in AppDynamics dashboard for both the environments.
BizTalk360 High Availability
BizTalk360’s monitoring services and user interface can be installed in more than one places which makes the BizTalk360 as Highly available. It’s predominant to monitor the BizTalk Server and maximize the up-time of BizTalk360. By default, the BizTalk360 high availability services will be available as active and passive on the installed servers and make sure the BizTalk360 is healthy(always up).
To make AppDynamics data collection as highly available you have to install the AppDynamics .NET Agent on the machines where BizTalk360 Analytics services are installed. So when ever the analytics service changes its availability (active/passive) it will collect the data and push to AppDynamics.
Conclusion
With its latest release v8.9.6, we will be bringing the capability to push the BizTalk Server analytical performance data to AppDynamics for optimizing and monitoring BizTalk Server. If you have any feedback or suggestion, please write to us at support@biztalk360.com. You can get started to use AppDynamics integration by downloading the 30-day free trial of BizTalk360.
The post APM (Application Performance Monitoring/Management) Integration in BizTalk360 appeared first on BizTalk360.
by Raja Sreenivasan | Nov 8, 2018 | BizTalk Community Blogs via Syndication
Introduction
In this article, we will provide an introduction of IBM MQ, how BizTalk Server can connect to IBM MQ and how to setup monitoring of IBM MQ Queues with BizTalk360.
IBM® MQ, formerly known as WebSphere MQ, is messaging-oriented middleware, which simplifies and accelerates the integration of different applications and data across multiple platforms. It uses message queues to exchange information for independent and non-concurrent applications in distributed systems. IBM MQ is available for large number of platforms, being:
- z/OS (mainframe)
- OS/400 (IBM System I or AS/400)
- UNIX (AIX, HP-UX. Solaris)
- HP Nonstop
- Linux
- OS 2000
- Microsoft Windows
Microsoft Windows Platform
IBM MQ is messaging and queueing middleware, with several modes of operation:
-
- Point-to-point
- Publish/Subscribe
- File Transfer
For the Microsoft platform, users can create and manage IBM MQ with two options:
- MQ Explorer GUI
- Running commands from command window or application.
For installing the MQ Explorer GUI, you can refer to this link and for installing the server using msiexec you can go to this link.
BizTalk Server and IBM MQ
As a middleware product, BizTalk Server can also connect to IBM MQ. For using IBM MQ with BizTalk Server, there are two adapters available.
- MQSeries Client (MQSC) Adapter
- MQSeries Adapter
MQSeries Client (MQSC) Adapter
The MQSC Adapter is available in the BizTalk Adapter for Host Systems installation that is part of Host Integration Server(HIS). This adapter is a light weight component of MQ that doesn’t require the MQSeries Queue Manager run-time code to reside on a client system. This adapter helps to connect IBM MQ queue manager on Windows and non-Windows platform. Using the MQSeries Client Adapter can do the following actions:
- Send and receive messages from local Queue, MQSeries Remote Queue, Transmission Queue, and Alias queue from BizTalk Server
- Connect Remote queue manager that reside on Windows platform or another platform directly from BizTalk server
- It Support Clustered MQSeries Queue Manager and clustered BizTalk servers
- It provides support Secure Socket Layer(SSL) for secure communication with MQSeries Queue Manager
MQSC Adapter Configuration
In a real-time scenario, the setup would be the following when using two servers
|
Server 1 (Windows)
|
Server 2 (Windows/Non-Windows)
|
|
BizTalk Server
|
WebSphere MQ
|
|
MQSC Adapter
|
|
|
WebSphere MQ Client (available from IBM)
|
|
If you want to use the WebSphere MQ Extended transactional client, you can use WebSphere MQ Client in Server 1.
MQSeries Adapter
MQSeries adapter requires IBM MQSeries Server for Windows to reside on the client system to communicate with an IBM WebSphere Queue Manager running on Windows or non-Windows. MQSeries comes with BizTalk Server installation. This adapter uses the MQSAgent2 COM+ application to put/get messages into the IBM MQ Queue Manager. Using the MQSeries Adapter can do the following actions:
- Send and Receive messages from local Queues, MQSeries Remote Queues, Transmission Queues, and Alias queues from BizTalk Server
- Send and Receive messages from MQSeries Server for Windows. You need to deploy one copy of MQSAgent (COM+ of the adapter) to support BizTalk server installation
- Dynamically create queues at runtime
- Request for Delivery of transactional and non-transactional messages for send and receive
- Dynamically receive messages from queues based on MQSeries MatchOptions
MQSeries Adapter Configuration
IBM MQ can be installed in multiple different configurations. Below you find an overview of which components need to be installed in case IBM MQ will be installed on one, two or three servers.
For configuring the MQSeries Adapter on a single Server:
|
Server 1 (Windows)
|
|
BizTalk Server
|
|
MQSeries Adapter
|
|
MQSAgent2 COM+ Application
|
|
WebSphere MQ
|
And for the configuring it in two servers:
Case 1 – Installation while combining Windows and Non-Windows servers
|
Server 1 (Windows)
|
Server 2 (Windows/Non-Windows)
|
|
BizTalk Server
|
WebSphere MQ
|
|
MQSeries Adapter
|
|
|
MQSAgent2 COM+ application
|
|
|
MQSeries Server for windows
|
|
Case 2 – Installation on 2 Windows servers
|
Server 1 (Windows)
|
Server 2 (Windows)
|
|
BizTalk server
|
MQSAgent2 COM+ application
|
|
MQSeries adapter
|
WebSphere MQ
|
If you want to configure MQSeries Adapter on three servers, the configuration would be as follows:
|
Server 1 (Windows)
|
Server 2 (Windows)
|
Server 3 (Windows/Non-Windows)
|
|
BizTalk Server
|
MQSAgent2 COM+ Application
|
WebSphere MQ
|
|
MQSeries Adapter
|
MQSeries Server for windows (Available from IBM)
|
|
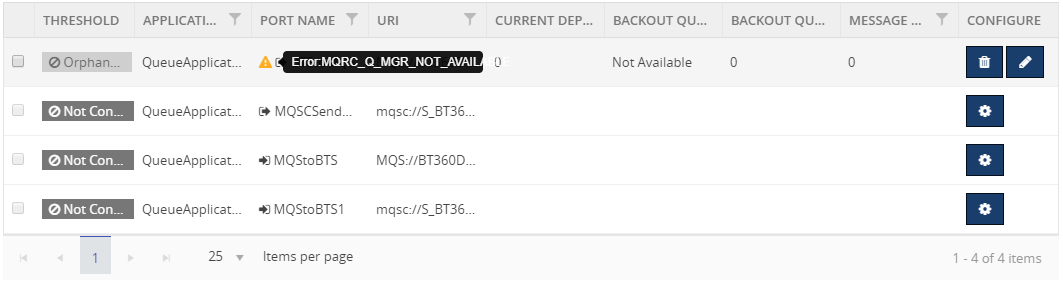
Monitoring IBM MQ with BizTalk360
BizTalk360 has the capability to monitor the IBM MQ Queues that are configured with the receive location and send ports mapped with either MQSeries Client Adapter or MQSeries Adapter. BizTalk360 has the following requirements:
- Monitor the accessibility of the queue manager and queues
- Monitor the growth of queues and corresponding backout queue
- Identify the backout queues automatically and start monitoring them
You can refer to this link for an article about how to configure an IMB MQ queue for monitoring with BizTalk360.
Errors while connecting from BizTalk360 to IBM MQ
Customer might face errors or technical challenges while configuring BizTalk360 to monitor IBM MQ queues. Some of the error codes are:
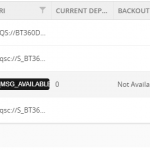
- 2033 – MQRC_NO_MSG_AVAILABLE
- 2035 – MQRC_NOT_AUTHORIZED
- 2059 – MQRC_Q_MGR_NOT_AVAILABLE
- 2538 – MQRC_HOST_NOT_AVAILABLE
We can see the details about the errors and resolution:
MQRC_NO_MSG_AVAILABLE – 2033
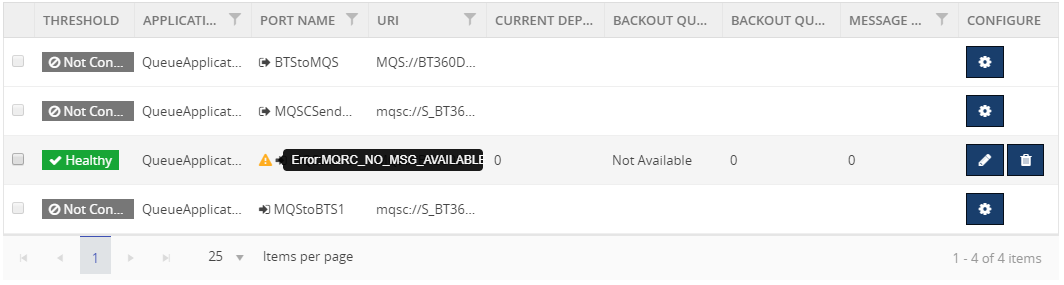
Reason: There is no message on the queue
Resolution: This is an expected condition; no corrective action is required.
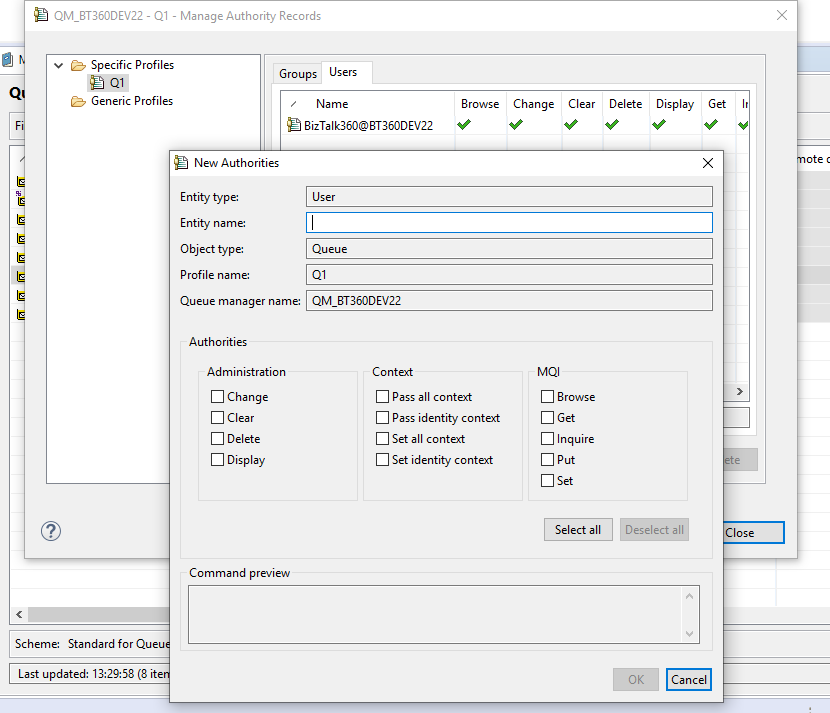
MQRC_NOT_AUTHORIZED – 2035
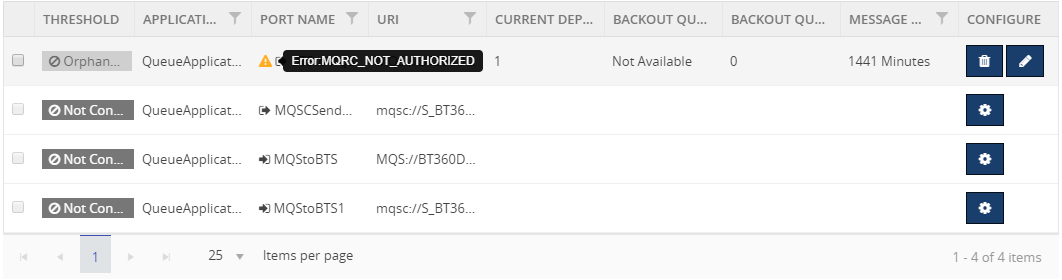
Reason: Trying to open a queue in a cluster
Resolution: create a local alias to the cluster queue, or authorize all users to have access to the transmission queue
Provide object authorities in the queue level or queue manager level to the user in the MQ Explorer.
MQRC_Q_MGR_NOT_AVAILABLE – 2059
Reason:
- The default queue manager is not running
- The MQ listener program associated with the default queue manager is not running
- The default queue manager is not defined on the local system
Resolution:
- Determine the name of the queue manager
- Verify that the queue manager exists on the local machine, and that it is running
- Verify that the listener program is running
- Verify that queue manager trying to connect is the default queue manager
- If necessary, make queue manager as the default queue manager
MQRC_HOST_NOT_AVAILABLE – 2538
Connect to a queue manager but the attempt to allocate a conversation to the remote system failed.

Reason:
- The listener has not been started on the remote system
- The connection name in the client channel definition is incorrect
- The network is currently unavailable
- A firewall blocking the port, or protocol-specific traffic
- The security call initializing the IBM MQ client is blocked by a security exit on the SVRCONN channel at the server
Resolution: Examine the client error log for messages explaining the cause of the problem
Here is the link of list of error codes while using IBM MQ.
Hope you found this article helpful. If you have any feedback or suggestions, please add it in our feedback portal. You can get started with monitoring IBM MQ by downloading the 30-day free trial of BizTalk360.
by Raja Sreenivasan | Oct 11, 2018 | BizTalk Community Blogs via Syndication
Introduction
SFTP (SSH File Transfer Protocol also known as Secure File Transfer Protocol) is a secure file transferring protocol between two remote systems, which runs over Secure Shell protocol (SSH). It provides strong authentication and secure encrypted data communication between two computers, which are connecting over an insecure network. It was designed by the Internet Engineering Task Force (IETF) as a secure extension. SSH provides the secure file transfer capabilities.
In this article, we will explain how to configure SFTP, how to use it with BizTalk Server and how you can set up monitoring SFTP using BizTalk360.
Contents
- How to Configure SFTP
- Types of authentication available in SFTP
- Using SFTP in BizTalk Server
- Monitoring SFTP using BizTalk360 Application
How to Configure SFTP
SFTP has replaced legacy FTP (File Transfer Protocol) and FTP/S and it provides all the functionality offered by these protocols, but the protocol is more secure and reliable. Also, configuration is easier.
Following are the steps to configure SFTP:
- Download the OpenSSH for server using OpenSSH for Windows binaries (Packages OpenSSH-Win64.zip or OpenSSH-Win32.zip)
Link: https://github.com/PowerShell/Win32-OpenSSH/releases
- Extract the package in folder location ‘C:Program Files’ as an administrator and install the SSH and SSHD services using the following command:
exe -Execution Policy Bypass -File install-sshd.psl
- Once you have run the above command, the SSH server and server agent will install the system and start the service in the services.msc
The SFTP port number for the SSH port is 22, basically just an SSH Server. Once the user has logged in to the server using SSH, the SFTP protocol can be initiated. There is no separate SFTP port exposed on the servers. There is also no need to configure another rule into the firewalls.
Once the command is executed in PowerShell, the rule is created in the firewall section.
Using Public Keys for SSH Authentication
One effective way of securing SSH access to the server, is to use a Public/Private Key pair. This means that the generated key pair, consists of a public key (allowed to know) and a private key (keep secret and don’t give to anybody). The private key can generate a Signature and cannot be forged for anybody who doesn’t have that key. But using the public key, anybody can verify that a signature is genuine. The public key is placed on the server and a private key is placed on local workstation. Using a key pair, it becomes impossible for someone to log in by using just a password, in case you have set up SSH to deny password-based authentication.
Create the .ssh directory in a local folder and create a file named as “authorized_keys”, where we store the public key for authentication.
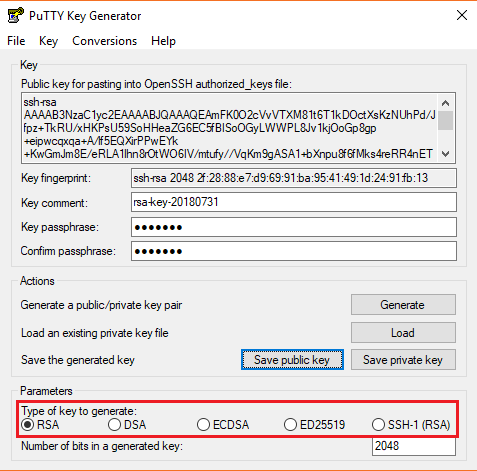
Generating Keys
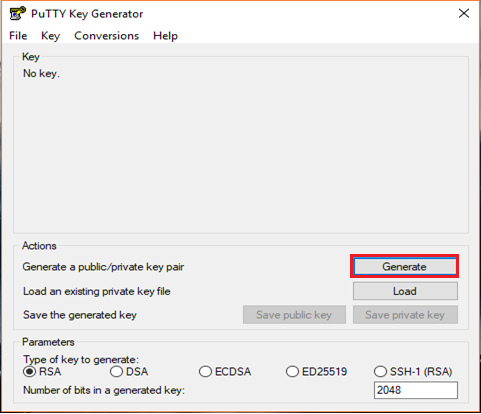
PuTTYgen is a key generator. It generates pairs of public and private keys. When you run the PuTTYgen, you will see a window where you have two choices:
- Generate – to generate a new Public/Private key pair
- Load – to load an existing private key
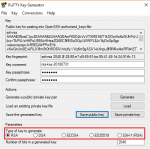
Before generating a key pair, using PuTTYgen, you need to select which type of key you need.
PuTTYgen currently supports the following type of keys:
- An RSA key for use with the SSH-1 protocol
- An RSA key for use with the SSH-2 protocol
- A DSA key for use with the SSH-2 protocol
- An ECDSA (Elliptic Curve DSA) key for use with the SSH-2 protocol
- An Ed25519 key (another elliptic curve algorithm) for use with the SSH-2 protocol
Here, we will generate a RSA key, for use with the SSH-1 Protocol.
- Download the PuTTYgen from the web site
- Launch the program and click “Generate” button. The program generates the keys for you
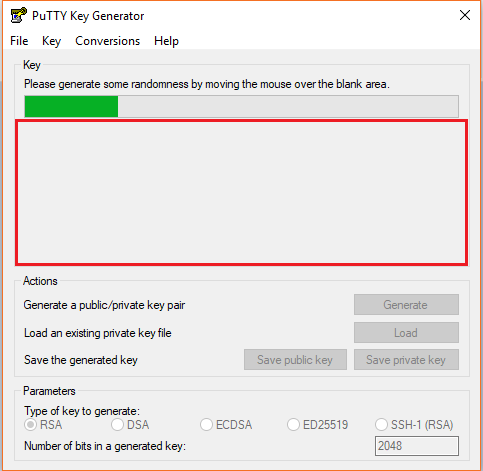
- Once you click the Generate button, you must generate some randomness, by moving the mouse over the blank area
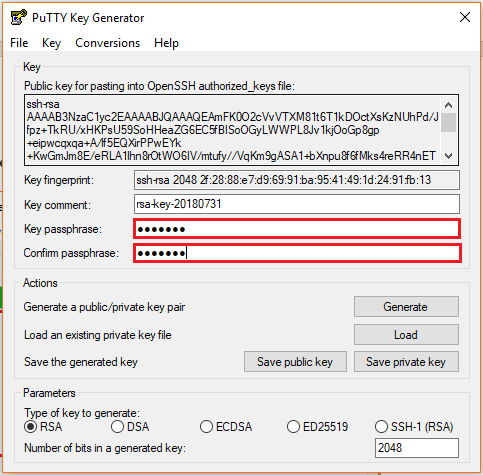
- Enter the unique Key passphrase and Confirm passphrase fields
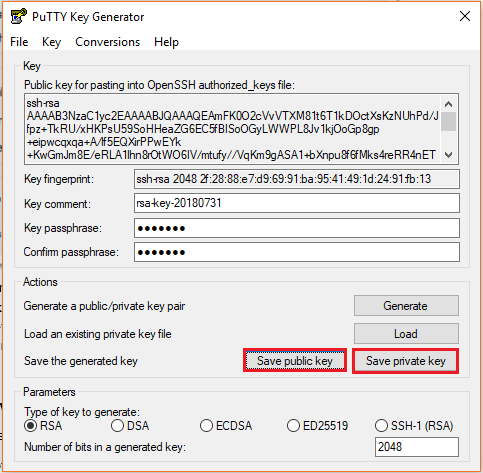
- Save the public and private keys, by clicking Save Public Key and Save Private Key buttons
- From the Public Key, for pasting it into the OpenSSH authorized_keys file field at the top of the window, copy all the text (starting with ssh-rsa). The copied key must be pasted either into the public key tool, in the Control Panel, or directly into the authorized keys file on your server.
Using SFTP Adapter in BizTalk Server
BizTalk Server provides the SFTP adapter to send and receive a file from a secure FTP server using the SSH file transfer protocol. Let’s see how can configure the SFTP adapter for receiving and sending a file from the secure server.
- In the BizTalk Admin Console, create a SFTP Receive Port in the BizTalk application where you want to have it
- Create a Receive Location within that Receive Port
- Select the Transport Type as SFTP from the drop-down list
In the Properties section, configure the following steps:
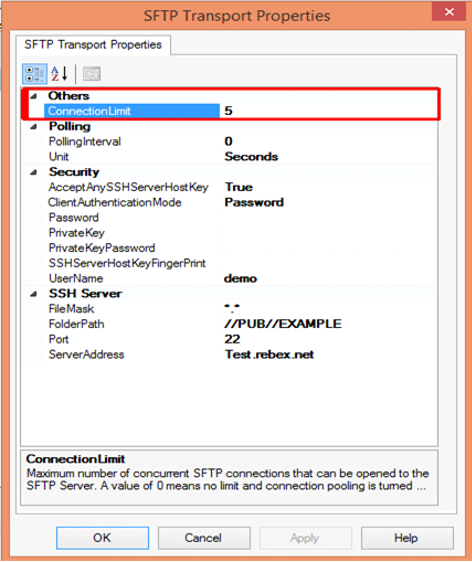
Others
- Connection Limit – Specify the maximum number of concurrent connections that can be opened to the server
Polling
- Polling Interval – Specify the interval at which the adapter polls the server. To poll continuously, set this value to zero
Default Value: 5
- Unit – Specifies the unit in which the polling interval is specified. For example: Seconds, Minutes, Hours or Days
Security
- Accept Any SSH Server Host key – When the option is set as True, SSH will accept the connection from the host server; when it is set as False, the Receive Location uses the fingerprint of the server for authentication. For the authentication, you need to provide the finger print in the SSHServerHostKeyFingerPrint field.
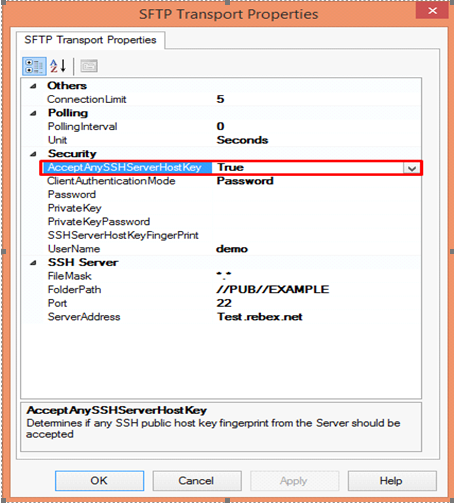
There are three client authentication methods:
- Password
- PublicKeyAuthentication
- MultiFactorAuthentication
Password authentication mode is simply providing the password in the console for authenticating the client. For the PublicKeyAuthentication, you must provide the private key file in the PrivateKey field and provide the passphrase in the PrivateKeyPassword for authenticating.
For MultiFactorAuthentication, the user must provide the user name, password and Privatekey. If the private key is protected by a passphrase, you also need to provide that in the privatekeyPassword field.
- Password – Specify the password, if you have set the ClientAuthentication mode to password
- Private Key – Specify the private key for the SFTP user, if you have set the ClientAuthenticationMode to Publickeyauthentication
- Private Key Password – Specify the passphrase key to validate the private key
- SSH Server Host Key Fingerprint – It specifies the fingerprint of the public host key for the SSH server
- Username – Specifies a username to log on to the SFTP server
SSH Server
- File Mask – Specifies the file mask to use when retrieving files from a secure SFTP server
- Folder path – Specifies the folder path on the secure SFTP server from where the Receive Location can retrieve files
- Port – Specifies the port address for the secure SFTP server on which the file transfer takes place
- Server Address – Specifies the server name or IP address of the secure SFTP server
Configuring the Send Port
For Configuring the Send Port, create a Send Port or double click an existing send port to modify it in an application in the BizTalk Administration Console.
- On the General Tab, Choose the type of SFTP artifact in the transport section and click the configuration button.
- In the SFTP Transport Properties window configure the following options based on requirement
Others
- Connection Limit – Maximum number of concurrent connections that can be opened to the server
- Log – Creating client-side log file to trouble shoot any errors. Enter the full path for creating the log file and its available from BizTalk Server 2016
- Temporary Folder – A temporary folder on the SFTP server to upload large files before automatically moved to the required location on the same server and its available from BizTalk server 2013 R2
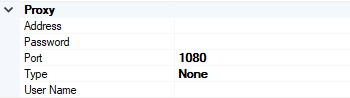
Proxy
- Address –Specifies either DNS or IP Address of the Proxy server
- Password –Specifies the Password of the proxy server
- Port – Specifies the port of the Proxy Server
- Type – Specifies the protocol used by the proxy server
- User Name – Specifies the User Name of the Proxy server
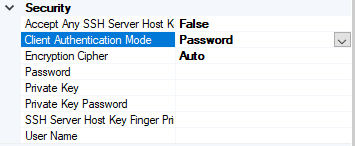
Security
- Access Any SSH Server Host Key – When True, the send port accept any SSH Public host key from the server and if set as false, the port matches the host key with the key specified in the SSHServerHostKey
- Client Authentication Mode – Specifies the authentication method that the send port uses for authenticating the client to the SSH Server.
Three modes of authentication
- Password – If set as Password , you must provide the password in the Password Property
- PublicKeyAuthentication – if set as PublicKeyAuthentication, you must provide the private key of the user in the PrivateKey
- MultiFactorAuthentication – if set as MultiFactorAuthentication, you must provide UserName with its Password. If the private key is protected by a password, provide the password in the PrivateKeyPassword as well
- EncryptionCipher – Provide the kind of encryption cipher and available from BizTalk Server 2013 R2. Options are Auto, AES and TripleDES in the BizTalk Server 2013 R2 and for the BizTalk Server 2016 Auto, AES, Arcfour, Blowfish, TripleDES, and
- Password – Specify the SFTP user password if you set the ClientAuthenticationMode to Password
- Private Key – Specify the private key for the SFTP user if you set the ClientAuthenticationMode to PublicKeyAuthentication
- Private Key Password – Specify a private key password, if required for the key specified in the PrivateKey
- SSH Server Host Key Finger Print – Specifies the fingerprint of the server used by the adapter to authenticate the server if the AccessAnySSHServerHostKey property is set to False. If the fingerprints do not match, the connection fails.
- User Name – Specifies the username for the secure FTP Server
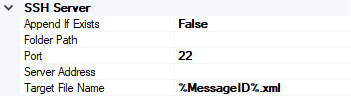
SSH Server
- Append If Exist – if the file being transferred to the secure FTP server already exists at the destination, this property specifies whether the data from the file being transferred should be appended to the existing file. If set to True, the data is appended. If set to False, the file at the destination server is overwritten
- Folder Path – Specifies the folder path on the secure FTP server where the file is copied
- Port – Specifies the port address for the secure FTP server on which the file transfer takes place
- Server Address – Specifies the server name or IP address of the secure FTP server
- Target File Name – Specifies the name with which the file is transferred to the secure FTP server. You can also use macros for the target file name
- Click Apply and OK again to save settings
Monitor the SFTP Location using BizTalk360
From the v8.4, under File Location in the Monitoring section, BizTalk360 has the capability to monitor SFTP servers. File Location Monitoring will list all the locations configured in the BizTalk artifacts (Send Ports and Receive Locations) for the SFTP Transport type. This helps users to easily monitor all the SFTP locations mapped within the Receive Locations/Send Ports.
It contains four sections:
- SSH Server Section has the details about the SFTP Location
- The Proxy Details Section is optional to connect to a SFTP Server behind a firewall
Note: In BizTalk, Proxy details are available from BizTalk 2013 R2
- Security Details Section has the authentication details
- In the SFTP Monitoring Config Section, you can configure the monitor with threshold conditions for the metric File Count
Based on the need, you can monitor the location with threshold conditions. If the specific condition is met, the user gets notified through an email, a SMS or another communication channel.
For monitoring the SFTP server, BizTalk360 uses the third-party tool nSoftware. Using the nSoftware IPWorks SSH product, BizTalk360 connects to the secure server with Private Keys and password for monitoring the location.
For monitoring the SFTP in BizTalk360 you can refer the knowledge base in this link.
See below, some code snippets for connecting to the secure server using nSoftware.
Password Authentication
sftp.SSHUser = “test”;
sftp.SSHPassword = “password”;
sftp.SSHPort = 22;
sftp.SSHHost = “SSHHost”;
sftp.Config(“SSHAcceptServerHostKeyFingerPrint=6a:d3:65:96:d1:9f:9d:f9:57:4e:6b:3b:11:57:5a:15”);
sftp.SSHLogon(sftp.SSHHost, sftp.SSHPort);
Console.WriteLine(“Authenticated”);
sftp.SSHLogoff();
Public key Authentication
sftp.SSHUser = "test";
sftp.SSHCert = new Certificate(CertStoreTypes.cstPPKKeyFile, "....filesserver_cert.pem", "test", "*");
sftp.SSHAuthMode = SftpSSHAuthModes.amPublicKey;
sftp.SSHPort = 22;
sftp.SSHHost = "SSHHost";
sftp.Config("SSHAcceptServerHostKeyFingerPrint=6a:d3:65:96:d1:9f:9d:f9:57:4e:6b:3b:11:57:5a:15");
sftp.SSHLogon(sftp.SSHHost, sftp.SSHPort);
Console.WriteLine("Authenticated");
sftp.SSHLogoff()
Conclusion
This article demonstrates the creation of a SFTP Server. Using the SFTP server in BizTalk Receive Locations and Send Ports, you can send files securely  and monitor the SFTP server using BizTalk360.

If you have any feedback or suggestions, please write to us at support@biztalk360.com.
by Raja Sreenivasan | Aug 7, 2018 | BizTalk Community Blogs via Syndication
Recently Microsoft rolled out the July 2018 .NET Framework Security Updates. These Security Updates caused series of errors in the BizTalk Server Administration Console, SharePoint, Internet Information Server (IIS) with classic ASP and .NET applications which use impersonation.
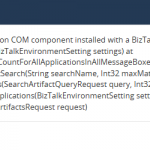
Related to BizTalk Server, the issue is that BizTalk server relies on a COM component, that runs with restricted permissions. This COM component may fail to start after installing the July 2018 Security Updates.
For BizTalk360 to monitor the BizTalk server, it needs that the BizTalk Server Administrator components are installed in the server. But when the BizTalk360 server is also updated with the security patches, the same errors will occur while accessing the BizTalk applications and their artifacts. Many of our customers raised support tickets to BizTalk360 support channel, as they were not aware of these issues due to the windows security patch.
How the errors occur in BizTalk360 and in BizTalk Server
The com exception will occur in BizTalk360 only after the July 2018 security patch update is installed on the servers. The issue will pop up on many occasions as mentioned below.
While accessing,
- BizTalk360 application
- BizTalk Applications and their artifacts
- Hosts and Host Instances
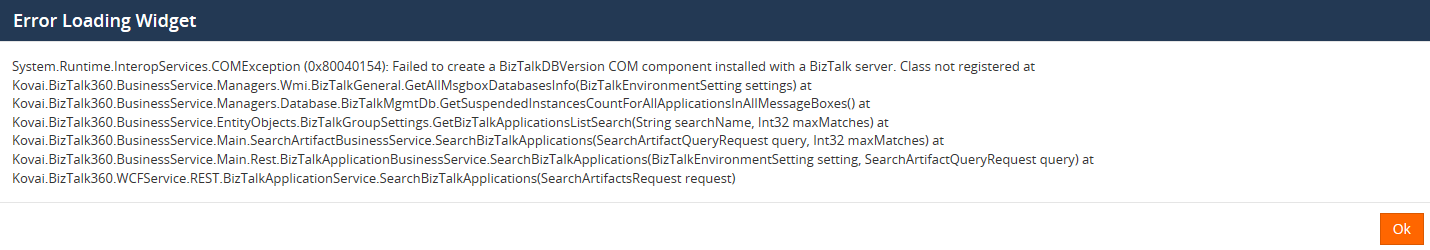
Following screenshot refers, how the exception appears in BizTalk360.
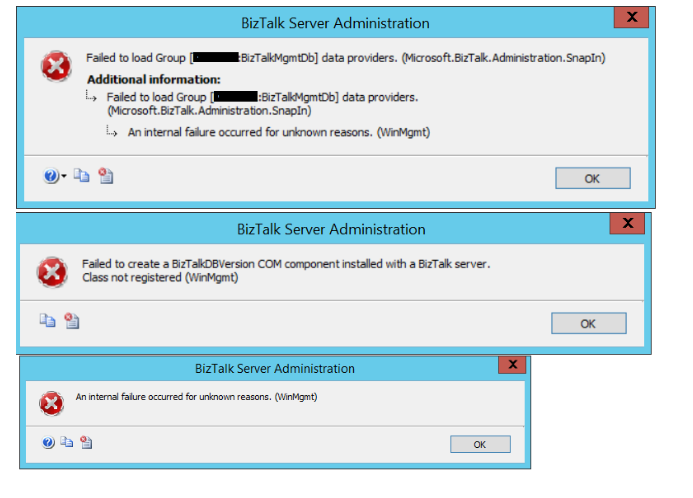
When launching BizTalk Server, a series of errors appear from Hosts and Host Instances.
Here are the errors that occurred in the BizTalk Admin console, When trying to access the host instance
Root Cause of the problem
Let ’s have a look at the root cause of these issues in detail. The Microsoft .NET Framework runtime uses the process token to determine whether the process is running within an elevated security context. These system calls can fail if the required process inspection permissions are not present. This causes an “access denied” error. However, these errors might reveal themselves with other error messages, as we have seen from the screen prints earlier in this article.
A temporary workaround is discussed in this MSDN thread. The simplest workaround is to uninstall the security patch and everything will be back to normal.
Resolution
The latest patch was re-released by Microsoft on July 30, 2018. This update helps to resolve this issue. This patch has different versions applicable to your operating system and .NET Framework installed.
- 4346877Update for Windows 10, version 1607 and Windows Server 2016: July 30, 2018
- 4346406Update for .NET Framework 4.6, 4.6.1, 4.6.2, 4.7, 4.7.1 and 4.7.2 on Windows 8.1, RT 8.1 and Server 2012 R2 (KB 4346406): July 30, 2018
- 4346405Update for .NET Framework 4.6, 4.6.1, 4.6.2, 4.7, 4.7.1 and 4.7.2 on Windows Server 2012 (KB 4346405): July 30, 2018
- 4346407Update for .NET Framework 4.6, 4.6.1, 4.6.2, 4.7, 4.7.1 and 4.7.2 on Windows 7 SP1 and Server 2008 R2 SP1 and .NET Framework 4.6 on Server 2008 SP2 (KB 4346407): July 30, 2018
- 4346408Update for .NET Framework 4.5.2 on Windows 8.1, RT 8.1 and Server 2012 R2 (KB 4346408): July 30, 2018
For detailed information about latest patch release, please click this link. Microsoft had also suggested a workaround for the issue but with the following warning message:
Warning: The workarounds may make a computer or a network more vulnerable to attack by malicious users or by malicious software such as viruses. We do not recommend these workarounds. However, we are providing this information so that you can implement the workarounds at your own discretion. Use these workarounds at your own risk.
Customer Feedback
We have received quite a few support tickets on this specific cases from our customers who have recently update the security patches. Because, the problem lies with BizTalk Server, It has affected the BizTalk360 as well while accessing the applications. We informed the customers about the reason for the error. The new patches are uninstalled, BizTalk360 and BizTalk Server will be back to normal. Here is a happy feedback from our most valued customers.

by Raja Sreenivasan | Jul 27, 2017 | BizTalk Community Blogs via Syndication
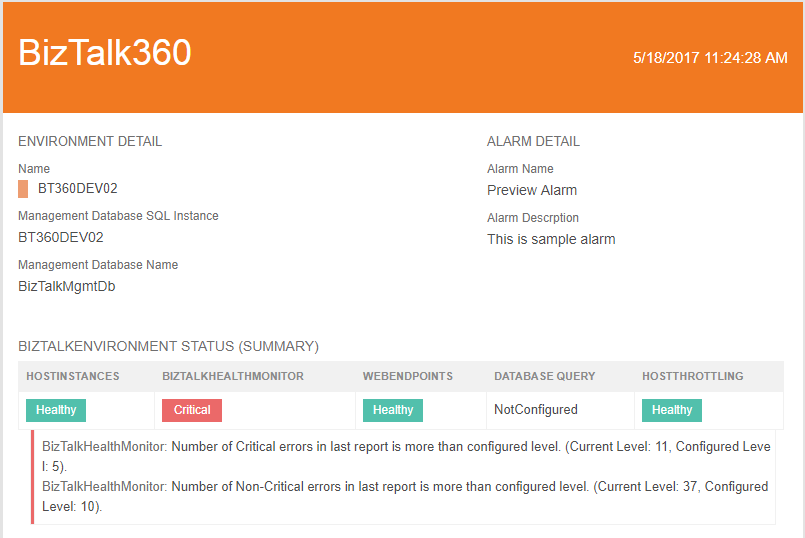
With this release of BizTalk360(v8.5), the user can customize email template. The earlier version of BizTalk360 only has a capability to change the color of the email body, font, logo, background, footer background etc. Most of our customer had requested to customize the email alert with more comprehensive improvements, so we have revamped the email template module with more additional functionalities to simplify and customize the email notification. This allows to create and manage custom templates for notifications.
The user can able to create a template with an in-built XSLT validator with preview options. Email template can be used in different alarms with light or dark theme, which helps to
• grab the support team’s attention to take on the relevant actions.
• choose different theme templates to indicate different business cases.
• easily identify which template belongs to which environment.
So, let’s us look how to create a template in the newer version of BizTalk360.
Creating Template
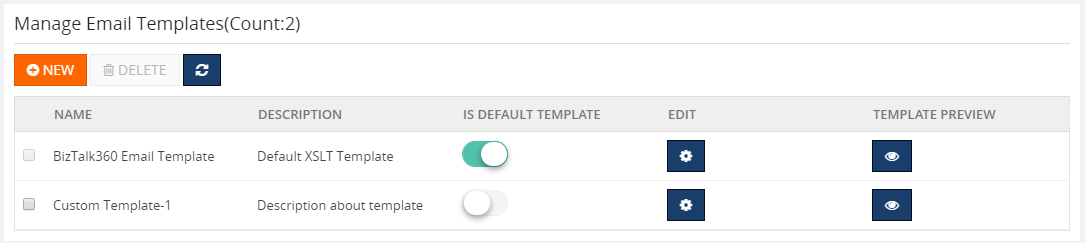
In BizTalk360, Manage Email Template can be found in the monitoring and notification section of setting side. While installing the newer version, the default template “BizTalk360 Email Template” will be used for all the existing or newly created alarm.
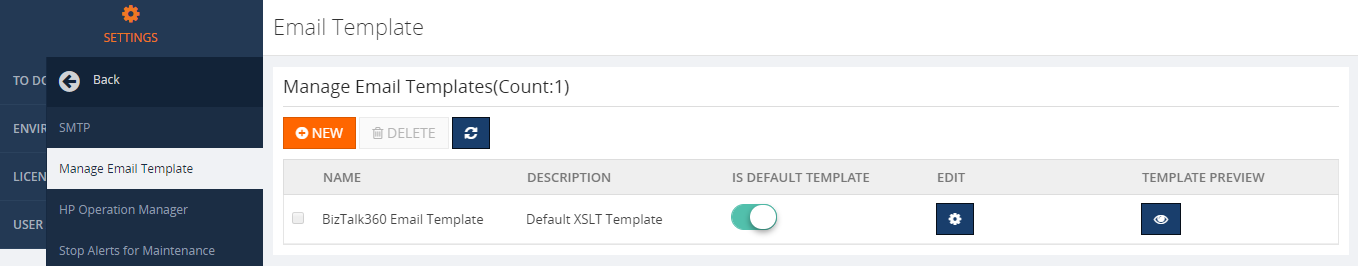
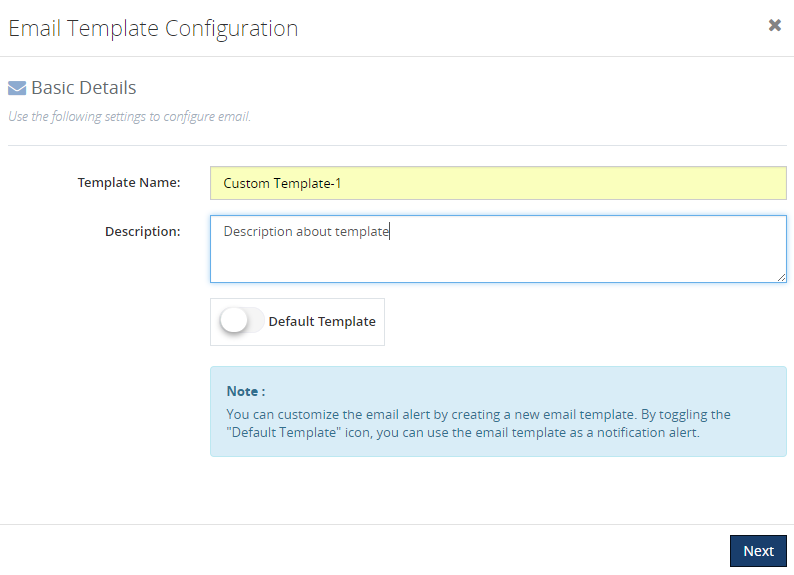
For creating a new template, click on “NEW” icons as shown in above picture, a blade opens for providing the basic details like template name, description of the template, toggle button for making it as default template as shown in the picture below.
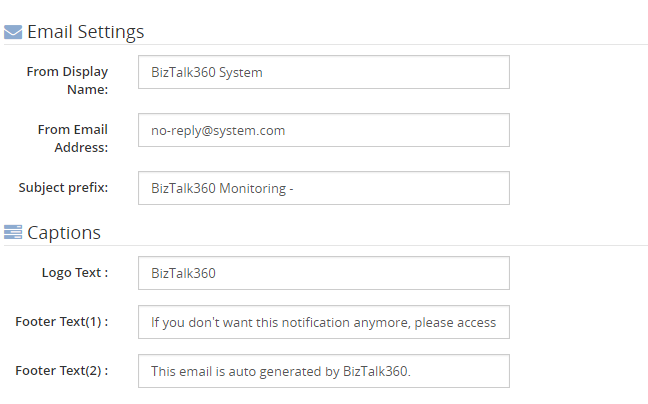
In the following section, the user can edit and provide their own data like display name, email address, logo text, footer text etc.same as previous versions for a better manageability.
Theme
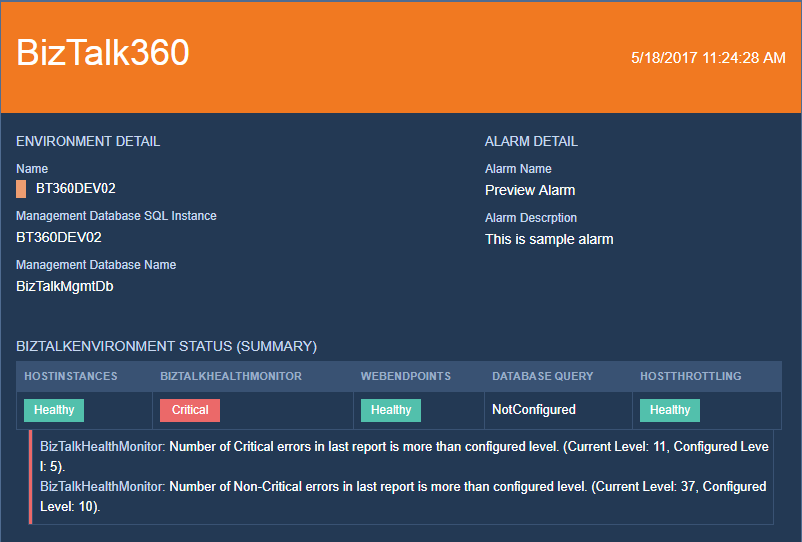
Initially, BizTalk360 provides a default template “BizTalk360 Email Template” with a light elegant theme. Themes are also available in two variants light and dark. A user can able to choose light or dark theme while creating a template.
However, the earlier version of BizTalk360 email colors are chosen by selecting colors from color picker and here we came up with the idea of providing “themes” instead of simply selecting the color code for the email template.
We categorized themes into two
• Light Theme
• Dark Theme
Light Theme
Dark Theme
We are not restricting the user to simply selecting light or dark theme, we have also provisioned to edit the themes.
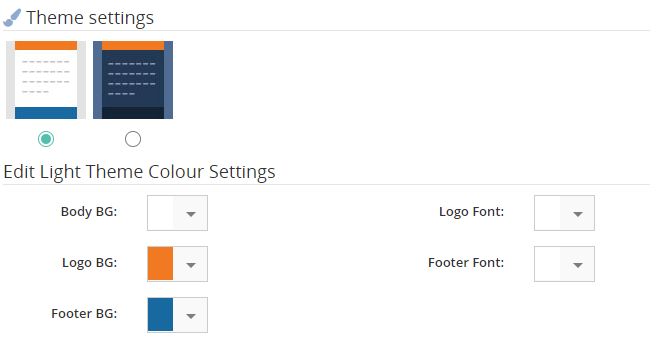
Under the edit theme color settings, a user can choose 6 Body BG color which represents different themes for light and dark. Once the theme is selected, “PREVIEW TEMPLATE” option is being provided to cross check the desired changes on a new blade.
Once the template is created, it will be displayed in the main grid of Manage Email Templates page.
XSLT
BizTalk360 uses XSLT (eXtensible Stylesheet Language Transformations) as a styling language for customizing the email template. The XSLT file editing option is being provided to a user for changing font family and font size. “Please do not change any logic in XSLT file, as this might corrupt the mailing functionality”. This facility is available in the edit section of each template by clicking the edit gear icon.
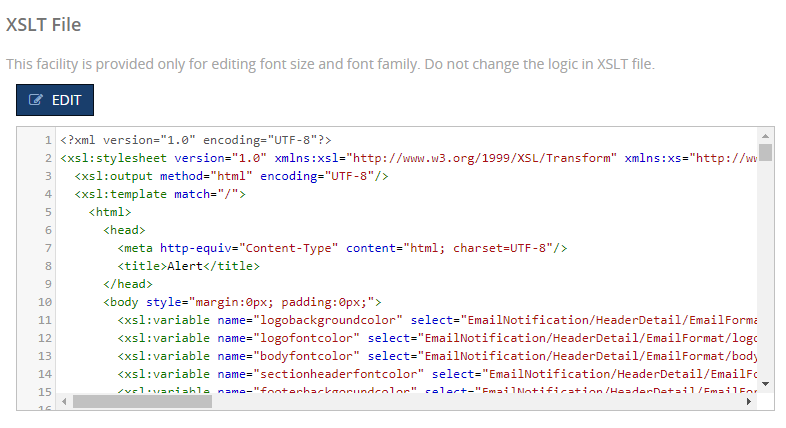
Once the changes are made in the XSLT file, the inbuilt XSLT validator verifies the XSLT file and allows the user to save the file after successful verification.
The “Preview Template” option is provided in edit section to make sure the desired changes have been made in XSLT file.
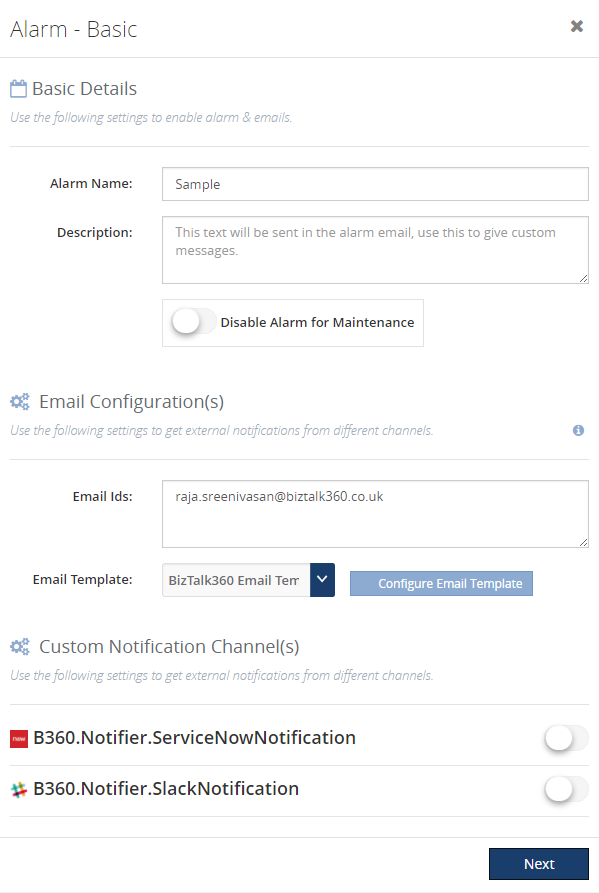
Alarm Configuration
In the alarm configuration section, we have customized for a user-friendliness to choose the template that has been created at the manage email module. Also, we made the notification channel to be available in the Alarm configuration page itself. We have made the email configuration optional if the notification channel is being enabled so that either one of the choices can serve the purpose.
Conclusion
BizTalk360 already had a feature to format email template, with its latest release v8.5 it fills the gap by adding the ability to customize, create and manage template for different alarms based on user preference. Keep your mailing color codes intact with your thoughts using our customized email template feature. If you have any feedback or suggestion, please feel free to write to us at support@biztalk360.com.