
by Lex Hegt | Feb 7, 2018 | BizTalk Community Blogs via Syndication

This blog is a part of the series of blog articles we are publishing on the topic “Why we built XYZ feature in BizTalk360”. Read the main article here.
Why do we need this feature?
Azure API Apps is a modern way of building web services hosted in Microsoft Azure. Out of the box it provides capabilities such as security, load balancing, auto-scaling, and automated management. You can also take advantage of its DevOps capabilities such as continuous deployment from VSTS, GitHub, Docker Hub, and other sources, package management, staging environments, custom domain, and SSL certificates.
In the context of Azure Logic Apps connectors, Azure API Apps plays a vital role. Sometimes there may not be an out of the box connector to an external system and you may need to wrap a web service on top of that external system to create a custom Azure Logic Apps connector. This article explains how you can easily Create a custom connector for a web API.
The Azure API App can contain multiple endpoints to be able to perform multiple actions like creating an order or requesting the status of an order.
The Azure API Apps are powerful building blocks for your hybrid integration scenarios. As these API Apps can be of critical importance, you should be well aware of the status of these API Apps.
What are the current challenges?
We have already seen why Azure API Apps are important building blocks and can be of vital importance for your integration scenarios. So, whether you are consuming the external Azure API Apps from other parties or you are exposing your own API Apps, depending on the importance of the Azure API App, it is equally important to constantly be aware of the state of the Azure API Apps and their endpoints.
The main challenge at the moment is the management and monitoring of Azure API Apps in isolation via the Azure Portal. You’ll miss the end to end context of the importance of the API App in your integration scenario.
For example, you might have an order processing system that uses few BizTalk Receive Locations, Orchestrations, Send Ports and few Azure API Apps connected via BizTalk WCF-REST/HTTP adapters and are part of the same end-to-end solution. If the Azure API App is down or returning errors, then your end-to-end purchase order solution is broken. It’s important to monitor the API Apps and understand the end to end context.
We address this challenge in BizTalk360 by providing a unified platform to monitor and manage both BizTalk artifacts and some of the key Azure artifacts which are important from the integration point of view.
How BizTalk360 solves this problem?
Depending on whether you want to monitor your own Azure API Apps or the API Apps which are exposed by others, BizTalk360 offers multiple methods to setup monitoring. This is due to the fact that to be able to monitor whether API Apps are enabled, you need access to the Azure subscription which contains these API Apps. In case of API Apps which are exposed by others, you won’t have access to that Azure subscription, so you’ll only be able to monitor the HTTP Endpoints of the API Apps.
To monitor API Apps from within BizTalk360, the product offers the following features:
- Azure API App of others – Web Endpoint monitoring
- Your own Azure API Apps – Azure API App monitoring
Web Endpoint Monitoring
If you are simply consuming the Azure API Apps from external parties, then they are not any different from a standard REST/HTTP web services. In this case, the BizTalk360 web endpoints monitoring solution will be sufficient. The features and capabilities of BizTalk360 Web Endpoint monitoring are described in the Why did we build Web Endpoints Monitoring in BizTalk360? article.
Azure API Apps Monitoring
If you are owning the Azure API Apps, then BizTalk360 provides a rich set of capabilities to monitor the Azure API Apps like auto-discovery of multiple endpoints and granular control on monitoring setup.
Monitoring API Apps from BizTalk360 consists of the following types of monitoring:
- State Monitoring – monitor whether the API Apps are Enabled/Disabled
- Endpoint Monitoring – monitor if the HTTP Endpoints of the API App are accessible
State Monitoring API Apps
From BizTalk360, you can monitor the state of API Apps. An API App can have the following 2 states:
- Enabled – the API App is active and can receive requests
- Disabled – the API App is disabled and cannot receive requests
With BizTalk360, you can monitor for both states and of course, we want to provide a monitoring experience which as seamless as possible. After you have selected the correct alarm and Azure subscription, it is just a matter of selecting the Azure API Apps and select the required expected state from the drop-down box. Once that’s done, BizTalk360 immediately starts to monitor the API App(s).
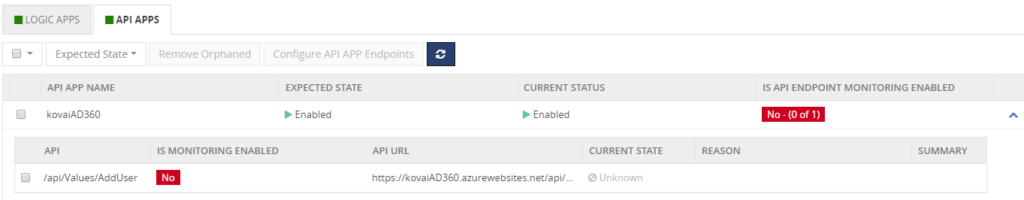 Endpoint Monitoring
Azure API Apps basically are REST services which use JSON for data exchange. These REST services are the actual endpoints of the API Apps, which can be called by other systems. Each Azure API App has at least one endpoint but can contain many more endpoints.
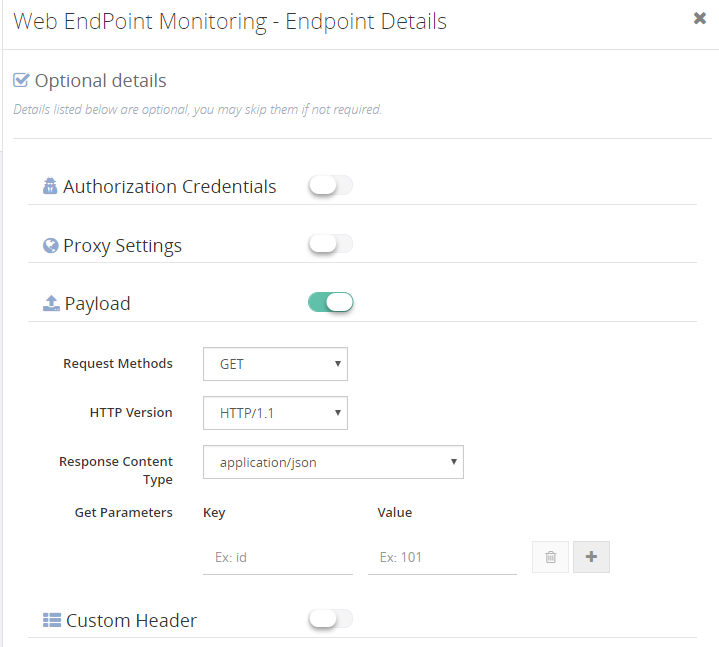
BizTalk360 has a quite extended feature set for Web Endpoint Monitoring, and it comes with advanced capabilities like adding custom GET parameters and HTTP headers:
- Custom GET parameters – provide required/optional parameters
- HTTP headers – provide additional HTTP headers (for example for authorization)
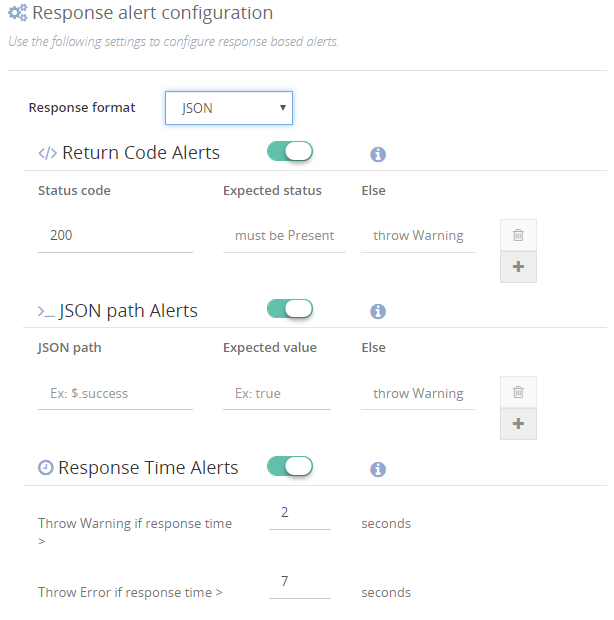
When the Endpoint sends a response, you can perform multiple checks to find out whether the Endpoint is in good health. You can check, for example:
- HTTP Return codes – like HTTP 200 must exist, else throw warning/error
- Existing and Non Existing keywords – like ‘success’ must exist in the response message
- Response times – if it takes longer than, say, 5 seconds before the response is received, something might be wrong
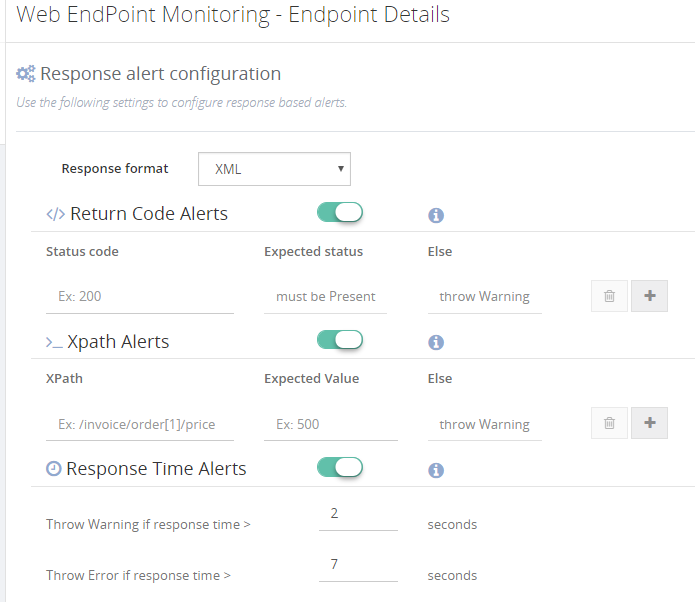
HTTP Return codes
You can add multiple monitoring rules for HTTP return codes. This allows you to check for the existence, but also the non-existence of certain HTTP return codes. Besides that, you can also determine whether a Warning or an Error will have to be thrown in case the monitoring rules have not been met.
Existing and Non-Existing keywords
This is a very strong capability, as it allows you to check whether certain keywords exist or do not exist. As the response message might be in different formats, BizTalk360 allows you to check for the following formats and throw a Warning/Error based on the outcome of the monitoring rule:
- Plain Text – search for keywords which should/should not exist
- XML – enter an XPath query and the expected value which should/should not exist
- JSON – enter an XPath query and the expected value which should/should not exist
For each format, you can search for just one keyword or multiple keywords to (not) exist.
Response times
Bad response times of endpoints might indicate that the endpoints (or the system/service behind it) are under stress. So monitoring on response times helps you to be aware of such situations.
As all of the above mentioned checks can be combined with each other, this provides very strong monitoring capabilities.
Multiple Azure Subscriptions
You might have multiple Azure subscriptions which contain different Azure API Apps. You can register all the relevant subscription and attach them to corresponding BizTalk Server environments within BizTalk360. This provides a seamless management/monitoring experience.
Conclusion
With Azure API Apps monitoring, we make it easy to constantly be aware of the well-being of your API Apps, without having to check that yourself manually. Besides monitoring whether the Azure API App is Enabled, we bring strong features for monitoring the actual HTTP endpoints.
You can read more about Azure API App monitoring and the other Azure services for which BizTalk360 provides support.
Get started with a Free Trial today!
If you want to monitor your Azure API Apps or have other BizTalk Monitoring related challenges, why not give BizTalk360 a try! It takes about 10 minutes to install on your BizTalk environments and you can witness and check the security and productivity of your own BizTalk Environments. Get started with the free 30 days trial.

Author: Lex Hegt
Lex Hegt works in the IT sector for more than 25 years, mainly in roles as developer and administrator. He works with BizTalk since BizTalk Server 2004. Currently he is a Technical Lead at BizTalk360. View all posts by Lex Hegt

by Lex Hegt | Feb 6, 2018 | BizTalk Community Blogs via Syndication

This blog is a part of the series of blog articles we are publishing on the topic “Why we built XYZ feature in BizTalk360”. Read the main article here.
Why do we need this feature?
Traditionally, a lot of system integration happened on-premise. When integration with partners or external systems was the need of the hour, this was achieved using SOAP/REST/HTTP/FTP/SFTP etc.
With the rise and adaption of cloud technologies like Amazon AWS and Microsoft Azure, cloud solutions became more and more capable to support scenarios where on-premise systems needed to interface to the on-premise systems of your partner(s) or with SaaS solutions like Office365 and SalesForce.
Microsoft is positioning Azure Logic Apps as the integration platform in the cloud mainly for connecting SaaS based solutions like Dynamics 365, Salesforce, ServiceNow, Workday etc.
Since the introduction of the Azure Logic Apps adapter for BizTalk Server 2016 and Azure Gateway, it is possible to integrate your on-premise systems via BizTalk Server with Azure Logic Apps seamlessly. This opens up great possibilities — it opens up some 300+ SaaS connectors that are available to Azure Logic Apps that can be utilized from BizTalk Server. Also, vice versa you can make the 100’s of external SaaS systems to talk to your on-premise BizTalk Server.
So it becomes very important to have a management/monitoring platform that’s capable of supporting both on-premise BizTalk Server and Azure Logic Apps from a single place.
What are the current challenges?
Azure Logic Apps provide a great way to extend your integration scenarios and capabilities to the cloud. However, from an operational and monitoring perspective, the Azure Portal is yet another portal the BizTalk Administrators need to be aware of and fit in their daily tasks.
So, besides their on-premises oriented BizTalk Server monitoring, organizations now also need to monitor their Hybrid solutions (which involve Azure Logic Apps) as events might occur they want to know about.
Think of, for example, somebody could have disabled your Azure Logic App (that’s part of your end-to-end integration scenario), which prevents the Azure Logic Apps from being executed. Also, executions of the Azure Logic Apps might fail or run very slow, indicating that some other system might be under stress.
As it would take too much time to regularly check this kind of scenarios to take place, an administrator just wants to be informed automatically when these kind of events occur. You can use some of the monitoring features of Azure Portal, but you’ll not get the end to end visibility and it will operate on silo without giving the full context.
How BizTalk360 solves this problem?
At BizTalk360, we are closely following the trends in the integration landscape. We can clearly spot the necessity of using Azure Logic Apps in enterprise integration scenario along with BizTalk Server.
Because of this, we brought the support for Azure Logic Apps with BizTalk360. In addition to Azure Logic Apps, we also support other relevant integration technologies in Azure like Azure Service Bus, Azure API Apps and Azure Integration Account with BizTalk360.
In this article, we will just focus on how you can monitor your Azure Logic Apps from BizTalk360. Azure Logic Apps Monitoring with BizTalk360 consists of the following two parts:
- State Monitoring – Monitor whether the Logic Apps are in the expected state
- Data Monitoring – Monitor whether the executions of Logic Apps take place as expected
State Monitoring of Logic Apps
A Logic App can have the following two states:
- Enabled – an instance of the Logic App can be started by means of a trigger
- Disabled – the Logic App cannot be instantiated by means of a trigger
Azure Logic Apps monitoring with BizTalk360 consists of checking whether the state of a Logic App reflects the Expected state. In most cases, a Logic App will have to be in the Enabled state, but there might be scenarios where you want to monitor for the Logic App to be in the Disabled state, which is often referred to as Negative Monitoring. BizTalk360 allows you to monitor for both states.
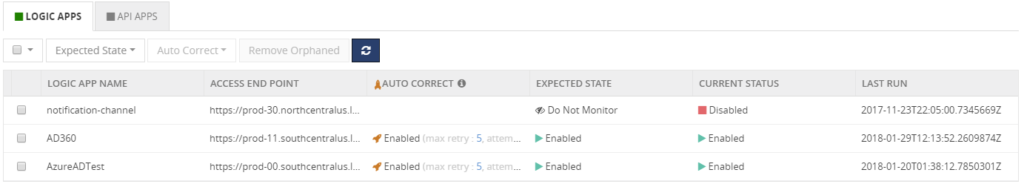
Auto Correct
BizTalk360 has developed the Auto Correct feature for state-bound artifact monitoring. The feature allows you to let BizTalk360 try to bring the state bound artifact back to the expected state, once the artifact gets into the undesired state. This feature exists for the following artifact types:
- Receive Locations, Orchestrations and Send Ports
- Host Instances
- Windows NT Services
- SQL Server jobs
- Logic Apps
As you can see from the list above, Azure Logic Apps monitoring can be decorated with Auto Correct. In case the Azure Logic App can’t be get back to the expected state, BizTalk360 will try to bring it to the desired state. You can also configure a maximum number of retries in the BizTalk360 portal. This is to prevent BizTalk360 to constantly keep on trying to bring the Azure Logic App back to the expected state, in case of some problem.
Multiple Azure Subscriptions
You might have multiple Azure subscriptions which contain different Azure Logic Apps. You can register all the relevant subscription and attach them to corresponding BizTalk Server environments within BizTalk360. This provides a seamless management/monitoring experience.
Data Monitoring of Logic Apps
With Data Monitoring of Azure Logic Apps, you can monitor for example whether:
- expected number of runs are met in a certain time frame
- a number of failures occur during a certain time frame
- number of billable trigger executions in a certain time frame
The above scenarios are just an example – there are many more combinations.
Data Monitoring of Logic Apps will be discussed in more detail in another article, but here we just wanted to reveal a bit of that feature.
Conclusion
With the rise of Hybrid integration solutions, the job of BizTalk administrators has extended to the (Azure) cloud. BizTalk360 helps these administrators by providing operational and monitoring support for a number of Azure services, thereby taking away the need to constantly have to check the Azure portal to be aware of the health of these services.
In this article, we discussed the state monitoring capability of Azure Logic Apps. If you want to read more about the other Azure services BizTalk360 supports, just follow the articles in the Why did we built series.
You can read more on setting up Azure Logic Apps monitoring on our Documentation portal.
Try BizTalk360 Free for 30 days today!
Download and try BizTalk360 on your own environments free for 30 days. Installation will not take more than 5-10 minutes.

Author: Lex Hegt
Lex Hegt works in the IT sector for more than 25 years, mainly in roles as developer and administrator. He works with BizTalk since BizTalk Server 2004. Currently he is a Technical Lead at BizTalk360. View all posts by Lex Hegt

by Lex Hegt | Feb 5, 2018 | BizTalk Community Blogs via Syndication
This blog is a part of the series of blog articles we are publishing on the topic “Why we built XYZ feature in BizTalk360”. Read the main article here.
Why do we need this feature?
As you will probably be aware of, BizTalk Server heavily relies on SQL Server databases for storing, for example, the configuration of BizTalk artifacts and the state of in-flight and completed processes. After installing and configuring BizTalk Server, few databases are created. The most important databases are the Configuration database, the MessageBox database and the Tracking database, but depending on the configured features, other databases might be created for BAM, BRE and SSO.
Further, there are a number of SQL jobs that gets created when you install and configure BizTalk Server. These SQL jobs are maintenance jobs and are of vital importance for the health of the BizTalk Server environment. The BizTalk SQL Jobs take care of making backups of the BizTalk databases, transfer tracking data from the MessageBox database to the Tracking database and all kind of cleaning up data from the databases.
Without having these jobs enabled (in cases disabled, not all the jobs are supposed to run) and properly running, it is just a matter of time, before you will get into trouble. This kind of trouble might lead to interruptions of the business process(es) which are being processed through BizTalk. For that reason, it is important to be aware of the (health) status of the SQL Jobs.
What are the current challenges?
There are two basic challenges at the moment with the current default tooling.
- There is no out of the box support for monitoring SQL Jobs and keeping an eye on the health
- Accessing SQL jobs for viewing, changing state, etc requires access to SQL Server
Although for experienced BizTalk administrators, it is obvious that they need to be well aware of the health of their BizTalk databases, for organizations with less experience on administrating BizTalk, this might come as a surprise.
We have seen that BizTalk administrators did not have access or insufficient access to the SQL Server management tools. This could especially be true, in case BizTalk Server has to share its SQL Server instance with databases of other systems, which is not a good idea anyway.
Even if the administrator has access to the SQL Management tools, having to manually monitor these SQL jobs is a time consuming and adds up to all the other assignments of the BizTalk administrator.
How BizTalk360 solves this problem?
As we, at BizTalk360, understand the importance of the SQL jobs, we brought both operational and monitoring features related to these jobs. In this section, we will discuss the Monitoring features.
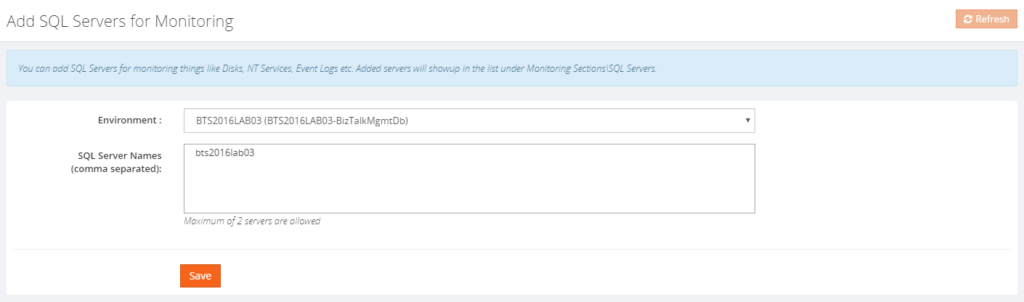
BizTalk360 allows you to set up monitoring on SQL jobs seamlessly. You need to simply register the name of the SQL Server instances where your SQL jobs are running via the Settings -> Monitoring -> SQL Server Instances and all the SQL jobs will be ready for monitoring configuration.
Once configured, BizTalk360 enables you to achieve the following:
- Monitor the Expected Job State (both enabled and disabled)
- Configure Auto-correct
- Monitor the Expected Last Job Run State
Below, all these capabilities will be discussed.
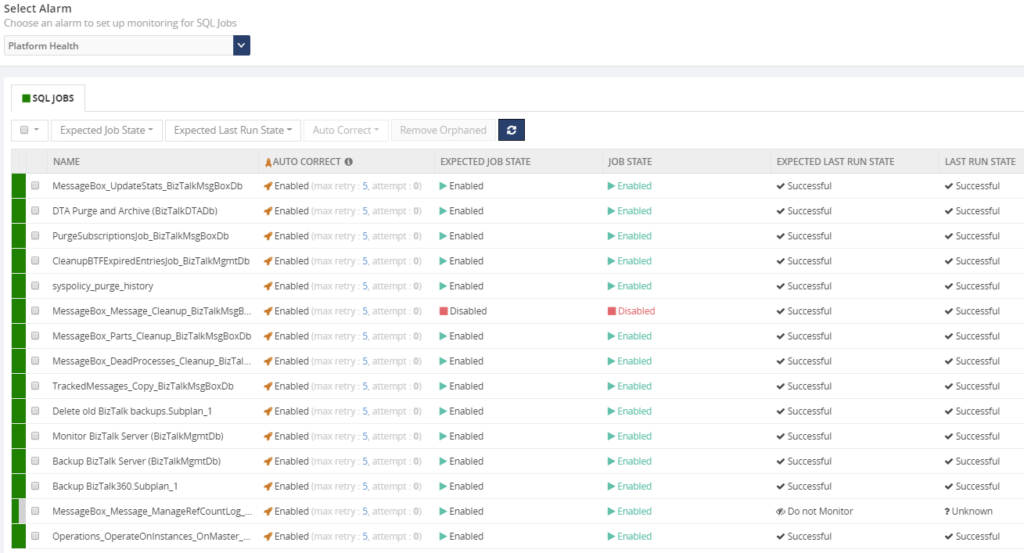
Monitor the Expected Job State
With this kind of monitoring, you can check whether the SQL job is in the correct state. In most cases, the expected state will be Enabled, but in certain cases, the expected state must be Disabled. BizTalk360 allows you to monitor for both states.
The possibility of negative monitoring comes in handy for BizTalk Server, as the MessageBox_Message_Cleanup_BizTalkMsgBoxDb jobs need to be in disabled state. This job works like a stored procedure and used internally by other jobs. It should not be manually started by a DBA or BizTalk Administrator.
Configure Auto-Correct
The Auto-Correct feature is an extension of Expected State Monitoring. Basically, it allows you to bring State-bound artifacts back to the expected state after they reached the wrong state.
Auto-correction works 2 ways. If an artifact, say a SQL Job, is expected to be in the Enabled state but reached the Disabled state, the Auto-Correct feature will try to bring the SQL job back to the Enabled state.
However, when a SQL job is expected to be in the Disabled state (like the MessageBox_Message_Cleanup_BizTalkMsgBoxDb job) but got Enabled, the Auto-Correct feature will try to bring the job back to the Disabled state.
This helps to maintain the state of the SQL jobs in the desired state even if there is a human error.
This feature works not just for SQL Server jobs, but also for:
- Receive Locations, Orchestrations and Send Ports
- Host Instances
- Windows NT Services
- Azure Logic Apps
Monitor the Expected Last Job Run State
This allows you to check whether the job runs successfully. Once you have setup monitoring for Expected Last Run state, you will be notified in case the Last Run State was unsuccessful.
Conclusion
By bringing SQL job monitoring, including the auto-correct feature, we think that this will make the life of both BizTalk administrators and SQL Server DBA’s a bit easier.
If you want to read more about SQL job monitoring, please read this article.
Get started with a Free Trial today!
If you are struggling with all the above-mentioned challenges, why not give BizTalk360 a try. It takes about 10 minutes to install on your BizTalk environments and you can witness and check the security and productivity of your own BizTalk Environments. Get started with the free 30 days trial.

Author: Lex Hegt
Lex Hegt works in the IT sector for more than 25 years, mainly in roles as developer and administrator. He works with BizTalk since BizTalk Server 2004. Currently he is a Technical Lead at BizTalk360. View all posts by Lex Hegt
by Gautam | Feb 4, 2018 | BizTalk Community Blogs via Syndication
Do you feel difficult to keep up to date on all the frequent updates and announcements in the Microsoft Integration platform?
Integration weekly update can be your solution. It’s a weekly update on the topics related to Integration – enterprise integration, robust & scalable messaging capabilities and Citizen Integration capabilities empowered by Microsoft platform to deliver value to the business.
If you want to receive these updates weekly, then don’t forget to Subscribe!
Feedback
Hope this would be helpful. Please feel free to provide any feedback on this Integration weekly series.

by Lex Hegt | Feb 2, 2018 | BizTalk Community Blogs via Syndication

This blog is a part of the series of blog articles we are publishing on the topic “Why we built XYZ feature in BizTalk360”. Read the main article here.
Why do we need this feature?
SOAP & REST based Web Services are one of the most used technologies in integration scenarios. In the last few years, the need for HTTP based communication with external vendors/systems has increased significantly. Pretty much it became a norm to expose the API’s of the system for external consumption. Examples: Salesforce API, Microsoft Graph API for Office365 and so on. Also, the companies want to reuse their legacy system as much as possible internally and they expose them as internal web services.
BizTalk Server offers great support for HTTP(S) based web services, both on the Receive and the Send side of interfaces.
When you are integrating multiple endpoints via HTTP(s), it is important to know whether the web services are available, responsive, returning expected values etc., to be able to communicate with them and to support the business process.
What are the current challenges?
The use of web services (web endpoints) comes into play on both receive side and send side in BizTalk Server. Both comes with its own significance and it’s important to monitor them.
Receive Side web services
BizTalk Server allows you to publish schemas and orchestrations as WCF services, which are then published in the IIS web server on the BizTalk Server. In case, you have multiple BizTalk servers in the same BizTalk group, you can set up an NLB (Network Load Balancing) cluster to achieve Load Balancing and High Availability.
The published WCF services are associated with Receive Locations. As a result, if something is wrong with a particular WCF service, for example, the Application Pool in IIS is down, the Receive Location will automatically be set to Disabled.
If the Receive Location/Port is down, then it won’t accept any incoming messages via this channel. Therefore, it’s important to make sure it’s up and running all the time.
Send Side web services
On the outgoing side, you configure either HTTP, SOAP, REST, BizTalk Send port to connect to external web endpoints. If something is wrong with the external web endpoints, the state of the Send Port will remain the same inspite of the state of the external web endpoint.
So, to be able to know the actual state of the web endpoint, the well-being of the endpoint will have to be monitored and checked. This helps to be sure that when a real request to the web endpoint is made, that the actual endpoint can be accessed and the request is properly being processed.
When a web service is down and requests are being sent to that web service, the failing requests will lead to suspended messages in BizTalk, resulting in an interruption of the business process and some work for the BizTalk administrator to have the issue solved and to resume the suspended messages.
An external web service can be down for a variety of reasons.
- Internal web server/service issues – you might get for example the famous, though non-informative, HTTP 500 return codes
- Certificate issues – expired certificates, incorrectly configured or unaccepted client certificates
- Firewall issues – web server/service cannot be contacted at all due to wrongly configured firewall rules
- Flooding – there’s more work than the web server/service can handle
All this kind of errors will lead to unavailability of the web endpoint and interruptions of the business process. This is exactly what we want to prevent, and as it is impossible for a BizTalk administrator to manually monitor web endpoints 24/7, it is way more efficient to have monitoring in place.
How BizTalk360 solves this problem?
For monitoring the physical HTTP web endpoints, BizTalk360 offers Advanced Web Endpoint Monitoring. Once set up, this feature will periodically fire requests against the web service which is being monitored and report any issues identified.
The feature is quite rich and offers, amongst others, support of:
-
- HTTP and HTTPS web services (REST/SOAP)
- Using Gateway proxies
- Providing credentials
- GET and POST methods
- Multiple content types like
- providing custom
- HTTP headers
- GET parameters
- POST payload
These features allow you to monitor for example HTTP return codes (200 is okay, 500 is warning/error). But you can also check for certain keywords to exist in the XML/JSON response message, by entering XPath/JSON queries.
You can even monitor for response times of the web service, as this might be an indication that the web service is under stress.
So with the Advanced Web Endpoint Monitoring feature of BizTalk360, you will be able to cover pretty much all the web endpoint monitoring scenarios, whether these web services reside inside your organization or outside and whether these services use XML or JSON.
Conclusion
To underline the importance of web endpoint monitoring, let’s shortly discuss the often forgotten concept of Chain Monitoring.
It is a bit of a human behavior, to just focus on your own work and systems, meanwhile forgetting the impact of your work on other systems.
A simple example: a Technical/Functional Application administrator is responsible for the administration of a CRM system. On a day to day basis, he is very busy with functional questions, which results in not always having the overview of the health of the web services of his CRM system, while these services received data on a regular base from an ERP system, via BizTalk Server.
It was with this kind of scenario where we have experienced that the BizTalk administrator who was using BizTalk360 and had set up Web Endpoint Monitoring, was notified by BizTalk360 of problems with a web endpoint. The administrator contacted the owner of the web endpoint, who was not yet aware of the issue! The issue was solved by the owner of the web service and no interruption of the business process took place.
The above example was based on a scenario which really took place in one of our customer and a very clear example of the purpose of Advanced Web Endpoint monitoring.
If you want to read more on the nitty/gritty of the Advanced Web Endpoint Monitoring feature in BizTalk360, please read this article.
Get started with a Free Trial today!
If you are struggling with the above mentioned challenges, why not give BizTalk360 a try. It takes about 10 minutes to install on your BizTalk environments and you can witness and check this feature on your own BizTalk Environments. Get started with the free 30 days trial.

Author: Lex Hegt
Lex Hegt works in the IT sector for more than 25 years, mainly in roles as developer and administrator. He works with BizTalk since BizTalk Server 2004. Currently he is a Technical Lead at BizTalk360. View all posts by Lex Hegt

by Saravana Kumar | Feb 1, 2018 | BizTalk Community Blogs via Syndication
This blog is a part of the series of blog articles we are publishing on the topic “Why we built XYZ feature in BizTalk360”. Read the main article here.
Why do we need this feature?
Microsoft shipped the ESB Toolkit back in 2007-2008 that extends the functionality of Microsoft BizTalk Server to provide a range of new capabilities for building SOA/ESB applications that incorporate things like itinerary based invocation for lightweight service composition without using Orchestrations, dynamic resolution of endpoints maps, Web services, exception management and reporting. They also provided a sample “ESB Exception Management” web application along with the toolkit.
The ESB Toolkit created a love/hate relationship with a lot of BizTalk Server customers even though it added a lot of value addition to BizTalk Server (as an add-on) while in some cases it simply complicated the solution.
The one thing that everyone loved about ESB Toolkit is the Exception Management framework and the sample web application that shipped with the Toolkit. Since the Exception Management part addressed two important challenges in an integration solution in an end-to-end Exception management framework, visualizing it in a web portal and ability to edit/resubmit failed messages, which were missing in BizTalk Server core.
What are the current challenges?
Sample Portal: The Exception Management Framework itself is a stable offering and fully supported by Microsoft. However, the portal that shipped with the ESB Toolkit is a “sample web application” built on top of the ESB Exception Database. It’s not fully supported by Microsoft and it’s kind of a half-baked solution with a lot of bugs.
Difficult to Install and Configure: Typically it takes few hours to one or two days to install and configure the ESB Exception management portal. It’s not maintained or updated as required over the years, and it uses certain components like older versions of “.NET Logging Application Blocks” that makes server level changes and affects your main BizTalk Solutions.
Missing Functionalities: As the ESB Exception Portal was shipped as a simple sample web application, it’s not matured and misses some important capabilities like “Bulk Edit/Resubmit” and functional alerting. Bulk edit/resubmit is very important since when there is a failure in your environment, you’ll typically have 10’s-100’s of failed messages for the same reason and you wanted to take bulk action.
The other important missing aspect is restricting users by permission and auditing, an example – you probably do not want all of your support people to have the ability to edit and resubmit messages. Even if they do, you need to have the traceability of who performed that action.
How BizTalk360 solves this problem?
We wanted to address the challenges highlighted above and also wanted to give a rich unified tooling experience for BizTalk Administrators. Hence we built the ESB Exception Management portal within BizTalk360 from the ground up. All you need to configure the ESB Exception management within BizTalk360 is to simply provide the connection string to your ESB exception database relevant to your BizTalk Environment. That’s it! You are set (takes about 3 minutes).
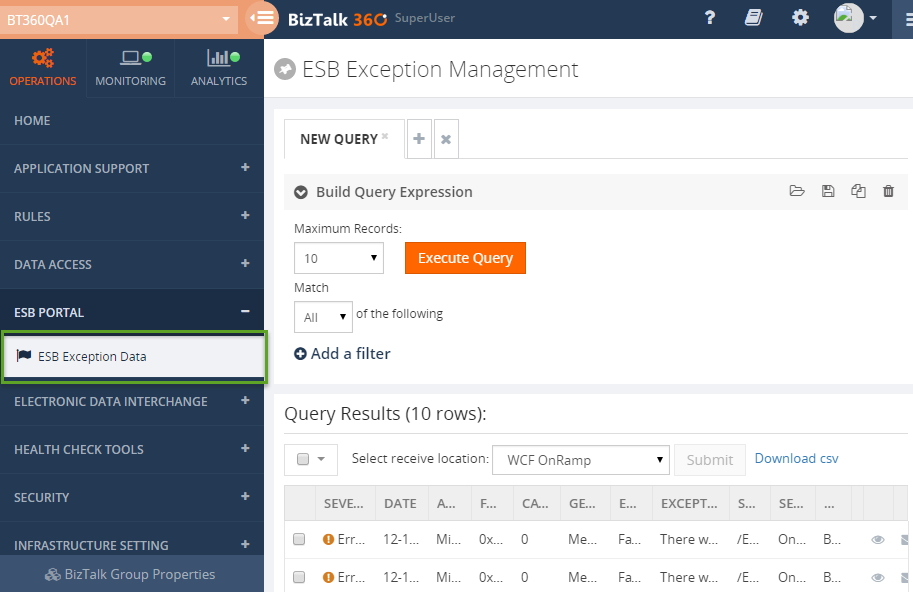
Since we built the ESB Exception Management portal from the ground up, we have thought through all the challenges in the sample portal and addressed them. It comes with the following set of features
- Rich ESB Exception Dashboard (utilizing our powerful customizable dashboard framework)
- Full Search/Filter/Display of exception details
- Edit Resubmit – both single and multiple records
- Download Messages – you can either download or email exception messages directly from the portal.
- Integrated Knowledgebase – you can associate a Knowledgebase article with known exceptions
- Security – ability to restrict user either to the full ESB portal section or allow them to do specific tasks like edit/resubmit
- Governance & Auditing – all the core activities like editing/resubmit by the users are audited.
- Rich Functional alerting – ex: if there are over 30 errors matching a specific error code in an application alert the administrator.
One of the other important objectives of BizTalk360 is to reduce the number of different tools the BizTalk Administrator has to use to support their BizTalk solution – tools such as Admin Console, BAM Portal, ESB Portal, SQL Management Studio, Perfmon and so on. This makes them totally unproductive and switch context between different applications. It is also difficult to on-board new people and bring them up to speed.
By bringing the ESB Exception Management portal within BizTalk360, we eliminate the need to use the sample ESB portal that comes with the toolkit.
Get started with a Free Trial today!
If you are struggling with all the above mentioned challenges, why not give BizTalk360 a try. It takes about 10 minutes to install on your BizTalk environments and you can witness and check the security and productivity on your own BizTalk Environments. Get started with the free 30 days trial.

Author: Saravana Kumar
Saravana Kumar is the Founder and CTO of BizTalk360, an enterprise software that acts as an all-in-one solution for better administration, operation, support and monitoring of Microsoft BizTalk Server environments. View all posts by Saravana Kumar
